

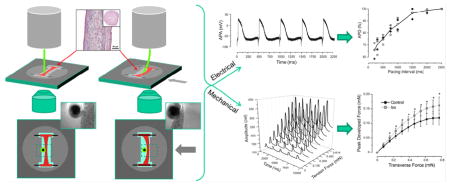
Abstract
Engineered 3D cardiac tissue constructs (ECTCs) can replicate complex cardiac physiology under normal and pathological conditions. Currently, most measurements of ECTC contractility are either made isometrically, with fixed length and without control of the applied force, or auxotonically against a variable force, with the length changing during the contraction. The “I-Wire” platform addresses the unmet need to control the force applied to ECTCs while interrogating their passive and active mechanical and electrical characteristics. A six-well plate with inserted PDMS casting molds containing neonatal rat cardiomyocytes cultured with fibrin for 13–15 days is mounted on the motorized mechanical stage of an inverted microscope equipped with a fast sCMOS camera. A calibrated flexible probe provides strain load of the ECTC via lateral displacement, and the microscope detects the deflections of both the probe and the ECTC. The ECTCs exhibited longitudinally aligned cardiomyocytes with well-developed sarcomeric structure, recapitulated the Frank-Starling force-tension relationship, and demonstrated expected transmembrane action potentials, electrical and mechanical restitutions, and responses to both β-adrenergic stimulation and blebbistatin. The I-Wire platform enables creation and mechanical and electrical characterization of ECTCs, and hence can be valuable in the study of cardiac diseases, drug screening, drug development, and the qualification of cells for tissue-engineered regenerative medicine.
Keywords: Cardiac tissue engineering, Frank-Starling relationship, force-frequency relationship, cardiac tissue elasticity, auxotonic contraction
Graphical abstract
1. Introduction
The growing interest in organs-on-chips, also known as tissue chips and in vitro organ constructs, is driven in part by the recognition that two-dimensional biology-on-plastic using immortal cell lines does not adequately recapitulate human physiology, particularly the details of the response of the cells to drugs and toxins [1;2]. A large number of in vitro organ-on-chip models have been developed [3;4], ranging from planar co-culture models of cellular endothelial-epithelial interfaces [5;6] to 3D multiculture models of the human brain neurovascular unit [7–10]. Mechanical activation is critical in some of these, for example the pulmonary alveolus-on-a-chip [5;11;12] and possibly the gut-on-a-chip [13], but only cardiac, vascular, and skeletal muscle tissue would be expected to exhibit intrinsic, mechanical contractions. Hence, these engineered tissues represent a special class of mechanically active biomaterials. In a companion paper, we describe how the mechanical behavior of these contractile biomaterials can be further analyzed using a computational Hill model [14].
The measurements of the force of contraction on muscle-on-chip preparations range from qualitative observations of the contraction of cellular monolayers supported on posts or a planar substrate [15;16] to quantitative measurements of the deflection of either passive cantilevers that support a monolayer of cells [17–20] or the ends of 3D fiber constructs [21–26]. A disadvantage of the cantilever technique is that it requires careful manufacturing of a cantilever substrate material that is not significantly stiffer than a cellular monolayer in order to avoid reducing the fractional shortening of the cells during contraction. An advantage of the 3D fiber constructs is that they can be created with minimal scaffolding. These two approaches, both free from mechanical input or control, should be suitable for high-throughput screening, but neither readily supports the full mechanical characterization typical of excised muscle preparations.
The literature certainly supports the value of active intervention to control the timing and amplitude of applied forces and/or strain to identify both passive elastic properties and active contractile behavior. The isolated papillary muscle, ventricular strips, and Purkinje fiber preparations have proven to be critical in understanding the passive and active electromechanical properties of cardiac tissue [27;28]. Full mechanical characterization of the passive and active elastomechanics of a single, end-supported cardiomyocyte can be accomplished using optical sensing and mechanical feedback control [29], albeit with rather expensive hardware (IonOptix, Westwood, MA, USA). At the opposite extreme of the single cardiomyocyte and to avoid the limitations of one-dimensional constructs, it should be possible to use molding and other tissue engineering and scaffolding techniques to create a 3D model of a working ventricle. Characterization of the resulting 3D construct would be difficult, however, because of both the complex topology and dynamics of a 3D engineered ventricle operating within a small bioreactor and the skill required to record the electrical and mechanical behavior of what is equivalent to a mouse heart [30]. Given the importance of the heart and its susceptibility to adverse drug interactions, and the limitations of the aforementioned approaches, there is a need for a 3D cardiac tissue model that is intermediate between a cellular monolayer and a complete ventricle. We describe a small-diameter, cylindrical heart-on-a-chip cardiac fiber construct, termed the I-Wire engineered cardiac tissue construct (ECTC), or more simply the “construct.” The ECTC does not require vascularization and is large enough to simplify quantitative measurements of both electrophysiological responses and the passive and active elastic properties of the constructs under different stimulus, mechanical loading, and drug and toxin protocols. We anticipate the applicability of the I-Wire system and the ECTC to drug development, toxicology, and physiology.
The I-Wire system can be implemented at low cost and small size to readily enable medium-throughput screening, which could include sustained electrical, mechanical, and/or pharmacological stimulation with continuous electrical and intermittent biomechanical recording. The system can be implemented with small fluid volumes to allow electrochemical and mass spectrometric characterization of the bioenergetic and metabolomic responses to electrical stimulation, mechanical loading, drugs, and toxins.
2. Methods
2.1. Preparing the PDMS casting mold
An array of six casting mold cavities was machined into a solid cast acrylic sheet using a 0.79 mm diameter end mill and a desktop CNC milling machine (MicroProto Systems, Chandler, AZ, USA) driven by Mach3 software and a personal computer. Each cavity had a depth of 3 mm and incorporated a set of four distinct thin ridges to define channels suitable for later placement of anchoring wires. After cleaning the machined cavities, a narrow rim of card stock paper was placed around the 75 mm x 75 mm array of six cavities, and each of the cavities was filled to overflowing with liquid PDMS activated in a 10:1 weight ratio with curing agent (SYLGARD™ 184 kit, Dow Corning, Midland, MI, USA). The filled mold array was placed in a vacuum chamber for 15 minutes to degas the PDMS, and then a flat plastic plate was lowered onto the array for meniscus elimination and surface leveling. The assembly was placed in a 65°C oven overnight to cure the PDMS. Thereafter, the six-I-Wire array was removed from the mold and individual devices were separated and transferred to the six-well plate. Two titanium wires were inserted in the channels on opposite sides of the device (Fig. 1A) to serve as anchors at each end of the construct.
Fig. 1.

Measurement system for the ECTC. (A) A PDMS-fabricated insert that fits into a six-well plate with its cardiac tissue construct. Two additional ridges are for electrodes for long-term field stimulation. (B) Magnified image of the ECTC depicted by white rectangle in panel A. The construct is attached to titanium wires. (C) Image of the central part of the ECTC and the tip of the flexible probe recorded with a Zyla sCMOS camera. (D) The sequence of processed binary images showing probe tip location during an ECTC contraction. The number in the upper right corner of each image represents elapsed time (ms). The image dimension is 700 μm x 350 μm. (E) Schematic representation of the basic probe geometry. (F) Force sensor calibration graph. The graph includes three probes with two measurements for each probe at each plotted point.
2.2. Cell isolation and culturing
All experiments conformed to the Guide for the Care and Use of Laboratory Animals published by the US National Institutes of Health and were approved in advance by the Vanderbilt Institutional Animal Care and Use Committee.
Neonatal rat ventricular cells were obtained from 2-day-old neonatal Sprague-Dawley [31] rats using a trypsin digestion protocol with agitation overnight at 4°C [17;32] and plating cells for 40 minutes at 37°C. The population of isolated cells is heterogeneous and besides cardiomyocytes includes fibroblasts, endothelial cells, and vascular smooth muscle cells [33]. The presence of the different cell types is important for formation of the extracellular matrix and tissue structure. The isolated cells were mixed with fibrinogen (5 mg/mL, Sigma-Aldrich, St. Louis, MO, USA) / Matrigel™ (100 μL/mL, BD Biosciences, San Jose, CA, USA) plus thrombin (15 μL, 100 U/mL, Sigma-Aldrich, St. Louis, MO, USA) [34], and pipetted in a casting mold (Fig. 1A). Thereafter, cells were kept at 37°C in a 5% CO2 humidified cell culture incubator for 1 hour. When fibrinogen was polymerized, 2 mL of cell culture media was added per well. The culture medium consisted of DMEM (Gibco Fisher Scientific, Waltham, MA, USA), 10% horse serum (Gibco Fisher Scientific, Waltham, MA, USA), 2% chick embryo extract (US Biological Fisher Scientific, Waltham, MA, USA), 1% penicillin/streptomycin (Gibco Fisher Scientific, Waltham, MA, USA), 10 μg/mL insulin (Sigma-Aldrich, St. Louis, MO, USA), 400 μM tranexamic acid (Sigma-Aldrich, St. Louis, MO, USA), and 33 μg/mL aprotinin (Sigma-Aldrich, St. Louis, MO, USA) [34]. Over time, the preparation condensed to form elongated muscle fibers of 350–400 μm in diameter and 7 mm long. After 13–15 days of culturing, the contractility and stiffness of the ECTC (Fig. 1B, C) could be measured using our microscope-based optical setup (Fig. 1E).
2.3 Registration system for the contraction recording
To apply tensional force to the ECTC and detect contraction, a flexible PEEK tube of 365 μm in outer diameter and 120 μm bore (Putnam Plastics, Dayville, CT, USA) and 28 mm length was glued to a Plexiglas cantilever adjuster attached to a cantilever support plate with two embedded position-control magnets (Fig. 1E). The stiffness of the probe was roughly matched to that of the ECTC; one might choose to use either a softer or stiffer probe to study ECTCs with different mechanical properties. The cantilever support plate with cantilever adjuster and flexible probe was mounted with a friction fit to the condenser of the inverted optical microscope (Eclipse Ti, Nikon, Melville, NY, USA) equipped with a digital camera system (Zyla sCMOS Camera, Andor Technology, Belfast, Northern Ireland). The 16.6 x 14.0 mm sensor has 2560 x 2160 pixels resolution, and a spatial resolution of 3.25 μm/pixel. Movies (15 seconds in duration) were acquired at 200 frames per second. The microscope was equipped with a motorized stage (MS-2000 Flat-Top XYZ Automated Stage, ASI, Eugene, OR, USA), which could be moved precisely in a horizontal plane and thereby apply a lateral horizontal force at the mid-section of the ECTC normal to the long axis of the ECTC, which was anchored at both ends (Fig. 1B). The spring characteristic of the plastic cantilever was calibrated using an analytical balance (Ohaus Corporation, Parsippany, NJ, USA) and a high precision micromanipulator (Newport, Irvine, CA, USA), and it demonstrated a linear weight - displacement relationship (Fig. 1F). During contraction of the ECTC, the optical registration of the distance of probe tip displacement was used to calculate the force involved in deforming the ECTC.
2.4 Registration of action potential and reconstruction of electrical and mechanical restitution
Action potentials were recorded by utilizing floating micropipettes filled with 3-M KCl [35]. The micropipettes were pulled from borosilicate glass capillaries (WPI, Sarasota, FL) by a micropipette puller (P80/PC, Sutter Instruments, Novato, CA, USA). The tips of the micropipettes were mounted on a platinum wire of 50 μm diameter. The reference Ag/AgCl electrode (EP8, WPI, Sarasota, FL, USA) was placed in the well next to the PDMS insert. The electrodes were connected with a dual differential electrometer (Duo 773, WPI, Sarasota, FL, USA) and signals were digitized, visualized, and recorded by a digital oscilloscope (TDS5034B, Tektronix, Beaverton, OR, USA). The sampling rate was 25 kHz. The recorded data were processed with a Savitzky-Golay digital filter (OriginLab, Northampton, MA, USA). To inhibit contractility, the excitation-contraction uncoupler blebbistatin (Sigma-Aldrich, St. Louis, MO, USA) was applied at a concentration of 6 μM. A red filter (Edmund Optics, Barrington, NJ, USA) was used to prevent photolysis of blebbistatin during microscopic observation. The action potential duration (APD) was detected at a level of 90% of recovery. The dynamic pacing protocol started with a stimulation interval of 2500 ms and was gradually reduced with steps of 50–500 ms. The voltage (six times threshold) was delivered via the anchoring titanium wires (0.25 mm, Sigma-Aldrich, St. Louis, MO, USA) by a Grass square pulse stimulator (Grass SD9, Warwick, RI, USA). To reconstruct the mechanical restitution curve, the ECTCs were paced with frequencies of 0.5, 1, 2, 3, and 4 Hz at an applied transverse force of 0.54 mN. The contractility was also tested by β-adrenergic stimulation using isoproterenol (Sigma-Aldrich, St. Louis, MO, USA) at a concentration of 1 μM.
2.5. Data processing and analysis
The optical recordings of contracting ECTCs were imported as movies into MATLAB (MathWorks, Natick, MA, USA) for the following analysis. First, the image contrast was adjusted to image only the tip of the flexible cantilever (Fig. 1C). Thereafter, the data were processed to create a binary (black and white) image (Fig. 1D). Then, the coordinates of the centroid were detected for each image in a binary movie data set. The resulting traces are depicted in Fig. 4A. To represent a single contraction, seven successive contractions in one recording were averaged. Movies showing contracting ECTCs at different tension and stimulation frequency and a binary movie demonstrating the displacement of only the flexible probe tip are presented in the Supplementary Material.
Fig. 4.

Contractile properties of the ECTC. (A) Representative, original, uncalibrated contractile force traces recorded (as pixels of deflection) at different applied transverse forces in one ECTC. The stimulation period is 2 s. The units of amplitude are pixels. (B) Superimposed developed force traces as a function of applied tension. (C & D) Mechanical restitution curve and traces recorded in one experiment. (E & F) Mechanical restitution and contraction velocity data (N = 6).
Using the optical measurement of the probe tip displacement, we computed the lateral displacement of the ECTC, the length of the anchored ECTC, the geometry of the probe placement, and the developed force in the ECTC as a function of time. The exerted force during contraction and relaxation is represented by the maximal force measured in the ECTC during contraction and the minimal force measured during relaxation, respectively. The developed force was shown by the change in the location of the probe tip over time. The maximum contraction velocity was determined as a maximum of the derivative of the contraction trace. ECTC stretch was calculated as a fraction of ECTC length change in relation to initial ECTC dimension. The details of the force calculation are presented in the Supplementary Material.
The cross-sectional area of the construct was computed based on the ECTC diameter as a mean value of three measurements: at the middle point of the ECTC and at two points 1 mm distant from the middle point on the left and right sides.
2.6. Calculation of elastic modulus
The described system can also be used to provide important information concerning the elastic properties of the ECTC. To estimate the contribution of the passive and active contractile elements in elasticity, the recordings were acquired before and after administration of 6 μM of blebbistatin in the same ECTCs. Blebbistatin is a reversible specific inhibitor of adenosine triphosphatase associated with myosin II isoforms [36;37] and hence blocks active muscle contraction.
At first, the linear part of the ECTC stretch-force curve was fitted using a linear equation and the amount of change of ECTC length was calculated. The value of elastic modulus, E, was computed as a stress/strain ratio [38]:
where FC is the longitudinal force exerted on the construct, Lo is the length of the ECTC, Ao is the cross-sectional area, and ΔL is the amount by which the length of the construct changed. Taking into account the geometry, we computed the elastic modulus using the equation
where FP is the transverse force applied by the probe to the ECTC, ds is the distance between the initial and current position of the stage, dt is the distance between the initial and current position of the flexible probe tip, α is one-half the length of the resting construct, and D is the diameter of the ECTC. A diagram and the details of the elastic modulus calculation are presented in the Supplementary Material.
2.7. Immunohistochemistry
After two weeks’ incubation in the mold and after the measurements, the ECTC was fixed in 4% paraformaldehyde for 15 min, washed 3 times with PBS, processed, and embedded in paraffin blocks. The embedded ECTC was sliced into 5-μm sections. The antigens were retrieved by incubation sections at 94°C in 10 mM sodium citrate buffer (pH 6.0) for 10 min. Antibodies were utilized as follows: mouse monoclonal antibodies against the heavy chain of myosin II (MF 20, 1:15, Developmental Studies Hybridoma Bank) and a rabbit polyclonal antibody specific for connexin 43 (H-150, 1:100, Santa Cruz Biotechnology, Dallas, TX, USA). The secondary staining was conducted using goat anti-mouse Alexa 568-conjugated and donkey anti-rabbit Alexa 488-conjugated antibodies (Thermo Fisher Scientific, Waltham, MA, USA) for MF 20 and H-150, respectively. Nuclear staining was performed using DAPI (DAPI Fluoromount-G, Southern Biotech, Birmingham, AL, USA).
2.8. Statistical methods
Group data are presented as mean±SE. The statistical comparisons between two groups were made with an unpaired and paired Student’s t-test. Values of P<0.05 were considered statistically significant. We utilized regression analysis to estimate the relationship between weight and displacement during calibration of the flexible probe.
3. Results
3.1. Structural and electrophysiological phenotype of the ECTC
We examined ECTCs that were created by mixing neonatal cardiac cells with MatrigelTM/fibrinogen gel and thrombin and seeding them in PDMS casting molds at a final density of 4x10⁶ cells/mL [34]. At the beginning, the gel containing rounded cells distributed uniformly within the PDMS mold. As the cultured cells matured within the construct, they elongated, aligned along the long axis between two wires, remodeled and contracted the gel, and started synchronously beating after 5–6 days of culture. By the 10th – 12th day of culture, the construct formed an elongated cardiac muscle of 300–400 μm in diameter. Figure 2A illustrates H & E staining of the ECTC sectioned along the longitudinal axis, with the ECTC cross-section shown in the insert. One can see densely packed myofibers with elongated nuclei. ECTC immunostaining for myosin II heavy chain (red; Fig. 2B) illustrates even distribution of the cardiomyocytes across the preparation. Immunostaining using antibodies specific for electrical coupling protein connexin-43 (green; Fig. 2C) revealed consistent spreading of the gap junctions throughout the ECTC (Fig. 2C). The higher magnification in Fig. 2D shows elongated, longitudinally aligned cardiomyocytes (CMs) with a developed sarcomeric structure (red) and colocalized gap junctions (green).
Fig. 2.
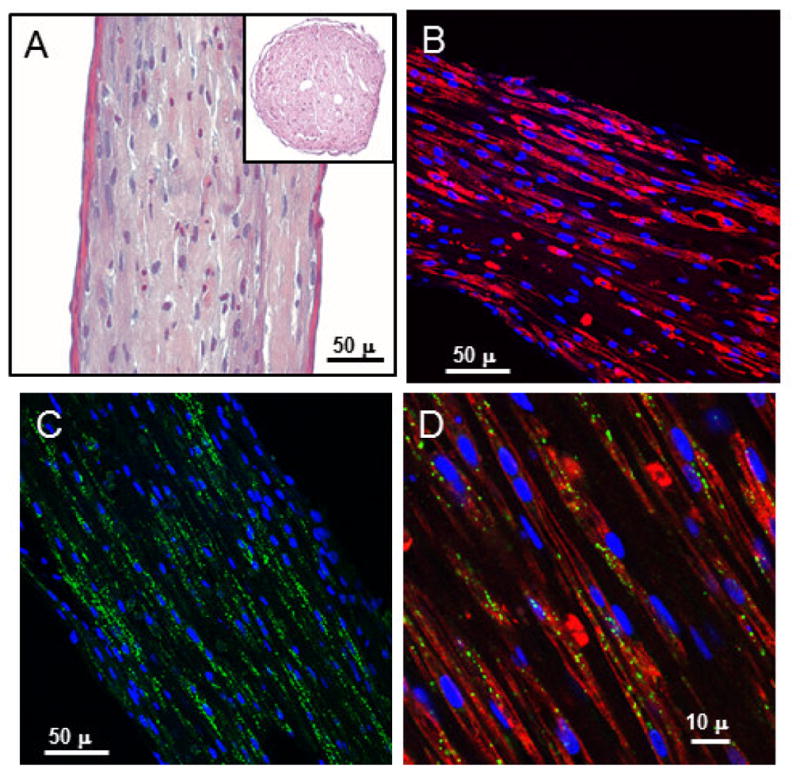
Histological imaging of the ECTC after 15 days in culture. (A) H & E staining of longitudinal section of the cardiac tissue construct. Insert is a cross-section. (B) Uniform distribution of the cardiomyocytes immunostained for heavy chain of myosin II (red). (C) Immunostaining of electrical coupling protein connexin-43 (green). (D) Higher magnification illustrates longitudinally aligned, elongated cardiomyocytes with well-developed sarcomeric structure (red) and connexin-43 (green) positive gap junctions. Nuclear staining was performed using DAPI (blue).
We characterized the electrophysiological properties of the ECTC using microelectrode measurements. The AP amplitude (APA) and resting potential were 86 ± 3.4 mV and -67 ± 4.1 mV (N = 5) at a pacing interval (PI) of 2000 ms (Fig. 3). The change of pacing rate from 2000 ms down to 500 ms significantly decreased APD from 236 ± 28 ms to 177 ± 12 ms, respectively (P < 0.01).
Fig. 3.

APD restitution in the ECTC. (A) Representative APs recorded with a floating glass micropipette during stimulation with a PI of 500 ms. (B) Superimposed filtered and normalized APs recorded at a PI of 500 ms, 1000 ms, and 2000 ms. (C) The relationship between APD and PI (N = 5).
3.2. Mechanical restitution in the ECTC
Fig. 4 illustrates a typical experiment when contractility was measured as a function of applied transverse force (Fig. 4A, B) and pacing rate (Fig. 4C–F). The gradual elevation of the applied force to 0.69 mN by gradual translation of the microscope stage resulted in both an extension of the ECTC (shift in base line) and an increase in contraction amplitude (Panel A). The Frank-Starling relationship is evident in Fig. 4B, when calibrated traces of a single contraction are superimposed.
The contraction force of cardiac muscle depends on the previous recovery time. To examine the force-frequency relationship, the pacing rate was progressively increased from 0.5 Hz to 4 Hz. The characteristic time course of mechanical restitution and related contraction traces recorded in a single experiment are represented in Figs. 4C and D. The amplitude of the contraction force decreases with an increase of the stimulation frequency, indicating behavior termed “negative staircase” [39]. Figure 4E demonstrates the force-interval relationship including six different experiments. It should be noted that the mechanical restitution curve has a flat interval between PIs of 500 ms and 660 ms. The related dip in contraction velocity-interval curve occurs at a PI of 660 ms (Fig. 4F).
3.3. Adrenergic stimulation
The most important regulation of cardiac inotropy is mediated by adrenergic stimulation [40]. In the current work, we administrated isoproterenol at a concentration of 1 μM to assess the degree of ECTC maturation and to validate the potential of ECTCs for investigation of the effects of pharmacological agents. The inotropic response of β-adrenergic stimulation is demonstrated in Fig. 5. Application of the isoproterenol caused a significant increase of the developed force for applied transverse forces greater than 0.156 mN and statistically significant acceleration of the contraction velocity when the applied force exceeded 0.233 mN (P < 0.05, N = 7). The separate analysis of the effect of the β-adrenergic agonist on the force exerted by the ECTC during contraction and relaxation revealed that a significant change occurs only in the phase of relaxation, indicating that the drug-induced elevation of the developed force was offset almost exactly by the enhanced relaxation (Fig. 5C).
Fig. 5.

Inotropic response of the ECTC to β-adrenergic stimulation. (A) Developed force during control and application of 1 μM of isoproterenol in a single experiment. The stimulation period is 2 s. The first 800 ms of contraction trace are shown. The uncalibrated traces are shown in Fig. S2. Effect of isoproterenol (1 μM) on: Frank-Starling force-tension relationship, values are means ± SD (B); forces exerted in contraction (upper) and relaxation (lower) (C); contraction velocities (D). Control is black and isoproterenol is gray. *P< 0.05, N = 7.
3.4. Elasticity measurement
The elastic modulus of an object is defined as the slope of its stress-strain curve in the elastic deformation region [41]. To measure the elastic properties of the ECTC, the stretch-stress curve was reconstructed and then the slope of the linear part of the curve was utilized to calculate Young’s modulus. Fig. 6A illustrates a typical experiment showing how the length of the ECTC alters during contraction as a function of the tensional force. It is evident that extensions of the ECTC in both contraction and relaxation phases increase in relation to stress. The stretch-stress curves created for contraction and relaxation phases as well as for ECTCs treated with blebbistatin to block contraction are represented in Fig. 6B. A substantial elongation of the ECTC is observed when the tensional force is increased above 0.15 mN. All three conditions demonstrated progressive increase of ECTC length as the applied force was increased. The slopes of the fitted straight line for systolic, diastolic, and blebbistatin-treated ECTCs were 4.9, 15.1 and 17.5%/mN, respectively. Fig. 6C shows the effect of blebbistatin on elasticity of the ECTC more clearly. The treatment with 6 μM of blebbistatin significantly decreased the Young’s modulus of the ECTC from 13.4 ± 2.5 kPa to 10.3 ± 2.8 kPa (Fig. 6C; N = 5, P < 0.05), a value that represented the intrinsic stiffness of the 3D construct.
Fig. 6.

Change of ECTC elasticity in response to application of blebbistatin. (A) Overlaid traces showing change in stretch during a contraction cycle, recorded at different tensions in a single experiment. (B) Tension-dependence of stretch during contraction, relaxation, and under blebbistatin at 6 μM. *P < 0.05 is for blebbistatin compared with relaxation, #P < 0.001 is for relaxation compared with contraction, N = 5. (C) Young’s modulus of the ECTC calculated in relaxation and under blebbistatin, N = 5, *P < 0.05.
4. Discussion
Characterization of ECTCs
To estimate the functionality of engineered 3D cardiac tissue, the majority of techniques incorporate measurements of the contractility using a force transducer [42–45] or an optical system that records the deflection of a passive cantilever [18;21;22;34;46]. The drawback of force transducer systems is that they record isometric contraction, in which the ends of the construct are fixed and muscle length cannot change and perform external work, which is the product of force times distance shortened [47;48]. The weakness of prior systems based on optical recording of passive cantilever deflection is the inability to control the tensional force applied to the construct. Magnetically actuated microcantilevers have been used to control the applied forces, but this technology has yet to be extended to ECTCs [49].
Interpretation of I-Wire results
In this work we described the I-Wire platform we developed to grow 3D cardiac tissue constructs and to conduct measurements of their mechanical and electrophysiological parameters to estimate the functionality of the ECTC in both normal and pharmacologically modified conditions. The advantage of our approach over others that measure the passive deflection of PDMS posts [21;22;34]] is that we can control the force applied to the ECTC by the cantilever probe, and measure the passive and active responses to different applied transverse forces, all using a single ECTC. While the measurements we report on ECTCs could be accomplished with a force transducer and a linear actuator, as has been reported for skeletal muscle [50], these two instruments are both large and expensive and, like classical measurements of biomaterials elasticity, require the mounting of the construct in a separate instrument. In our approach, a low-cost mold with embedded wires is used to grow the ECTC, which need not be removed from the culture system for characterization. The wires can be used for electrical stimulation, either acutely during the measurement or chronically during culture. We are currently devising a compact system that can apply a steady, controlled mechanical force to each ECTC during culture, and it will be only a modest extension of this approach to implement a flexible, controlled cantilever that is dedicated to each construct in a well plate, thereby scaling this approach to at least medium throughput, with all measurements made in a closed, sterile incubator.
Our approach to form and characterize ECTC was assessed by utilizing neonatal rat CMs and a fibrin-based ECM [34]. After molding and 13–15 days of culture, the neonatal CMs had differentiated into highly functional 3D cardiac fibers with well-organized tissue and sarcomeric structure.
The electrical restitution curve recapitulated the restitution dynamic characteristic for native myocardium, which has a slope >1 [51]. Along with APD restitution, the mechanical restitution or force-frequency relationship is an essential inherent mechanism to regulate heart contractility. It is accepted that the integrated intracellular Ca2+ change is generally responsible for the force-frequency relationship, and intracellular Ca2+ dynamics are mainly determined by sarcoplasmic reticulum Ca2+ load, L-type Ca2+ channels, and Na+-Ca2+ exchanger [52]. The mechanical restitution curves constructed from our measurements demonstrated two phases. The first phase of the negative staircase, when the increase in stimulation frequency reduced the developed force [53], was detected for pacing intervals longer than 660 ms. The subsequent transient plateau phase appeared in a range of 660–500 ms and was followed by a second phase of negative force-frequency relationship for a faster stimulation rate (Fig. 4E).
It should be noted that the behavior of the force-frequency relationship is markedly species-dependent [54]. Most species exhibit positive staircase [55]. In rabbit hearts the positive force-frequency relationship was observed during slow stimulation rates and staircase became negative when pacing rate was increased to physiological beating frequencies, thereby demonstrating biphasic mechanical restitution [56]. The force-frequency relationship in rat and mouse myocardium change was the opposite: negative during slow pacing, up to 1–2 Hz, and positive for stimulation frequencies in a range of 1–4 Hz [54;57].
Bers et al. have suggested that due to high intracellular Na+ in rat and mouse CMs, the reversal potential for Na+/Ca2+ exchanger is slightly lower than transmembrane potential, and that this facilitates Ca2+ uptake during diastole and could result in negative staircase in rodent hearts detected at long pacing intervals [58]. Recently, Godier-Furnémont et al. demonstrated that concurrent mechanical and electrical stimulations of the ECTC can determine the force-frequency relationship [23]. In particular, stimulation with a frequency of 4 Hz for 5 days after day 8 of culture of ECTC grown from neonatal rat cardiomyocytes resulted in a positive staircase for pacing faster than 1 Hz, but stimulation with lower frequencies led to a negative staircase. The authors emphasize that the difference in formation of T-tubules and maturated sarcoplasmic reticulum underlies the observed phenomenon. It should be noted that because of an undeveloped vascular system, the fast pacing-induced metabolic starvation also could be responsible for the negative treppe effect at short stimulation intervals.
ECM, by linkage with the cytoskeleton and myofilaments through matrix receptors, is critical to maintain elasticity and to support the mechanical stress in the heart, hence remodeling of ECM and change of the cardiac tissue elasticity are often related with cardiac disease [59–61]. There is also a strong relationship of CM maturation and contractility to the elasticity of ECM or substrate stiffness in vitro. In particular, Jacot et al. have shown that neonatal CMs plated on gels with an elasticity of 10 kPa demonstrated larger calcium transients, more developed sarcoplasmic calcium stores, and greater mechanical force than cells grown on stiffer or softer substrates [62]. Another group found that to support function of the CMs isolated from chick embryos for a long time, the optimal matrix elasticity should be within 9–14 kPa [63]. The elastic modulus determined in our measurements was 13.4 kPa. This value is between the lower number of 10 kPa considered as optimal for substrate to grow 2D cardiac tissue [63;64], and higher values of 18–25 kPa measured in normal rat heart muscle [61;62;65]. The present results suggest that neonatal cardiac cells are able to form the I-Wire construct with a biomechanical microenvironment similar to that of normal heart muscle.
To modify the elasticity of the ECTC, we utilized blebbistatin, which inhibits both the adenosine triphosphatase and the gliding motility of myosin II [36;66]. Specifically, it binds to the myosin-ADP-Pi complex, impedes phosphate release, and thereby stabilizes the metastable state of myosin [37;66]. The application of 6 μM of blebbistatin decreased ECTC stiffness by 23%. In experiments on isolated mice CMs using a carbon fiber system, King et al. observed significant lowering (30%) of the diastolic stress after application of the blebbistatin, suggesting that interaction between actin and myosin during diastole is not completely interrupted and that titin plays the key role in both restoration and passive stress of the intact CMs [67]. In engineered tissue, the ECM, cell-to-cell and cell-ECM junctions, and the passive action of titin likely contribute to stiffness and could explain the lower effect of the blebbistatin in the ECTC.
The β-adrenergic stimulation predictably caused an increase in the developed force amplitude and velocity of contraction, but led to shortening of the contraction duration in the ECTCs (Fig. 5). A separate analysis of the exerted force developed in systole and diastole revealed a significant effect of the isoproterenol only during the diastolic phase. This is consistent with effects of the β-adrenergic stimulation in native myocardium, wherein the phosphorylation of phospholamban and troponin I mostly contributes to enhanced diastolic relaxation [40;68]. An analysis of these effects in terms of the Hill model of muscle is presented in the companion paper [14].
It should be noted that Frank-Starling systems commonly apply a uniaxial tensional force, though the “classical” Starling’s law describes the volume-pressure relationship in the whole heart. The length-tension relationship is considered a manifestation of this law at the cell or tissue level. The behavior of the Starling curve is mainly determined by actin-myosin interaction, and our system faithfully reproduces the physiological range of the length-tension relationship: the ascending limb and plateau. It is important to note that during the cardiac cycle the ventricular wall undergoes not only uniaxial but lateral force as well. This also relates to trabeculae on the endocardial surface. From this perspective we believe that our model closely reproduces in vivo physiology.
It is also important to recognize that the small diameter of our constructs (350–400 μm) and their being surrounded by media ensure that each myocyte is within 175–200 μm of well-oxygenated media, which should preclude the metabolic insufficiencies associated with thick, engineered muscle slabs. The classic studies on isolated papillary muscles, ventricular trabeculae, and cardiac Purkinje fibers have been conducted without the benefit of perfused microvasculature. Undoubtedly, we anticipate the development of vascularized or at least internally perfused constructs in the near future.
Conclusion
The optical registration of the flexible sensor movement allows quantitative measuring of contraction forces under different auxotonic loading conditions and pharmacological interventions. The quantitative measurements and modeling enabled by our I-Wire platform have great potential in pharmacology for new drug screening, cardiotoxicity, and basic science to investigate mechanisms of cardiac disease in both transgenic animal models and in human 3D cardiac tissue engineered from hiPSC-derived CMs. Obvious future extensions of the technique include its use with other mesenchymal cells and with CMs derived from the hiPSCs from both normal subjects and patients with cardiac disease, and fluorescent measurements of AP propagation along the fiber and the associated Ca2+ signals [69]. The small volume of fluid surrounding the ECTC is ideal for electrochemical measurements of glucose and lactate fluxes, oxygen consumption and acidification [70], and mass spectrometric measurements of cardiac metabolomics [71].
Supplementary Material
Acknowledgments
Research reported in this publication was supported in part by National Institutes of Health Grants R01HL118392 (MSS), R01 HL095813 (CCL), and 5R01-AR056138 (JMD); by the Department of Veterans Affairs (JMD); the Defense Threat Reduction Agency grant CBMXCEL-XL1-2-001 (JPW); and the Vanderbilt Institute for Integrative Biosystems Research and Education. The content is solely the responsibility of the authors and does not necessarily represent the official views of the funding agencies. The authors thank Allison Price for assistance with the preparation of manuscript, Stephen R. Koch for the early development of the I-Wire device, and Matthew S. Shotwell and Ronglih Liao for comments and discussion.
Appendix A. Supplementary Material
Supplementary Material related to this article can be found at _____________________.
Footnotes
Disclosures
The authors have declared that no conflicts of interest exist.
Publisher's Disclaimer: This is a PDF file of an unedited manuscript that has been accepted for publication. As a service to our customers we are providing this early version of the manuscript. The manuscript will undergo copyediting, typesetting, and review of the resulting proof before it is published in its final citable form. Please note that during the production process errors may be discovered which could affect the content, and all legal disclaimers that apply to the journal pertain.
References
- 1.Wikswo JP. The relevance and potential roles of microphysiological systems in biology and medicine. Exp Biol Med. 2014;239:1061–1072. doi: 10.1177/1535370214542068. [DOI] [PMC free article] [PubMed] [Google Scholar]
- 2.Wikswo JP, Porter AP. Biology coming full circle: Joining the whole and the parts. Exp Biol Med. 2015;240:3–7. doi: 10.1177/1535370214564534. [DOI] [PMC free article] [PubMed] [Google Scholar]
- 3.van der Meer AD, van den Berg A. Organs-on-chips: breaking the in vitro impasse. Integr Biol. 2012;4:461–470. doi: 10.1039/c2ib00176d. [DOI] [PubMed] [Google Scholar]
- 4.Ghaemmaghami AM, Hancock MJ, Harrington H, Kaji H, Khademhosseini A. Biomimetic tissues on a chip for drug discovery. Drug Discov Today. 2012;17:173–181. doi: 10.1016/j.drudis.2011.10.029. [DOI] [PMC free article] [PubMed] [Google Scholar]
- 5.Huh D, Matthews BD, Mammoto A, Montoya-Zavala M, Hsin HY, Ingber DE. Reconstituting Organ-Level Lung Functions on a Chip. Science. 2010;328:1662–1668. doi: 10.1126/science.1188302. [DOI] [PMC free article] [PubMed] [Google Scholar]
- 6.Vrana NE, Lavalle P, Dokmeci MR, Dehghani F, Ghaemmaghami AM, Khademhosseini A. Engineering Functional Epithelium for Regenerative Medicine and In Vitro Organ Models: A Review. Tissue Eng Pt B: Rev. 2013;19:529–543. doi: 10.1089/ten.teb.2012.0603. [DOI] [PMC free article] [PubMed] [Google Scholar]
- 7.Morin-Brureau M, De Bock F, Lerner-Natoli M. Organotypic brain slices: a model to study the neurovascular unit micro-environment in epilepsies. Fluids Barriers CNS. 2013;10:1–12. doi: 10.1186/2045-8118-10-11. [DOI] [PMC free article] [PubMed] [Google Scholar]
- 8.Choi SH, Kim YH, Hebisch M, Sliwinski C, Lee S, D'Avanzo C, Chen H, Hooli B, Asselin C, Muffat J, Klee JB, Zhang C, Wainger BJ, Peitz M, Kovacs DM, Woolf CJ, Wagner SL, Tanzi RE, Kim DY. A three-dimensional human neural cell culture model of Alzheimer's disease. Nature. 2014;515:274–278. doi: 10.1038/nature13800. [DOI] [PMC free article] [PubMed] [Google Scholar]
- 9.Maschmeyer I, Lorenz AK, Schimek K, Hasenberg T, Ramme AP, Hubner J, Lindner M, Drewell C, Bauer S, Thomas A, Sambo NS, Sonntag F, Lauster R, Marx U. A four-organ-chip for interconnected long-term co-culture of human intestine, liver, skin and kidney equivalents. Lab Chip. 2015;15:2688–2699. doi: 10.1039/c5lc00392j. [DOI] [PubMed] [Google Scholar]
- 10.Brown JA, Sherrod SD, Goodwin CR, Brewer B, Yang L, Garbett KA, Li D, McLean JA, Wikswo JP, Mirnics K. Metabolic Consequences of Interleukin-6 Challenge in Developing Neurons and Astroglia. J Neuroinflamm. 2014;11 doi: 10.1186/s12974-014-0183-6. Article 183. [DOI] [PMC free article] [PubMed] [Google Scholar]
- 11.Huh D, Leslie DC, Matthews BD, Fraser JP, Jurek S, Hamilton GA, Thorneloe KS, Mcalexander MA, Ingber DE. A human disease model of drug toxicity-induced pulmonary edema in a lung- on-a-chip microdevice. Sci Transl Med. 2012;4:159ra147. doi: 10.1126/scitranslmed.3004249. [DOI] [PMC free article] [PubMed] [Google Scholar]
- 12.Stucki AO, Stucki JD, Hall SRR, Felder M, Mermoud Y, Schmid RA, Geiser T, Guenat OT. A lung-on-a-chip array with an integrated bio-inspired respiration mechanism. Lab Chip. 2015;15:1302–1310. doi: 10.1039/c4lc01252f. [DOI] [PubMed] [Google Scholar]
- 13.Kim HJ, Huh D, Hamilton G, Ingber DE. Human gut-on-a-chip inhabited by microbial flora that experiences intestinal peristalsis-like motions and flow. Lab Chip. 2012;12:2165–2174. doi: 10.1039/c2lc40074j. [DOI] [PubMed] [Google Scholar]
- 14.Schroer AK, Shotwell MS, Sidorov VY, Wikswo JP, Merryman WD. I-Wire Heart-on-a-Chip II: Biomechanical analysis of contractile, three-dimensional cardiomyocyte tissue constructs. Acta Biomater. 2016 doi: 10.1016/j.actbio.2016.11.010. (submitted) [DOI] [PMC free article] [PubMed] [Google Scholar]
- 15.Huebsch N, Loskill P, Mandegar MA, Marks NC, Sheehan AS, Ma Z, Mathur A, Nguyen TN, Yoo JC, Judge LM, Spencer CI, Chukka AC, Russell CR, So PL, Conklin BR, Healy KE. Automated Video-Based Analysis of Contractility and Calcium Flux in Human-Induced Pluripotent Stem Cell-Derived Cardiomyocytes Cultured over Different Spatial Scales. Tissue Eng Pt C. 2015;21:467–479. doi: 10.1089/ten.tec.2014.0283. [DOI] [PMC free article] [PubMed] [Google Scholar]
- 16.Mathur A, Loskill P, Shao KF, Huebsch N, Hong S, Marcus SG, Marks N, Mandegar M, Conklin BR, Lee LP, Healy KE. Human iPSC-based Cardiac Microphysiological System For Drug Screening Applications. Sci Rep. 2015;5 doi: 10.1038/srep08883. Article 8883. [DOI] [PMC free article] [PubMed] [Google Scholar]
- 17.Alford PW, Feinberg AW, Sheehy SP, Parker KK. Biohybrid thin films for measuring contractility in engineered cardiovascular muscle. Biomaterials. 2010;31:3613–3621. doi: 10.1016/j.biomaterials.2010.01.079. [DOI] [PMC free article] [PubMed] [Google Scholar]
- 18.Grosberg A, Alford PW, McCain ML, Parker KK. Ensembles of engineered cardiac tissues for physiological and pharmacological study: Heart on a chip. Lab Chip. 2011;11:4165–4173. doi: 10.1039/c1lc20557a. [DOI] [PMC free article] [PubMed] [Google Scholar]
- 19.Agarwal A, Goss JA, Cho A, McCain ML, Parker KK. Microfluidic heart on a chip for higher throughput pharmacological studies. Lab Chip. 2013;13:3599–3608. doi: 10.1039/c3lc50350j. [DOI] [PMC free article] [PubMed] [Google Scholar]
- 20.Feinberg AW, Alford PW, Jin HW, Ripplinger CM, Werdich AA, Sheehy SP, Grosberg A, Parker KK. Controlling the contractile strength of engineered cardiac muscle by hierarchal tissue architecture. Biomaterials. 2012;33:5732–5741. doi: 10.1016/j.biomaterials.2012.04.043. [DOI] [PMC free article] [PubMed] [Google Scholar]
- 21.Boudou T, Legant WR, Mu A, Borochin MA, Thavandiran N, Radisic M, Zandstra PW, Epstein JA, Margulies KB, Chen CS. A Microfabricated Platform to Measure and Manipulate the Mechanics of Engineered Cardiac Microtissues. Tissue Eng Pt A. 2012;18:910–919. doi: 10.1089/ten.tea.2011.0341. [DOI] [PMC free article] [PubMed] [Google Scholar]
- 22.Stoehr A, Neuber C, Baldauf C, Vollert I, Friedrich FW, Flenner F, Carrier L, Eder A, Schaaf S, Hirt MN, Aksehirlioglu B, Tong CW, Moretti A, Eschenhagen T, Hansen A. Automated analysis of contractile force and Ca2+ transients in engineered heart tissue. Am J Physiol Heart. 2014;306:H1353–H1363. doi: 10.1152/ajpheart.00705.2013. [DOI] [PMC free article] [PubMed] [Google Scholar]
- 23.Godier-Furnemont AFG, Tiburcy M, Wagner E, Dewenter M, Lammle S, El-Armouche A, Lehnart SE, Vunjak-Novakovic G, Zimmermann WH. Physiologic force-frequency response in engineered heart muscle by electromechanical stimulation. Biomaterials. 2015;60:82–91. doi: 10.1016/j.biomaterials.2015.03.055. [DOI] [PMC free article] [PubMed] [Google Scholar]
- 24.West AR, Zaman N, Cole DJ, Walker MJ, Legant WR, Boudou T, Chen CS, Favreau JT, Gaudette GR, Cowley EA, Maksym GN. Development and characterization of a 3D multicell microtissue culture model of airway smooth muscle. Am J Physiol Lung. 2013;304:L4–L16. doi: 10.1152/ajplung.00168.2012. [DOI] [PMC free article] [PubMed] [Google Scholar]
- 25.Thavandiran N, Dubois N, Mikryukov A, Masse S, Beca B, Simmons CA, Deshpande VS, McGarry JP, Chen CS, Nanthakumar K, Keller GM, Radisic M, Zandstra PW. Design and formulation of functional pluripotent stem cell-derived cardiac microtissues. PNAS (US) 2013;110:E4698–E4707. doi: 10.1073/pnas.1311120110. [DOI] [PMC free article] [PubMed] [Google Scholar]
- 26.Chen GP, Li S, Karakikes I, Ren LH, Chow MZY, Chopra A, Keung W, Yan B, Chan CWY, Costa KD, Kong CW, Hajjar RJ, Chen CS, Li RA. Phospholamban as a Crucial Determinant of the Inotropic Response of Human Pluripotent Stem Cell-Derived Ventricular Cardiomyocytes and Engineered 3-Dimensional Tissue Constructs. Circ Arrhythm Electrophysiol. 2015;8:193–202. doi: 10.1161/CIRCEP.114.002049. [DOI] [PMC free article] [PubMed] [Google Scholar]
- 27.Sonnenblick EH. Force-Velocity Relations in Mammalian Heart Muscle. Am J Physiol. 1962;202:931–932. doi: 10.1152/ajplegacy.1962.202.5.931. [DOI] [PubMed] [Google Scholar]
- 28.Grood ES, Mates RE, Falsetti H. Model of Cardiac-Muscle Dynamics. Circ Res. 1974;35:184–196. [Google Scholar]
- 29.Iribe G, Helmes M, Kohl P. Force-length relations in isolated intact cardiomyocytes subjected to dynamic changes in mechanical load. Am J Physiol Heart Circ Physiol. 2007;292:H1487–H1497. doi: 10.1152/ajpheart.00909.2006. [DOI] [PubMed] [Google Scholar]
- 30.Nawroth JC, Lee H, Feinberg AW, Ripplinger CM, McCain ML, Grosberg A, Dabiri JO, Parker KK. A tissue-engineered jellyfish with biomimetic propulsion. Nat Biotechnol. 2012;30:792–797. doi: 10.1038/nbt.2269. [DOI] [PMC free article] [PubMed] [Google Scholar]
- 31.Zhong L, Chiusa M, Cadar AG, Lin A, Samaras S, Davidson JM, Lim CC. Targeted inhibition of ANKRD1 disrupts sarcomeric ERK-GATA4 signal transduction and abrogates phenylephrine-induced cardiomyocyte hypertrophy. Cardiovasc Res. 2015;106:261–271. doi: 10.1093/cvr/cvv108. [DOI] [PMC free article] [PubMed] [Google Scholar]
- 32.Zimmermann WH, Fink C, Kralisch D, Remmers U, Weil J, Eschenhagen T. Three-dimensional engineered heart tissue from neonatal rat cardiac myocytes. Biotechnol Bioeng. 2000;68:106–114. [PubMed] [Google Scholar]
- 33.Banerjee I, Fuseler JW, Price RL, Borg TK, Baudino TA. Determination of cell types and numbers during cardiac development in the neonatal and adult rat and mouse. Am J Physiol Heart. 2007;293:H1883–H1891. doi: 10.1152/ajpheart.00514.2007. [DOI] [PubMed] [Google Scholar]
- 34.Hansen A, Eder A, Bonstrup M, Flato M, Mewe M, Schaaf S, Aksehirlioglu B, Schworer A, Uebeler J, Eschenhagen T. Development of a Drug Screening Platform Based on Engineered Heart Tissue. Circ Res. 2010;107:35–44. doi: 10.1161/CIRCRESAHA.109.211458. [DOI] [PubMed] [Google Scholar]
- 35.Sidorov VY, Woods MC, Wikswo JP. Effects of elevated extracellular potassium on the stimulation mechanism of diastolic cardiac tissue. Biophys J. 2003;84:3470–3479. doi: 10.1016/S0006-3495(03)70067-8. [DOI] [PMC free article] [PubMed] [Google Scholar]
- 36.Straight AF, Cheung A, Limouze J, Chen I, Westwood NJ, Sellers JR, Mitchison TJ. Dissecting temporal and spatial control of cytokinesis with a myosin II inhibitor. Science. 2003;299:1743–1747. doi: 10.1126/science.1081412. [DOI] [PubMed] [Google Scholar]
- 37.Kovacs M, Toth J, Hetenyi C, Malnasi-Csizmadia A, Sellers JR. Mechanism of blebbistatin inhibition of myosin II. J Biol Chem. 2004;279:35557–35563. doi: 10.1074/jbc.M405319200. [DOI] [PubMed] [Google Scholar]
- 38.Warren ML. Forces. In: Renz P, editor. Introductory physics. W.H. Freeman; San Francisco: 1979. pp. 77–92. [Google Scholar]
- 39.Katz AM. Physiology of the heart. Lippincott Williams & Wilkins; Philadelphia: 2001. Regulation of myocardial contractility (inotropy) and relaxation (lusitropy) pp. 368–397. [Google Scholar]
- 40.Brodde OE, Michel MC. Adrenergic and Muscarinic Receptors in the Human Heart. Pharmacol Rev. 1999;51:651–690. [PubMed] [Google Scholar]
- 41.Askeland DR, Phule PP. The science and engineering of materials. Thomson; Toronto: 2006. Mechanical properties: Part one; pp. 197–246. [Google Scholar]
- 42.Eschenhagen T, Fink C, Remmers U, Scholz H, Wattchow J, Weil J, Zimmermann W, Dohmen HH, Schafer H, Bishopric N, Wakatsuki T, Elson EL. Three-dimensional reconstitution of embryonic cardiomyocytes in a collagen matrix: a new heart muscle model system. FASEB J. 1997;11:683–694. doi: 10.1096/fasebj.11.8.9240969. [DOI] [PubMed] [Google Scholar]
- 43.Zimmermann WH, Schneiderbanger K, Schubert P, Didie M, Munzel F, Heubach JF, Kostin S, Neuhuber WL, Eschenhagen T. Tissue Engineering of a Differentiated Cardiac Muscle Construct. Circ Res. 2002;90:223–230. doi: 10.1161/hh0202.103644. [DOI] [PubMed] [Google Scholar]
- 44.Asnes CF, Marquez JP, Elson EL, Wakatsuki T. Reconstitution of the Frank-Starling Mechanism in Engineered Heart Tissues. Biophys J. 2006;91:1800–1810. doi: 10.1529/biophysj.105.065961. [DOI] [PMC free article] [PubMed] [Google Scholar]
- 45.de Lange WJ, Hegge LF, Grimes AC, Tong CW, Brost TM, Moss RL, Ralphe JC. Neonatal Mouse-Derived Engineered Cardiac Tissue A Novel Model System for Studying Genetic Heart Disease. Circ Res. 2011;109:8–19. doi: 10.1161/CIRCRESAHA.111.242354. [DOI] [PMC free article] [PubMed] [Google Scholar]
- 46.Sakar MS, Neal D, Boudou T, Borochin MA, Li YQ, Weiss R, Kamm RD, Chen CS, Asada HH. Formation and optogenetic control of engineered 3D skeletal muscle bioactuators. Lab Chip. 2012;12:4976–4985. doi: 10.1039/c2lc40338b. [DOI] [PMC free article] [PubMed] [Google Scholar]
- 47.Golob M, Moss R, Chesler N. Cardiac Tissue Structure, Properties, and Performance: A Materials Science Perspective. Ann Biomed Eng. 2014;42:2003–2013. doi: 10.1007/s10439-014-1071-z. [DOI] [PMC free article] [PubMed] [Google Scholar]
- 48.Katz AM. Physiology of the heart. Lippincott Williams & Wilkins; Philadelphia: 2001. Energy utilization: Work and heat; pp. 101–122. [Google Scholar]
- 49.Sniadecki NJ, Anguelouch A, Yang MT, Lamb CM, Liu Z, Kirschner SB, Liu Y, Reich DH, Chen CS. From the Cover: Magnetic microposts as an approach to apply forces to living cells. PNAS. 2007;104:14553–14558. doi: 10.1073/pnas.0611613104. [DOI] [PMC free article] [PubMed] [Google Scholar]
- 50.Hinds S, Bian WN, Dennis RG, Bursac N. The role of extracellular matrix composition in structure and function of bioengineered skeletal muscle. Biomaterials. 2011;32:3575–3583. doi: 10.1016/j.biomaterials.2011.01.062. [DOI] [PMC free article] [PubMed] [Google Scholar]
- 51.Franz MR. The electrical restitution curve revisited: Steep or flat slope - Which is better? J Cardiovasc Electrophysiol. 2003;14:S140–S147. doi: 10.1046/j.1540.8167.90303.x. [DOI] [PubMed] [Google Scholar]
- 52.Bers DM. Calcium fluxes involved in control of cardiac myocyte contraction. Circ Res. 2000;87:275–281. doi: 10.1161/01.res.87.4.275. [DOI] [PubMed] [Google Scholar]
- 53.Woodworth RS. Maximal Contraction, "Staircase" Contraction, Refractory Period, and Compensatory Pause, of the Heart. Am J Physiol. 1902;8:213–248. [Google Scholar]
- 54.Szigligeti P, Pankucsi C, Banyasz T, Varro A, Nanasi PP. Action potential duration and force frequency relationship in isolated rabbit, guinea pig and rat cardiac muscle. J Comp Physiol B. 1996;166:150–155. doi: 10.1007/BF00301179. [DOI] [PubMed] [Google Scholar]
- 55.Narayan P, Mccune SA, Robitaille PML, Hohl CM, Altschuld RA. Mechanical Alternans and the Force-Frequency-Relationship in Failing Rat Hearts. J Mol Cell Cardiol. 1995;27:523–530. doi: 10.1016/s0022-2828(08)80047-8. [DOI] [PubMed] [Google Scholar]
- 56.Endoh M. Force-frequency relationship in intact mammalian ventricular myocardium: physiological and pathophysiological relevance. Eur J Pharmacol. 2004;500:73–86. doi: 10.1016/j.ejphar.2004.07.013. [DOI] [PubMed] [Google Scholar]
- 57.Redel A, Baumgartner W, Golenhofen K, Drenckhahn D, Golenhofen N. Mechanical activity and force-frequency relationship of isolated mouse papillary muscle: effects of extracellular calcium concentration, temperature and contraction type. Pflug Arch Eur J Phy. 2002;445:297–304. doi: 10.1007/s00424-002-0931-9. [DOI] [PubMed] [Google Scholar]
- 58.Bers DM. Excitation-contraction coupling and cardiac contractile force. Kluwer Academic Publishers; Norwell: 2001. Control of cardiac contraction by SR and sarcolemmal Ca fluxes; pp. 245–272. [Google Scholar]
- 59.Ponten A, Li XR, Thoren P, Aase K, Sjoblom T, Ostman A, Eriksson U. Transgenic overexpression of platelet-derived growth factor-C in the mouse heart induces cardiac fibrosis, hypertrophy, and dilated cardiomyopathy. Am J Pathol. 2003;163:673–682. doi: 10.1016/S0002-9440(10)63694-2. [DOI] [PMC free article] [PubMed] [Google Scholar]
- 60.Nagueh SF, Shah G, Wu YM, Torre-Amione G, King NMP, Lahmers S, Witt CC, Becker K, Labeit S, Granzier HL. Altered titin expression, myocardial stiffness, and left ventricular function in patients with dilated cardiomyopathy. Circulation. 2004;110:155–162. doi: 10.1161/01.CIR.0000135591.37759.AF. [DOI] [PubMed] [Google Scholar]
- 61.Berry MF, Engler AJ, Woo YJ, Pirolli TJ, Bish LT, Jayasankar V, Morine KJ, Gardner TJ, Discher DE, Sweeney HL. Mesenchymal stem cell injection after myocardial infarction improves myocardial compliance. Am J Physiol Heart. 2006;290:H2196–H2203. doi: 10.1152/ajpheart.01017.2005. [DOI] [PubMed] [Google Scholar]
- 62.Jacot JG, McCulloch AD, Omens JH. Substrate stiffness affects the functional maturation of neonatal rat ventricular myocytes. Biophys J. 2008;95:3479–3487. doi: 10.1529/biophysj.107.124545. [DOI] [PMC free article] [PubMed] [Google Scholar]
- 63.Engler AJ, Carag-Krieger C, Johnson CP, Raab M, Tang HY, Speicher DW, Sanger JW, Sanger JM, Discher DE. Embryonic cardiomyocytes beat best on a matrix with heart-like elasticity: scar-like rigidity inhibits beating. J Cell Sci. 2008;121:3794–3802. doi: 10.1242/jcs.029678. [DOI] [PMC free article] [PubMed] [Google Scholar]
- 64.Bajaj P, Tang X, Saif TA, Bashir R. Stiffness of the substrate influences the phenotype of embryonic chicken cardiac myocytes. J Biomed Mater Res A. 2010;95A:1261–1269. doi: 10.1002/jbm.a.32951. [DOI] [PubMed] [Google Scholar]
- 65.Bhana B, Iyer RK, Chen WLK, Zhao R, Sider KL, Likhitpanichkul M, Simmons CA, Radisic M. Influence of Substrate Stiffness on the Phenotype of Heart Cells. Biotechnol Bioeng. 2010;105:1148–1160. doi: 10.1002/bit.22647. [DOI] [PubMed] [Google Scholar]
- 66.Allingham JS, Smith R, Rayment I. The structural basis of blebbistatin inhibition and specificity for myosin II. Nat Struct Mol Biol. 2005;12:378–379. doi: 10.1038/nsmb908. [DOI] [PubMed] [Google Scholar]
- 67.King NMP, Methawasin M, Nedrud J, Harrell N, Chung CS, Helmes M, Granzier H. Mouse intact cardiac myocyte mechanics: cross-bridge and titin-based stress in unactivated cells. J Gen Physiol. 2011;137:81–91. doi: 10.1085/jgp.201010499. [DOI] [PMC free article] [PubMed] [Google Scholar]
- 68.Bers DM. Cardiac excitation-contraction coupling. Nature. 2002;415:198–205. doi: 10.1038/415198a. [DOI] [PubMed] [Google Scholar]
- 69.Sidorov VY, Holcomb MR, Woods MC, Gray RA, Wikswo JP. Effects of unipolar stimulation on voltage and calcium distributions in the isolated rabbit heart. Basic Res Cardiol. 2008;103:537–551. doi: 10.1007/s00395-008-0740-1. [DOI] [PMC free article] [PubMed] [Google Scholar]
- 70.Eklund SE, Thompson RG, Snider RM, Carney CK, Wright DW, Wikswo J, Cliffel DE. Metabolic discrimination of select list agents by monitoring cellular responses in a multianalyte microphysiometer. Sensors. 2009;9:2117–2133. doi: 10.3390/s90302117. [DOI] [PMC free article] [PubMed] [Google Scholar]
- 71.Enders JR, Marasco CC, Kole A, Nguyen B, Sundarapandian S, Seale KT, Wikswo JP, McLean JA. Towards monitoring real-time cellular response using an integrated microfluidics-MALDI/NESI-ion mobility-mass spectrometry platform. IET Syst Biol. 2010;4:416–427. doi: 10.1049/iet-syb.2010.0012. [DOI] [PMC free article] [PubMed] [Google Scholar]
Associated Data
This section collects any data citations, data availability statements, or supplementary materials included in this article.