

Summary
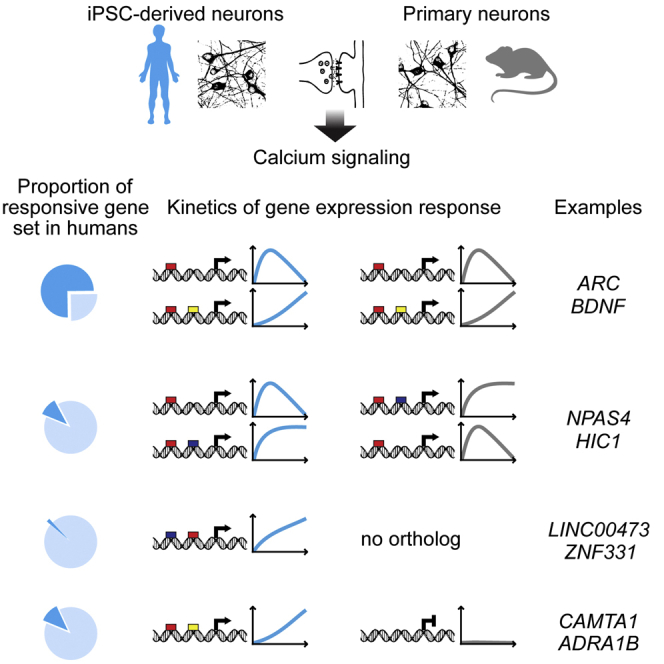
Long-term adaptive responses in the brain, such as learning and memory, require synaptic activity-regulated gene expression, which has been thoroughly investigated in rodents. Using human iPSC-derived neuronal networks, we show that the human and the mouse synaptic activity-induced transcriptional programs share many genes and both require Ca2+-regulated synapse-to-nucleus signaling. Species-specific differences include the noncoding RNA genes BRE-AS1 and LINC00473 and the protein-coding gene ZNF331, which are absent in the mouse genome, as well as several human genes whose orthologs are either not induced by activity or are induced with different kinetics in mice. These results indicate that lineage-specific gain of genes and DNA regulatory elements affects the synaptic activity-regulated gene program, providing a mechanism driving the evolution of human cognitive abilities.
Keywords: human neurons, neuronal networks, NMDA receptor, calcium signaling, transcription, genome-wide, species specificity, human adaptogenomics, HIC1
Graphical Abstract
Highlights
-
•
The repertoire of human activity-induced genes is expanded lineage specifically
-
•
Temporal expression profiles of many activity-responsive genes are species specific
-
•
Some human orthologs of mouse genes have gained inducibility by synaptic activity
-
•
The human HIC1 gene promoter has gained an activity-responsive regulatory element
Using comparative analysis of synaptic activity-responsive gene expression programs in human and mouse neuronal networks, Pruunsild et al. uncover differences that are due to lineage-specific acquisition of genes and DNA regulatory elements. Such genetic alterations and the resulting changes in activity-driven transcription may be relevant for the evolution of human cognitive abilities.
Introduction
Transcription-dependent neuronal plasticity is evolutionarily conserved from invertebrates to mammals (Frank and Greenberg, 1994). Accordingly, the neuronal activity-dependent gene expression program, which underlies adaptation-related brain functions, is likely generic, meaning that many of the activity-responsive genes are shared between species and neuron types (discussed by Bading, 2013). This assumption includes humans. Yet, these genes are poorly characterized in humans, especially in comparison to mice whose activity-regulated transcriptome, implicating ∼1,000 genes, is known (Kim et al., 2010, Saha et al., 2011, Spiegel et al., 2014, Zhang et al., 2007, Zhang et al., 2009). It is important as well as exciting to fill this gap in knowledge, since, as for phenotypic differences between species in general (Necsulea and Kaessmann, 2014, Wilson and Odom, 2009), evolutionary gene regulation and expression changes may, to a large extent, determine the dissimilarities in brain development and function of humans compared to other species (Bae et al., 2015, Geschwind and Rakic, 2013, Silbereis et al., 2016). Cognitive abilities, which in humans have evolved to a perplexing species-specific phenotype distinction, are in part reliant on synaptic activity-dependent gene regulation (Bading, 2013, West and Greenberg, 2011). In humans, the orthologs of rodent activity-regulated genes are expressed with a species-specific temporal profile during brain development (Liu et al., 2012). Whether the human synaptic activity-regulated gene program itself has distinctive features is unknown, however, mostly because obtaining human neurons for experimental use is ethically problematic. Here we determine the gene expression response to synaptic activity in human neurons derived from induced pluripotent stem cells (iPSCs) to find out if the human genetic background expands the repertoire of known activity-regulated genes.
Results
Studies of the human neuronal adaptive gene program require an experimental system where human neurons are synaptically connected. We differentiated iPSCs (see the Experimental Procedures) to human iPSC-derived (hiPSCd) neurons, and we confirmed the generation of postmitotic neuronal cells by expression analysis of multiple markers, RNA sequencing (RNA-seq), and comparison of the hiPSCd neuron transcriptomes to previously published hiPSCd neuron and human fetal brain gene expression profiles (Figure S1; Table S1).
Electrical Properties and Synaptic Connectivity of Human iPSC-Derived Neurons
To directly assess cellular phenotype on a functional level, we performed whole-cell patch-clamp recordings from hiPSCd neurons differentiated for 7 or 10 weeks from hiPSCd neuronal precursor cells (NPCs) (hereafter 7- or 10-week hiPSCd neurons). At earlier time points, hiPSCd neurons were electrophysiologically immature. In parallel, we recorded from 7-week hiPSCd neurons cultured together with mouse (post-natal day [P]0) primary hippocampal neurons for the last 10 days (hereafter hiPSCd neuron/mouse primary neuron co-culture or mixed-species culture). The hiPSCd neurons in the co-cultures were distinguished by their expression of EGFP under the control of the human synapsin I (SYN1) promoter (pSYN1) delivered by lentiviral infection of NPCs (see also Figures S1C, S1D, and 3G). Passive properties (membrane capacitance [34–38 pF], resistance [900–1,350 MΩ], and resting membrane potential [Vrest, −43 to −48 mV]) of hiPSCd neurons were not affected by co-culture with mouse neurons (in figures denoted by Hs + Mm, hiPSCd neuron-only culture is denoted by Hs), and they were not significantly different between cells in the 7- and 10-week hiPSCd neuron-only cultures (Figures 1A–1C). The hiPSCd neurons were electrically excitable, fulfilling a key criterion for functional neurons. Action potential (AP) amplitudes and numbers were improved when evoked from −70 mV instead of Vrest (Figures 1D–1F), which reflects their relatively depolarized state.
Figure 3.

Excitatory Synaptic Input to hiPSCd Neurons Upregulates Human Immediate-Early Genes
(A–F) RT-qPCR analysis of human NPAS4, FOS, and ARC mRNA levels after treatment of hiPSCd neuron/mouse primary hippocampal neuron co-cultures (A, C, and E) or hiPSCd neuron-only cultures (B, D, and F) with bicuculline and 4-aminopyridine (Bic/4AP, 50 μM/250 μM).
(A and B) Impact of duration of hiPSCd neuron differentiation on IE gene induction is shown.
(C and D) Temporal profiles of IE gene mRNA levels in response to Bic/4AP treatment are shown. 7-week (C) or 10-week (D) cultures.
(E and F) Effects of blocking action potentials (TTX, tetrodotoxin; 1 μM), VGCCs (Nif, Nifedipine; 10 μM), or NMDA receptors (APV/MK, 2-amino-5-phosphonovalerate, 50 μM and MK801, 10 μM), or both VGCCs and NMDA receptors (Nif/APV/MK), on the induction of IE genes in response to Bic/4AP treatment. 7-week (E) or 10-week (F) cultures. Results with the 7-week hiPSCd neuron cultures without mouse neurons are also shown (E, − Mm cells).
(G) Immunofluorescence staining of the 7-week co-culture for JUNB expression before (CNTR) or after treatment with Bic/4AP for 2 hr (2h Bic/4AP). EGFP expression (direct fluorescence) under the control of the human SYN1 promoter (EGFP[pSYN1], lentiviral infection of NPCs) identifies human neurons. DNA, Hoechst stain. Red + or − indicates a JUNB+ or JUNB− hiPSCd neuron, respectively. Red asterisks mark presumable mouse neurons with distinctive Hoechst staining. Confocal images scale bar, 10 μm.
n = 3–8 (A and G), n = 3–4 (C and E), or n = 3 (B, D, and F); mean ± SEM; (A, B, E, and F) one-way ANOVA and Tukey’s test; (C, D, and G) two-tailed Welch’s t tests; ∗p < 0.05, ∗∗p < 0.01, and ∗∗∗p < 0.001. If not specified with lines, the asterisks indicate significance compared to control. See also Figures S2B and S2C.
Figure 1.

Electrophysiological and Pharmacological Properties of Human iPSCd Neurons
All culture conditions and cell groups analyzed are specified at the end of the figure legend.
(A–C) The (A) cell capacitance (Cm), (B) membrane resistance (Rm), and (C) resting membrane potential (Vrest) were measured with whole-cell patch clamp. Mean ± SEM.
(D) Action potentials (APs) in representative human cells (cell 1 and cell 2). APs were evoked from Vrest or −70 mV with current injection (bar) at the levels indicated.
(E and F) Quantification of AP amplitude evoked from (E) Vrest or (F) −70 mV is shown. Mean ± SEM.
(G) Traces of spontaneous postsynaptic currents (PSCs) at Vhold = −70 mV, in a representative human cell in control conditions, in the presence of NBQX (5 μM) and/or bicuculline (Bic, 50 μM), are shown.
(H and I) Quantification of the decay τ from a single exponential fit for (H) NBQX-sensitive PSCs with rapid decay kinetics and (I) Bic-sensitive PSCs with slow decay kinetics is shown. Mean ± SEM.
(J and K) Traces of Rhod2 Ca2+ imaging. Responses to (J) NMDA (100 μM) and glycine (Gly, 20 μM), (J) AMPA (10 μM) and cyclothiazide (Cyclo, 20 μM), (K) GABA (300 μM), and (K) a high-concentration K+ solution (HiK+, 45 mM) are shown. Gray lines represent individual cells and black lines are the averages (n = 25–295).
No significant differences were detected in (A)–(C), (E), (F), (H), and (I) (three-way ANOVA).
7w or 10w, human NPCs were differentiated for 7 or 10 weeks, respectively; Hs + Mm, hiPSCd neuron/mouse primary hippocampal neuron co-culture; Hs, hiPSCd neuron-only culture; − and EGFP−, mouse cells or human cells that have either not activated pSYN1 after infection with a lentivirus encoding EGFP under the control of pSYN1 or were not infected; + and EGFP+, EGFP-positive human cells that have activated pSYN1; nv (no virus), no infection was performed. Cells analyzed (A–C, E, and F) or the number of cells showing PSCs from tested cells (H and I) are indicated above bars.
Almost all hiPSCd neurons in all cultures analyzed showed spontaneous postsynaptic currents that could be divided into two groups, with rapid or slow decay time constants (Figures 1G–1I). They were blocked in EGFP-expressing (EGFP+) cells by either NBQX (5 μM), a blocker of AMPA/kainate-type glutamate receptors (7-week hiPSCd neuron-only cultures or mixed-species cultures, n = 4/4 for each), or by the GABA type A (GABAA) receptor antagonists bicuculline (Bic, 50 μM) or gabazine (5 μM) (7-week hiPSCd neuron-only cultures, n = 7/7; mixed-species cultures, n = 5/5), respectively. This confirms the presence of functional synapses containing postsynaptic AMPA/kainate or GABAA receptors in our hiPSCd neurons.
To verify the existence of functional NMDA, AMPA, and GABAA receptors as well as voltage-gated Ca2+ channels (VGCCs) in hiPSCd neurons, we used Ca2+ imaging. In almost all EGFP+ and EGFP-non-expressing (EGFP−) cells in the 7-week hiPSCd neuron-only cultures, large Ca2+ responses were evoked by NMDA, applied with its co-agonist glycine, or by AMPA, applied with an inhibitor of AMPA receptor desensitization, cyclothiazide (Figure 1J). GABA also increased Ca2+ levels (Figure 1K), indicating an excitatory, depolarizing effect. Ca2+ influx in response to AMPA, NMDA, and GABA presumably involves VGCCs, and their presence in hiPSCd neurons was confirmed by robust increases in Ca2+ in response to depolarization with a high-concentration K+ solution (Figure 1K). Thus, 7 weeks of differentiation of human iPSC-derived NPCs is sufficient to obtain hiPSCd neurons that exhibit functional AMPA, NMDA, and GABAA receptors as well as VGCCs.
Bicuculline Together with 4-Aminopyridine Increases Synaptic Input to Human iPSC-Derived Neurons
Having established culture systems generating synaptically connected hiPSCd neurons, we sought a method to experimentally induce robust excitatory synaptic activity in these cultures to study activity-induced transcription in hiPSCd neurons. In 10-day cultures of mouse primary hippocampal neurons, synaptic activity-dependent gene expression can be induced by disinhibition of the neuronal network with Bic, which triggers synchronous bursts of AP firing along with AMPA and NMDA receptor- and VGCC-mediated Ca2+ signals, whose frequency is increased by coapplication of Bic with the K+ channel blocker 4-aminopyridine (4AP) (Arnold et al., 2005, Hardingham et al., 2001). Bic (50 μM) applied together with 4AP (250 μM) (Bic/4AP) activated large recurring bursts of synaptic activity in both EGFP+ and EGFP− cells in our 7-week mixed-species cultures (Figures 2A and 2B) and, to a lesser extent, in 7-week hiPSCd neuron-only cultures (Figure 2C). EGFP+ cells in 7-week hiPSCd neuron-only cultures and mixed-species cultures showed, respectively, a 4.4-fold and a 10.8-fold increase in synaptic charge influx after Bic/4AP treatment (Figure 2E). In the 10-week hiPSCd neuron cultures, Bic/4AP induced larger synaptic bursts than in the 7-week hiPSCd neuron-only cultures (Figures 2C and 2D), and it caused recurring membrane potential oscillations (18.9 ± 1.9 mV; 1.73 ± 0.44/min; n = 8), which were abolished by NBQX (n = 3; data not shown). Synaptic activation caused by Bic/4AP was accompanied by recurrent depolarizations and/or APs in all cultures assessed.
Figure 2.

Induction of Synaptic Activity and Somatic Ca2+ Signals in hiPSCd Neurons
All culture conditions and cell groups analyzed are specified at the end of the figure legend.
(A–D) Traces of responses to bicuculline and 4-aminopyridine (Bic/4AP, 50 μM and 250 μM, respectively) at Vhold = −70 mV are shown in an EGFP positive (A) and an EGFP negative (B) cell of a 7-week mixed-species culture, and in an EGFP positive cell of a 7-week hiPSCd neuron-only culture (C) and in a cell of a 10-week hiPSCd neuron-only culture not exposed to virus (D).
(E) Area under the curve (AUC) from integrals of currents measured in human cells over equal time periods before (baseline) and after the application of Bic/4AP. Line series plots connect the values from each cell measured, and the bar graph shows the increase in excitatory postsynaptic current (EPSC) burst AUC (mean ± SEM). Cell numbers are specified above bars. Two-tailed Student’s t test, ∗p < 0.05.
(F–H) Traces of Rhod2 Ca2+ imaging with responses to Bic/4AP in EGFP positive and negative cells of a 7-week mixed-species culture (F) and a hiPSCd neuron-only culture (G), and in cells of a 10-week hiPSCd neuron-only culture not exposed to virus (H). Gray lines represent individual cells and black lines are the averages.
(I) Bic/4AP-induced Ca2+ response amplitudes (peak minus baseline, mean ± SEM). Cell numbers are specified above bars. Two-way ANOVA on ranks and Holm-Sidak test, ∗p < 0.05.
Hs + Mm, mixed-species culture; Hs, hiPSCd neuron-only culture; 7w or 10w, human NPCs were differentiated for 7 or 10 weeks, respectively. Human cells were infected with a lentivirus encoding EGFP under the control of pSYN1 or not infected (no virus, nv). + and EGFP+ or − and EGFP− denote cells that express or do not express lentivirus-encoded EGFP, respectively.
Analyses of Ca2+ transients activated downstream of Bic/4AP-induced synaptic activity revealed large, recurrent increases in Ca2+ levels with a sustained increase in baseline Ca2+ levels in both EGFP+ and EGFP− cells in the 7-week co-cultures (Figure 2F), similar to responses seen in mouse primary hippocampal neurons (Hardingham et al., 2001). Recurrent Ca2+ responses to Bic/4AP also were apparent in 7- and 10-week hiPSCd neuron-only cultures but without a sustained increase in baseline Ca2+ levels and with a smaller amplitude in the 7-week than in the 10-week cultures (Figures 2G–2I). The depolarizing effect of GABA (see above) and the lack of response to Bic (Figure S2A) in 7-week hiPSCd neuron-only cultures may explain their weaker responses to Bic/4AP compared to 10-week hiPSCd neurons, where GABAA receptors likely have undergone the developmental switch from excitatory to inhibitory (Ben-Ari et al., 2007).
These results demonstrate that Bic/4AP induces robust recurrent increases in AMPA/kainate receptor-mediated synaptic and AP activity along with Ca2+ influx into hiPSCd neurons in the mixed-species or hiPSCd neuron-only cultures. The addition of mouse primary neurons to the 7-week hiPSCd neuron cultures or the extra 3 weeks of differentiation of hiPSCd neuron-only cultures greatly increase hiPSCd neuron responses to Bic/4AP.
Excitatory Input to Human iPSC-Derived Neurons Induces Human Immediate-Early Genes
We used species-specific RT-qPCR on human orthologs of three prototypical activity-responsive mouse immediate-early (IE) genes, Npas4, Fos, and Arc, to assess if enhancement of synaptic input to hiPSCd neurons induces human IE genes. Increases in human NPAS4, FOS, and ARC mRNA levels in hiPSCd neurons after a 1-hr Bic/4AP treatment were easily detectable in both hiPSCd neurons cultured with or without mouse primary neurons (Figures 3A and 3B). Induction strength of NPAS4 and ARC improved gradually over the NPC differentiation period. All the inductions peaked 1 hr after Bic/4AP addition and dropped almost to the basal levels by 4 hr (Figures 3C and 3D).
In the 7-week co-cultures, the increases in the levels of all of the three assessed human IE gene mRNAs in response to Bic/4AP were abolished in the presence of tetrodotoxin (TTX, 1 μM), an Na+ channel blocker that prevents Bic/4AP-induced Ca2+ signals by inhibiting AP firing (Hardingham et al., 2002), proving that expression of NPAS4, FOS, and ARC is activity-regulated in hiPSCd neurons (Figure 3E). The Bic/4AP-induced increase in NPAS4 mRNA levels was reduced by the inhibition of L-type VGCCs with Nifedipine (Nif, 10 μM) or by two NMDA receptor antagonists, 2-amino-5-phosphonovalerate (APV, 50 μM) and MK801 (MK, 10 μM) (APV/MK). Induction of NPAS4 and FOS was more strongly inhibited by the combination of Nif, APV, and MK (Nif/APV/MK), revealing a potential synergistic role of VGCCs and NMDA receptors (Figure 3E). In the 10-week hiPSCd neuron-only cultures, the induction of NPAS4 and FOS was severely reduced in the presence of TTX, Nif, APV/MK, or Nif/APV/MK, although the effect of Nif on FOS was comparatively weaker (Figure 3F). ARC induction was reduced by blocking VGCCs and/or NMDA receptors in both cultures (Figures 3E and 3F). Finally, co-culture experiments with hiPSCd neurons produced from a distinct iPSC line (hiPS 3, see the Experimental Procedures) produced nearly identical results (Figures S2B and S2C).
To determine the proportion of hiPSCd neurons responding to Bic/4AP treatment with IE gene induction and to confirm the response at the protein level, we used immunostaining for yet another classical IE gene product, JUNB. Approximately 65% of hiPSCd neurons in the co-culture showed JUNB protein expression after 2 hr of enhanced excitatory synaptic input (Figure 3G).
These results demonstrate that strong induction of excitatory synaptic activity-dependent IE gene expression in human cells can be evoked by a simple Bic/4AP treatment of hiPSCd cultures. Also, they show that NMDA receptors and VGCCs are involved in triggering synaptic activity-induced increases in IE gene mRNA levels in hiPSCd neurons.
Early Gene Expression Response to Synaptic Activity Is Generic but Has Lineage-Specific Features
We performed RNA-seq to examine the synaptic activity-regulated gene program in hiPSCd neurons. RNA levels of 50 or 42 human genes were significantly changed (Benjamini-Hochberg adjusted p [padj] < 0.1) in hiPSCd neurons 1 hr after Bic/4AP addition to the 7-week mixed-species cultures (Figure 4A; Table S2) or to the 10-week hiPSCd neuron cultures (Table S2), respectively. RNA levels of 37 human genes were significantly changed in both culture systems (Figure 4B). The expression fold change values of all of the obtained 55 genes between the two cultures were nearly equivalent (Pearson’s r [r] = 0.96; Figure 4C), supporting the validity of the mixed-species RNA-seq analysis (see the Supplemental Experimental Procedures). We assigned a human gene to be a putative IE gene (hereafter IE gene) if the significant expression level change (padj < 0.1) in one dataset was supported by a change with an unadjusted p less than 0.01 in the other or if the change was more than 2-fold with the padj less than 0.05 in at least one of the datasets. Altogether we identified 47 human synaptic activity-regulated IE genes, all with upregulated RNA levels (Table S3). RNA-seq results with the mixed-species samples were validated for hiPSCd neurons derived from two different iPSC lines with the nCounter method using species-specific probes (Figures S2D and S3–S5).
Figure 4.

Generic Early Response to Synaptic Activity with Species-Specific Features in hiPSCd Neurons
(A) Gene expression log ratio versus expression level average (MA) plot of gene expression changes detected with RNA-Seq in hiPSCd neurons 1 hr after Bic/4AP addition to the 7-week mixed-species cultures. Dots representing genes with significantly changed RNA levels (padj < 0.1) are red. n = 4.
(B) Venn diagram displays human genes with significantly changed RNA levels after 1-hr Bic/4AP treatment of 7-week mixed-species cultures (Hs[+Mm]) and 10-week hiPSCd neuron cultures (Hs).
(C) Correlation of expression log2 fold change (FC[log2]) values of all of the 55 human genes shown in (B) in the Hs(+Mm) culture with the respective values obtained from the Hs culture. Dots represent mean values of four biological replicate experiments. Pearson’s r, p < 0.0001.
(D) Distribution of activity-regulated human IE genes according to the information on their mouse orthologs. Mm here and other studies, genes whose mouse orthologs’ RNA levels are changed in this and other studies; Mm here, genes whose mouse orthologs’ mRNA levels are changed only in this study; and not in Mm, no evidence for neuronal activity-dependent regulation of the mouse ortholog (SOCS3) or no ortholog in mouse. The most enriched GO terms within the human IE genes are shown.
(E) Correlation of expression FC(log2) values of 47 human IE genes in the mixed-species culture after 1 hr of Bic/4AP treatment with the FC(log2) values of their mouse orthologs in the same culture. Dots represent the mean values of four biological replicate experiments. Pearson’s r, p < 0.0001.
(F) Distribution of human IE genes and their mouse orthologs based on induction strength in hiPSCd neurons and mouse neurons, respectively, in the co-culture is shown.
(G) Venn diagrams display strongly, averagely, or weakly induced human (Hs) IE genes and their mouse (Mm) orthologs after 1 hr of Bic/4AP treatment of the mixed-species culture.
(H) Hierarchical clustering of human (Hs) IE genes and their mouse (Mm) orthologs according to temporal expression profiles after the induction of synaptic activity in the co-culture. Blue and yellow rectangles denote human and mouse genes, respectively. Expression profiles in three clusters evident at dendrogram height 3 are depicted below the dendrogram. Gray lines show single genes and black lines are the averages.
(I) Venn diagrams display transient, sustained, and amplified human (Hs) IE genes and their mouse (Mm) orthologs.
See also Figures S3–S5.
We categorized the 47 human IE genes according to the data available for their rodent orthologs (Figure 4D). The rodent orthologs of 41 of the human IE genes (87.2%) were significantly upregulated after Bic/4AP treatment in mouse primary neurons according to our RNA-seq and nCounter analysis, and they have been reported to be neuronal activity regulated in other studies using different experimental systems and time points (Kim et al., 2010, Maze et al., 2015, Rossner et al., 1997, Saha et al., 2011, Spiegel et al., 2014, Zhang et al., 2007, Zhang et al., 2009). The orthologs of three human IE genes (C11orf96, MIR22HG, and SOCS3) have not been previously identified as activity-regulated genes in rodents, although SOCS3 was only regulated in one of the two iPSC lines used here. Three of the human IE genes, BRE-AS1, LINC00473, and ZNF331, are exceptional because they do not have rodent orthologs. BRE-AS1 and LINC00473 RNA levels were detected to be strongly (≥15-fold) and ZNF331 RNA levels weakly (1.5-fold) upregulated in hiPSCd neurons with RNA-seq after 1 hr of Bic/4AP treatment, and all three genes were confirmed to be activity induced with nCounter analysis in hiPSCd neurons derived from both of the iPSC lines used here (Figures S3 and S5). Also, their synaptic activity-induced expression was blocked or severely reduced in the presence of TTX or Nif/APV/MK (Figure S2D). BRE-AS1 is a noncoding RNA gene antisense to the BRE (brain and reproductive organ-expressed) gene. LINC00473 is a primate-specific long noncoding RNA gene that has been documented to be duplicated along with only three other genes in a patient with delayed speech and language development (DECIPHER 277616; Firth et al., 2009). ZNF331 encodes a Krüppel-associated box domain-containing transcriptional repressor.
The most significantly over-represented gene ontology (GO) terms among the human synaptic activity-regulated IE genes were all associated with transcription factor activity (Figure 4D; Table S4; 24 genes, 51.1%, encode transcription factors). Also, cAMP response elements (CREs) or CRE half site (CREhs)-containing sequences and serum response elements (SREs) were significantly enriched in the proximal promoter regions of human IE genes (Table S4), suggesting that many of them are targets of the well-established neuronal activity-dependent transcriptional regulators, CRE-binding protein (CREB) and SRE-interacting proteins (Bading et al., 1993).
Next, we compared the synaptic activity-regulated human IE genes to their mouse orthologs using the data from the co-cultures where RNA of the two species is collected from cells stimulated in identical culture conditions. Rapid human RNA level changes after enhancement of glutamatergic synaptic activity were paralleled by similar changes of the respective mouse orthologs (Figure 4E; expression change correlation, r = 0.73). Based on induction strength, half of the IE gene ortholog pairs grouped together (Figures 4F and 4G). For example, EGR4/Egr4, FOS/Fos, FOSB/Fosb, JUNB/Junb, NPAS4/Npas4, and NR4A1/Nr4a1 were strongly induced in human cells as well as in mouse cells. To classify genes in terms of temporal expression profile regardless of induction strength, we performed hierarchical clustering of human IE genes together with their mouse orthologs, if present, based on RNA levels scaled between 0 and 1 from untreated and 1- or 4-hr Bic/4AP-treated mixed-species cultures (Figure 4H). Relative to their upregulated expression levels at the 1-hr time point, IE gene RNA levels at the 4-hr time point were either decreased (termed here transient), unchanged (termed sustained), or further increased (termed amplified). This analysis revealed that half of the examined mouse genes, but only 17% of the human IE genes, belonged to the amplified cluster. Instead, 55.3% of the human IE genes grouped into the transient set of genes and 27.7% had the sustained RNA expression profile. Examples of transient human IE genes with amplified or sustained mouse orthologs include GADD45B/Gadd45b and NR4A2/Nr4a2 or FOSB/Fosb and NPAS4/Npas4, respectively. Human HIC1, encoding hypermethylated in cancer 1, grouped to the sustained cluster and mouse Hic1 grouped to the transient cluster. HIC1/Hic1 is the only relatively strongly induced IE gene in both cell types (human, 5.9-fold; mouse, 4.5-fold) that had a more sustained increase in expression levels in hiPSCd neurons compared to mouse neurons (Figure 4I). These results establish that overall the hiPSCd neuron synaptic activity-responsive IE gene program is generic. However, it involves genes that do not have orthologs in the mouse, and many of the human IE genes are in hiPSCd neurons upregulated more transiently than their mouse orthologs in mouse primary hippocampal neurons.
Conserved Ca2+-Signaling Pathway Regulates BRE-AS1, LINC00473, and ZNF331 Promoters
We next asked if the three synaptic activity-regulated human IE genes that do not have mouse orthologs (see Figure 5A for nCounter confirmation of RNA-seq results) represent loci regulated by neuronal activity via conserved mechanisms or are induced by cell-type or species-specific mechanisms. To answer this, we conducted luciferase reporter assays for the regulation of BRE-AS1, LINC00473, and ZNF331 promoters in mouse primary hippocampal and cortical neurons. The promoters of these genes contain CRE and CREhs cis elements (Figure 5B) that may direct the induction of promoter activity upon excitatory synaptic signaling, and, moreover, the LINC00473 promoter (pLINC00473) contains a bHLH-PAS transcription factor response element (PasRE; Figure 5B) that could permit the enhancement of transcriptional activity after the immediate response. The assays showed increases in normalized luciferase levels 6 hr after Bic/4AP addition with the BRE-AS1 promoter (pBRE-AS1) and pLINC00473 and two of the cloned ZNF331 promoter-containing regions (pZNF331 II and III, covering three and two 5′ exons, respectively; Figures 5B and S6A). These results reveal that BRE-AS1, LINC00473, and ZNF331 are under the control of promoters that are responsive to synaptic activity in mouse neurons. This demonstrates that they are targets of evolutionarily conserved synapse-to-nucleus signaling mechanisms, most probably involving nuclear Ca2+/calmodulin kinases (Bading, 2013).
Figure 5.

BRE-AS1, LINC00473, and ZNF331 Regulation by Conserved Ca2+-Signaling Pathway
(A) Results of nCounter analyses of BRE-AS1, LINC00473, and ZNF331 expression in response to Bic/4AP treatment of 7-week mixed-species cultures are shown.
(B and C) Luciferase reporter assays with the firefly luciferase (FFluc) under the control of the indicated promoter or without a promoter (pCNTR) in mouse primary hippocampal neurons.
(B) Change in FFluc activity in response to Bic/4AP treatment. See also Figure S6A.
(C) Relative light units (RLUs) measured from untreated cells (CNTR) or cells treated 6 hr with Bic/4AP (6h Bic/4AP). The protein encoded by the co-transfected plasmid is shown on the left.
Arrows denote transcription start sites (TSSs). Numbers specify base pairs upstream (−) or downstream (+) of the most 5′ or 3′ TSS, respectively. Red or green dots represent CRE and CREhs or PasRE cis elements, respectively.
n = 3 (A–C); (A) independent measurements and mean; (B and C) mean ± SEM; (A and B) one-way ANOVA and Dunnett’s test; (C) two-way ANOVA and Tukey’s test; ∗p < 0.05, ∗∗p < 0.01, and ∗∗∗p < 0.001. If not specified with lines, the asterisks indicate significance compared to untreated control (A), to pCNTR (B), or to cells expressing mCherry in the same treatment group (CNTR or 6h Bic/4AP) (C).
To investigate if synaptic activity-dependent regulation of pBRE-AS1, pLINC00473, and pZNF331 III is sensitive to nuclear Ca2+/calmodulin inhibition and interference with CRE-dependent or PasRE-mediated transcription, we used co-transfection of constructs encoding for one of the following proteins: (1) CaMBP4, a nuclear-localized inhibitor of Ca2+/calmodulin signaling (Wang et al., 1995, Zhang et al., 2007); (2) ICER1 (ICER), an inhibitor of CREB family proteins (De Cesare and Sassone-Corsi, 2000); or (3) NPAS4 without the transcription activation domain (delTAD-NPAS4), a dominant-negative regulator of bHLH-PAS transcription factors (Pruunsild et al., 2011). We found that luciferase expression under the control of pBRE-AS1, pLINC00473, and pZNF331 III after 6 hr of Bic/4AP treatment was significantly reduced by CaMBP4 (Figure 5C). Overexpression of ICER led to diminished Bic/4AP-induced luciferase levels with pBRE-AS1 and pLINC00473, but not with pZNF331 III. The dominant-negative bHLH-PAS factor delTAD-NPAS4 considerably lowered Bic/4AP-induced transcription only from pLINC00473 (Figure 5C). Additionally, pZNF331 III activity was significantly reduced by CaMBP4 in unstimulated conditions, indicating that basal nuclear Ca2+/calmodulin activity regulates transcription from this promoter. Collectively, these results prove that the promoters of human BRE-AS1, LINC00473, and the most 3′ promoter-containing region of ZNF331 are regulated by the conserved Ca2+-signaling pathway that activates nuclear Ca2+/calmodulin kinases in neurons. pBRE-AS1 and pLINC00473 are probably induced by CREB, and the transcriptional activity from pLINC00473 is likely to be increased by recruitment of the bHLH-PAS transcription factor NPAS4 and ARNT2 heterodimer to the PasRE.
hiPSCd Neuron Synaptic Activity-Controlled Late Response Gene Set Contains Cell Type-Specifically Regulated Genes
RNA levels of 428 or 215 human genes were detected to be significantly changed (padj < 0.1) with RNA-seq 4 hr after Bic/4AP addition to the 7-week hiPSCd neuron/mouse primary hippocampal neuron co-culture (Figure 6A; Table S5) or to the 10-week hiPSCd neuron-only culture (Table S5), respectively. Although the overlap of significantly regulated genes was smaller between the two culture conditions than detected for the 1-hr time point (Figures 6B and 4B), the mean fold change values of the total of these 524 genes correlated strongly between the datasets (Figure 6C, r = 0.88). Using the same two criteria as for defining the human IE genes, we designated 218 human genes to belong to the later phase of the synaptic activity-responsive genomic program in hiPSCd neurons. From these we excluded 20 genes that we had designated to be IE genes, and we acquired a set of 198 human synaptic activity-regulated late-response (LR) genes (Table S6; Figure 6D). The majority of the human LR genes (167 genes, 84.3%) have mouse orthologs that were correspondingly regulated in mouse primary neurons in this study and/or have been shown previously to be activity regulated (Balik et al., 2013, Kim et al., 2010, Maze et al., 2015, Mo et al., 2015, Saha et al., 2011, Spiegel et al., 2014, Zanzouri et al., 2006, Zhang et al., 2007, Zhang et al., 2009). The mouse orthologs of 22 or nine human LR genes that were up- or downregulated, respectively, in hiPSCd neurons have not been described to be neuronal activity regulated or have been found to be regulated in the opposite direction in mice by others and/or by us (Table S7).
Figure 6.

Human iPSCd Neuron Synaptic Activity-Regulated Late-Response Genes
(A) RNA-seq MA plot of gene expression changes in hiPSCd neurons 4 hr after Bic/4AP addition to the 7-week mixed-species cultures. Dots representing genes with significantly changed RNA levels (padj < 0.1) are red. n = 3.
(B) Venn diagram displays human genes with significantly changed RNA levels after 4-hr Bic/4AP treatment of 7-week mixed-species cultures (Hs[+Mm]) and 10-week hiPSCd neuron cultures (Hs).
(C) Correlation of expression log2 fold change (FC[log2]) values of all of the 524 human genes shown in (B) in Hs(+Mm) culture with the respective values obtained from the Hs culture. Dots represent mean values of three biological replicate experiments. Pearson’s r, p < 0.0001.
(D) Distribution of the human late-response (LR) genes according to the information on their mouse orthologs. hiPSCd n. down, downregulated in hiPSCd neurons but no evidence for neuronal activity-dependent downregulation of the mouse ortholog or no mouse ortholog; hiPSCd n. and Mm down, downregulated in hiPSCd neurons and the mouse ortholog downregulated in this and/or other studies; hiPSCd n. and Mm up, upregulated in hiPSCd neurons and the mouse ortholog upregulated in this and/or other studies; and hiPSCd n. up, upregulated in hiPSCd neurons but no evidence for neuronal activity-dependent upregulation of the mouse ortholog. See also Table S7. GO terms enriched within upregulated human LR genes are shown.
(E) Correlation of expression FC(log2) values of 198 human LR genes in the co-culture after 4 hr of Bic/4AP treatment with the FC(log2) values of their mouse orthologs in the same culture. Dots represent mean values of three biological replicate experiments. Examples that are among the most strongly up- or downregulated genes in either of the species are indicated. Pearson’s r, p < 0.0001.
See also Figures S3–S5.
The only significantly enriched GO categories among the 150 upregulated human LR genes were synapse (GO:0045202, false discovery rate [FDR]B&Y = 2.56E−03) and synapse part (GO:0044456, FDRB&Y = 2.74E−03, Figure 6D). This suggests that a key consequence of synaptic activity-dependent gene expression in hiPSCd neurons could be the adjustment of the composition and function of synapses. Downregulated genes did not have significant over-representation of any GO term.
RNA level changes of the human LR genes and their mouse orthologs in the 7-week mixed-species cultures were positively correlated (r = 0.46; Figure 6E). However, the correlation between human and mouse gene RNA level changes 4 hr after the Bic/4AP addition was significantly weaker than that at the 1-hr time point (r = 0.46 versus r = 0.73, Z = 2.5, p = 0.012, Fisher Z-transformation). Furthermore, the levels of a number of human LR genes were changed hiPSCd neuron specifically, suggesting that the late phase of the transcriptional response to synaptic activity depends more on the cell type and/or the species than the early phase. We also noted that the human LR genes include the orthologs for 26 mouse excitatory neuron-specifically induced genes, like Erf, Homer1, and Scg2, and ten mouse inhibitory neuron-specifically induced genes, like Nab1 and Hivep2 (Spiegel et al., 2014), indicating that the activity-regulated gene program described here for hiPSCd neurons originates from both excitatory and inhibitory cells. It seems likely that the neuron type, including possible effects determined by the species, defines the complete set of LR genes that are regulated by synaptic activity.
Potential Lineage-Specific Control of Synaptic Activity-Regulated Genes
It is uncertain whether synaptic activity-induced transcription in hiPSCd neurons reflects that of the human brain in vivo. Testing this experimentally in humans is inconceivable, so we addressed the question indirectly. First, we used the dataset from Cheung et al. (2010) to find out if the promoters of human genes regulated by synaptic activity in hiPSCd neurons have a neuron-enriched open chromatin-associated transcription initiation mark H3K4me3 in the human prefrontal cortex in vivo during development and in the adult. This is indicative of the genes’ accessibility for activity-dependent regulation in the human brain in vivo. The neuron-enriched H3K4me3 promoter mark was present on significantly more genes than expected by chance in all hiPSCd neuron synaptic activity-regulated gene groups, except the hiPSCd neuron-specifically downregulated genes (Figure 7A). This reveals that the genes detected here to be synaptic activity regulated in hiPSCd neurons are enriched for genes that are more apt to transcription in the human brain than in other tissues.
Figure 7.

Potential Species-Specific Control of hiPSCd Neuron Synaptic Activity-Regulated Genes
(A) Percentages of human synaptic activity-regulated IE or LR genes positive for neuron-enriched promoter H3K4me3 mark, according to the data from Cheung et al. (2010), are shown.
(B) Percentages of human synaptic activity-regulated IE or LR genes positive for human-specific (Hs-specific) epigenetic enhancer and/or promoter regulatory gain(s), according to the data from Reilly et al. (2015), are shown.
(A and B) LR genes were grouped as per Figure 6D. Common, regulation in hiPSCd neurons and in mouse; Hs, regulation only in hiPSCd neurons; random, random genes from all genes assessed by RNA-seq. Numbers above bars specify genes with the respective epigenetic modification from genes in each group. (A and promoter gains in B) Binominal test, ∗p < 0.05 and ∗∗∗p < 0.001. Enhancer + promoter gains in (B), Holm adjusted Fisher’s exact test.
(C) RT-qPCR analysis of human (Hs) and mouse (Mm) HIC1/Hic1 mRNA levels after treatment of the mixed-species culture with Bic/4AP. n = 3; mean ± SEM; Holm-Sidak adjusted t tests, asterisk indicates significance at 4 hr, ∗p < 0.05. See also Figure S6B.
(D) Ten-species multiple alignment of a part of the conserved sequence element containing the EGR1-binding motif in the human HIC1 promoter is shown.
(E) Conservation (100 vertebrate species phastCons) of the human HIC1 promoter adapted from the University of California, Santa Cruz (UCSC) Genome Browser with the ENCODE project transcription factor-binding sites determined with ChIP-seq for the indicated transcription factors is shown.
(F) Luciferase reporter assay with the firefly luciferase (FFluc) under the control of the mouse Hic1 promoter in mouse primary hippocampal neurons. Response to Bic/4AP treatment is shown. TSSs are indicated with arrows. Numbers specify base pairs upstream (−) or downstream (+) of the TSS. [+EGR1], addition of the EGR1 site shown in (D) by mutation of two nucleotides according to the human sequence. n = 3; mean ± SEM; Holm-Sidak adjusted t tests, p value is for the 6-hr time point.
We next explored whether the synaptic activity-controlled gene program described here includes human genes associated with regulatory changes compared to other mammals, by examining if hiPSCd neuron activity-regulated genes have human-specific promoter or enhancer H3K27ac and/or H3K4me2 gains during human brain cortex development in vivo, according to the data from Reilly et al. (2015). Significantly more genes than expected by chance were positive for a human-specific epigenetic regulatory gain only among the genes that were hiPSCd neuron-specifically upregulated by 4 hr of Bic/4AP-induced activity (Figure 7B). This infers that expression of a relatively large proportion of the genes shown here to be responsive to synaptic activity only in hiPSCd neurons is probably regulated in a human-specific manner also in the brain in vivo.
Finally, we focused on HIC1/Hic1 to study if regulatory DNA sequence dissimilarities of species rather than the cell type could explain temporal differences in gene expression in response to synaptic activity between hiPSCd neurons and mouse primary neurons. We chose HIC1/Hic1 because it was the only relatively strongly induced IE gene that was upregulated more transiently in mouse neurons compared to hiPSCd neurons, a result that we confirmed with species-specific RT-qPCR (Figures 7C and S6B). The promoter of HIC1/Hic1 is not well conserved among vertebrates in general, but it contains several almost identical regions potentially encompassing important regulatory sequences (Figure 7E). We searched these conserved sequences for cis elements that are bound by transcription factors in human cells using the Encyclopedia of DNA Elements (ENCODE) chromatin immunoprecipitation sequencing (ChIP-seq) data, and we found that the only orthologous binding motif relevant to activity-controlled gene regulation that is not present in the rodent Hic1 promoter is the IE protein EGR1-binding sequence located ∼1,000 bp upstream of the human HIC1 RefSeq transcript 5′ end (Figures 7D and 7E). This suggests that, upon synaptic activity, mRNA levels of mouse Hic1 may not be sustained because Egr1 cannot bind to the mouse Hic1 promoter. To test this, we generated a luciferase reporter construct with the mouse Hic1 promoter, and, for comparison, we inserted the EGR1 site in it by changing two nucleotides according to the human HIC1 promoter. Consistent with our hypothesis, luciferase assays in mouse primary neurons revealed that the mouse Hic1 promoter humanized with the EGR1 motif produced a moderate rise in luciferase levels after 6 hr of Bic/4AP treatment, whereas the wild-type promoter did not (Figure 7F). This result supports the idea that a simple DNA element alteration in the promoter could lead to a difference in the temporal profile of Hic1 expression in response to synaptic activity in mice compared to its ortholog’s expression profile in humans.
Discussion
This study reveals three ways in which the human genetic background influences neuronal adaptogenomics compared to that of mice: (1) it expands the repertoire of human synaptic activity-regulated genes with lineage-specific genes, (2) it permits synaptic activity-dependent regulation of some human genes whose orthologs are not activity-regulated in mice, and (3) it can gene-selectively change the temporal profile of synaptic activity-responsive transcriptional activity.
We identify three human genes, BRE-AS1, LINC00473, and ZNF331, that lack mouse orthologs but are regulated by synaptic activity via conserved signaling mechanisms to be included in the human activity-responsive adaptive gene program. LINC00473, which belongs to the core set of hiPSCd neuron synaptic activity-regulated genes (Figure S7), has been shown to be a primate-specific cAMP pathway-responsive noncoding RNA that negatively regulates IE genes (Reitmair et al., 2012). ZNF331 and also HIC1/Hic1, the only relatively strongly induced IE gene that had a more sustained induction in humans compared to mice, encode transcriptional repressors. Interestingly, a number of synaptic activity-controlled IE genes were upregulated more transiently in hiPSCd neurons than their mouse counterparts in primary neurons (e.g., EGR4/Egr4, FOSB/Fosb, and NPAS4/Npas4), possibly reflecting lineage-specific IE gene regulation by LINC00473, ZNF331, and HIC1. More transient upregulation of some of the IE genes in hiPSCd neurons cannot be explained by a lack of sustained Bic/4AP-induced activity and mechanisms amplifying transcription, since the distinct temporal regulation of synaptic activity-controlled genes between hiPSCd neurons and mouse primary neurons was gene selective. Specifically, along with the distinct temporal profiles, the upregulation of several orthologous IE genes in both human and mouse cells was commonly transient (e.g., ARC/Arc, BTG2/Btg2, and NR4A1/Nr4a1) or commonly amplified after the initial response (e.g., CSRNP1/Csrnp1, FOSL2/Fosl2, and RGS2/Rgs2). We therefore propose that genetic differences gene-selectively cause some of the orthologous human and mouse IE genes to have different expression kinetics after synaptic activity. The mechanisms probably involve both regulation in trans, including regulation by lineage-specific activity-responsive genes as discussed above, and regulation in cis, as indicated by our result with the Hic1 promoter that suggests a role for a species-specific cis-regulatory element. Such an interpretation also is supported by a recent study that used a high concentration of extracellular KCl to stimulate neurons (Qiu et al., 2016).
In rodents a large fraction of neuronal activity-induced IE genes are transcription factors (Lanahan and Worley, 1998). Our data confirm that genes encoding orthologs to these also are enriched among the synaptic activity-regulated IE genes in humans. The induced transcription factors are in turn expected to regulate genes that produce the adaptive response. In mouse excitatory and inhibitory neurons the adaptive transcriptional responses are different (Spiegel et al., 2014), indicating that neuron type-specific activity-dependent gene regulation occurs. We found that the mouse orthologs of 15.7% of the hiPSCd neuron late-response genes have no evidence for neuronal activity-dependent regulation. It could be that, because the hiPSCd neurons are relatively immature, this cell type-specific part of the response is developmental stage specific rather than species specific. However, the genes upregulated only in hiPSCd neurons were over-represented by genes that have a neuron-enriched H3K4me3 promoter mark in the human brain throughout development as well as in the adult. First, this means that these genes presumably have neuronal functions. Second, this suggests that a considerable fraction of hiPSCd neuron-specifically synaptic activity-regulated genes are accessible for regulation during the course of the entire lifespan and are unlikely to be exclusively responsive to activity during neuronal maturation. Besides, the genes that were upregulated only in hiPSCd neurons displayed enrichment for genes that are accompanied by human-specific epigenetic gains in the human brain (Reilly et al., 2015), suggesting that they might include genes whose regulation, possibly including activity-dependent regulation, is species specific.
Our data suggest that acquisition of lineage-specific synapse-to-nucleus signaling target genes and differences in synaptic activity-dependent regulation of common targets contribute to the phenotypic differences of humans compared to mice. We provide some outstanding examples supporting this view. First, one of the genes whose upregulation by synaptic activity was specific to hiPSCd neurons was ADRA1B (Table S7; Figure S7), which is associated with attention deficit/hyperactivity disorder (Mick et al., 2010). If ADRA1B is activity regulated in vivo, it could be involved in the regulation of mood, cognition, and behavior as an activity-induced component of the monoaminergic system in humans that is not synaptic activity dependent in mice (but see Kobori et al., 2011 and Shen and Gundlach, 1998). Second, we detected CAMTA1, which is associated with human episodic memory performance (Huentelman et al., 2007) and intellectual disability (Thevenon et al., 2012), to be upregulated by activity in hiPSCd neurons but not in mouse neurons (Table S7). This is exciting because CAMTA1 is linked to a conserved noncoding sequence with accelerated evolution in humans (Prabhakar et al., 2006), has several putative enhancer regions with human-specific epigenetic gains (Reilly et al., 2015), and knockdown of Camta1 in the mouse hippocampus specifically alters long-term memory (Bas-Orth et al., 2016), making CAMTA1 a good candidate for a factor that adjusts episodic memory in a human-specific, synaptic activity-dependent manner. Third, HIC1, the gene with a prolonged increase in mRNA levels after synaptic activity in hiPSCd neurons compared to mouse neurons (Figure S7), negatively regulates expression of reelin receptor genes (Dubuissez et al., 2013). Since reelin is essential for the lamination of the cortex and has roles in neuronal maturation and synaptic functions (Förster et al., 2010), HIC1 may be involved in brain cortex development. Moreover, Miller-Dieker syndrome (MDS) with lissencephaly as part of the phenotype is caused by haploinsufficiency of the genomic locus encompassing HIC1 (Yingling et al., 2003). Although heterozygous loss of the PAFAH1B1 (alias LIS1) and YWHAE (alias 14-3-3ε) genes is believed to cause lissencaphaly in MDS, there is evidence that it also can result from a deletion not involving these but the HIC1 gene (DECIPHER 250068; Firth et al., 2009). Collectively, these examples accentuate that some of the potentially human lineage-specifically regulated genes uncovered in this study take part in brain functions or developmental processes that could account for the superior cognitive abilities of humans compared to other mammals. Thus, the evolution of synaptic activity-regulated adaptogenomics may have driven the evolution of cognition.
In conclusion, this study demonstrates that the generic transcriptional response to evolutionarily conserved synapse-to-nucleus signaling has lineage-specific features in human neurons. This confirms that inherent genetic differences have an impact on synaptic activity-dependent transcription, providing a mechanism of how they may tune adaptive, plasticity-related brain functions.
Experimental Procedures
Human iPSCs
The iPSC lines hiPS D1 and hiPS 3 were obtained from Dr. Jochen Utikal (DKFZ). hiPS D1 was generated from healthy human fibroblasts with an inducible polycistronic lentiviral reprogramming vector encoding for KLF4, MYC, POU5F1, and SOX2 (Horschitz et al., 2015). hiPS 3 was generated from healthy human melanocytes with inducible lentiviral reprogramming vectors encoding for KLF4, MYC, and POU5F1 (Utikal et al., 2009).
Generation of NPCs
We differentiated iPSCs to NPCs using a slightly modified spin embryoid body protocol (Kim et al., 2011) with dual SMAD inhibition (Chambers et al., 2009), as specified in the Supplemental Experimental Procedures.
Neuronal Differentiation
Differentiation of NPCs was initiated by plating 50,000 cells/cm2 on poly-ornithine- (0.1 mg/mL) and laminin- (10 μg/mL) (both Sigma-Aldrich) coated (PO/Lam) dishes in NPC medium (see the Supplemental Experimental Procedures) without EGF and FGF2. After 1 week with medium changes every other day, cells were replated 75,000 cells/cm2 on PO/Lam dishes or coverslips in neuronal differentiation (ND) medium (Neurobasal, Glutamax [1 mM], B27-vitamin A [2%], Pen/Strep [1:200; all Thermo Fisher Scientific], ascorbic acid [200 μM, Sigma-Aldrich], and BDNF [10 ng/mL, PeproTech]). Differentiation was allowed to proceed for up to 9 more weeks with medium changes three times per week. See also Figure S1.
Mixed-Species Culture
P0 mouse primary hippocampal cells, 75,000 cells/cm2, were added to hiPSCd neurons in ND medium for the last 10 days of differentiation; 10 days in vitro is sufficient for inducing AP bursting in mouse primary neuron cultures with Bic/4AP (Arnold et al., 2005).
RNA-Seq Data Differential Gene Expression Analysis
RNA-seq was performed on four biological replicates of untreated and 1-hr Bic/4AP-treated mixed-species or hiPSCd neuron-only culture samples and three biological replicates of 4-hr Bic/4AP-treated mixed-species or hiPSCd neuron-only culture samples (GEO: GSE88773). TopHat2 (version 2.0.9) (Kim et al., 2013), HTSeq-count (HTSeq version 0.6.0 or 0.6.1) (Anders et al., 2015), and DESeq2 (version 1.8.1) (Love et al., 2014) were used for RNA-seq read mapping, counting, and differential gene expression analysis, respectively. The co-culture sample reads were filtered for either human or mouse reads as specified in the Supplemental Experimental Procedures.
Patch-Clamp Recordings
Whole-cell patch-clamp recordings were made at 32°C from cells plated on glass coverslips and secured with a platinum ring in a recording chamber (Open access chamber-1, Science Products) with heated in-line perfusion (32°C, TC324B, Warner Instruments) running constantly at 2 mL/min.
Statistical Analyses
Two samples were compared with two-tailed Student’s or Welch’s t test. If indicated, Holm-Sidak p adjustment was applied. Multiple samples were compared with one-way ANOVA and Dunnett’s or Tukey’s test, two-way ANOVA and Tukey’s test, or two-way ANOVA on ranks and Holm-Sidak test. In RNA-seq data analysis, default statistical approaches of DESeq2 were applied.
Additional Details
Additional details about our methods are in the Supplemental Experimental Procedures.
Author Contributions
H.B. conceived the study. P.P. and C.P.B. performed and analyzed the experiments. P.P., C.P.B., and H.B. designed the experiments, interpreted the data, and wrote the paper.
Acknowledgments
We thank Dr. Utikal for hiPSCs, Dr. Galach and D. Roth for support in culturing hiPSCs, Dr. Horschitz for know-how on the generation of NPCs, I. Bünzli-Ehret for preparing primary neurons, V. Bantavi for technical assistance, Dr. Calogero for ideas on mixed-species RNA-seq analysis, and the nCounter Core Facility in Heidelberg. This work was supported by an ERC Advanced Grant (H.B.), a German-Israeli Project Cooperation (BA 1007/7-1), a fellowship by the Excellence Cluster CellNetworks at Heidelberg University (P.P.), and the SFB 1134. H.B. is a member of the Excellence Cluster CellNetworks at Heidelberg University.
Published: January 3, 2017
Footnotes
Supplemental Information includes Supplemental Experimental Procedures, seven figures, and seven tables and can be found with this article online at http://dx.doi.org/10.1016/j.celrep.2016.12.018.
Accession Numbers
The accession number for the RNA sequencing data reported in this paper is GEO: GSE88773.
Supplemental Information
Results of the ToppGene Suite analysis of GO category over-representation among genes more than 8-fold upregulated after generation of NPCs from iPSCs and 7 weeks of neuronal differentiation of NPCs (2106 genes). Results of the ToppGene Suite analysis of GO category over-representation among genes more than 8-fold downregulated after generation of NPCs from iPSCs and 7 weeks of neuronal differentiation of NPCs (2105 genes).
DESeq2 results showing human genes with significantly (padj < 0.1) changed RNA expression levels in response to one hour of Bic/4AP-treatment of 7 weeks differentiated hiPSCd neurons in co-culture with mouse primary hippocampal neurons. DESeq2 results showing human genes with significantly (padj < 0.1) changed RNA expression levels in response to one hour of Bic/4AP-treatment of 10 weeks differentiated hiPSCd neurons.
Shown are DESeq2 results for human IE genes in response to one hour of Bic/4AP-treatment of 7 weeks differentiated hiPSCd neurons in co-culture with mouse primary hippocampal neurons.
DESeq2 results showing human genes with significantly (padj < 0.1) changed RNA expression levels in response to four hours of Bic/4AP-treatment of 7 weeks differentiated hiPSCd neurons in co-culture with mouse primary hippocampal neurons. DESeq2 results showing human genes with significantly (padj < 0.1) changed RNA expression levels in response to four hours of Bic/4AP-treatment of 10 weeks differentiated hiPSCd neurons.
Shown are DESeq2 results for human late response genes in response to one hour of Bic/4AP-treatment of 7 weeks differentiated hiPSCd neurons in co-culture with mouse primary hippocampal neurons.
References
- Anders S., Pyl P.T., Huber W. HTSeq--a Python framework to work with high-throughput sequencing data. Bioinformatics. 2015;31:166–169. doi: 10.1093/bioinformatics/btu638. [DOI] [PMC free article] [PubMed] [Google Scholar]
- Arnold F.J., Hofmann F., Bengtson C.P., Wittmann M., Vanhoutte P., Bading H. Microelectrode array recordings of cultured hippocampal networks reveal a simple model for transcription and protein synthesis-dependent plasticity. J. Physiol. 2005;564:3–19. doi: 10.1113/jphysiol.2004.077446. [DOI] [PMC free article] [PubMed] [Google Scholar]
- Bading H. Nuclear calcium signalling in the regulation of brain function. Nat. Rev. Neurosci. 2013;14:593–608. doi: 10.1038/nrn3531. [DOI] [PubMed] [Google Scholar]
- Bading H., Ginty D.D., Greenberg M.E. Regulation of gene expression in hippocampal neurons by distinct calcium signaling pathways. Science. 1993;260:181–186. doi: 10.1126/science.8097060. [DOI] [PubMed] [Google Scholar]
- Bae B.I., Jayaraman D., Walsh C.A. Genetic changes shaping the human brain. Dev. Cell. 2015;32:423–434. doi: 10.1016/j.devcel.2015.01.035. [DOI] [PMC free article] [PubMed] [Google Scholar]
- Balik A., Penn A.C., Nemoda Z., Greger I.H. Activity-regulated RNA editing in select neuronal subfields in hippocampus. Nucleic Acids Res. 2013;41:1124–1134. doi: 10.1093/nar/gks1045. [DOI] [PMC free article] [PubMed] [Google Scholar]
- Bas-Orth C., Tan Y.W., Oliveira A.M., Bengtson C.P., Bading H. The calmodulin-binding transcription activator CAMTA1 is required for long-term memory formation in mice. Learn. Mem. 2016;23:313–321. doi: 10.1101/lm.041111.115. [DOI] [PMC free article] [PubMed] [Google Scholar]
- Ben-Ari Y., Gaiarsa J.L., Tyzio R., Khazipov R. GABA: a pioneer transmitter that excites immature neurons and generates primitive oscillations. Physiol. Rev. 2007;87:1215–1284. doi: 10.1152/physrev.00017.2006. [DOI] [PubMed] [Google Scholar]
- Chambers S.M., Fasano C.A., Papapetrou E.P., Tomishima M., Sadelain M., Studer L. Highly efficient neural conversion of human ES and iPS cells by dual inhibition of SMAD signaling. Nat. Biotechnol. 2009;27:275–280. doi: 10.1038/nbt.1529. [DOI] [PMC free article] [PubMed] [Google Scholar]
- Cheung I., Shulha H.P., Jiang Y., Matevossian A., Wang J., Weng Z., Akbarian S. Developmental regulation and individual differences of neuronal H3K4me3 epigenomes in the prefrontal cortex. Proc. Natl. Acad. Sci. USA. 2010;107:8824–8829. doi: 10.1073/pnas.1001702107. [DOI] [PMC free article] [PubMed] [Google Scholar]
- De Cesare D., Sassone-Corsi P. Transcriptional regulation by cyclic AMP-responsive factors. Prog. Nucleic Acid Res. Mol. Biol. 2000;64:343–369. doi: 10.1016/s0079-6603(00)64009-6. [DOI] [PubMed] [Google Scholar]
- Dubuissez M., Faiderbe P., Pinte S., Dehennaut V., Rood B.R., Leprince D. The Reelin receptors ApoER2 and VLDLR are direct target genes of HIC1 (Hypermethylated In Cancer 1) Biochem. Biophys. Res. Commun. 2013;440:424–430. doi: 10.1016/j.bbrc.2013.09.091. [DOI] [PubMed] [Google Scholar]
- Firth H.V., Richards S.M., Bevan A.P., Clayton S., Corpas M., Rajan D., Van Vooren S., Moreau Y., Pettett R.M., Carter N.P. DECIPHER: database of chromosomal imbalance and phenotype in humans using Ensembl resources. Am. J. Hum. Genet. 2009;84:524–533. doi: 10.1016/j.ajhg.2009.03.010. [DOI] [PMC free article] [PubMed] [Google Scholar]
- Förster E., Bock H.H., Herz J., Chai X., Frotscher M., Zhao S. Emerging topics in Reelin function. Eur. J. Neurosci. 2010;31:1511–1518. doi: 10.1111/j.1460-9568.2010.07222.x. [DOI] [PMC free article] [PubMed] [Google Scholar]
- Frank D.A., Greenberg M.E. CREB: a mediator of long-term memory from mollusks to mammals. Cell. 1994;79:5–8. doi: 10.1016/0092-8674(94)90394-8. [DOI] [PubMed] [Google Scholar]
- Geschwind D.H., Rakic P. Cortical evolution: judge the brain by its cover. Neuron. 2013;80:633–647. doi: 10.1016/j.neuron.2013.10.045. [DOI] [PMC free article] [PubMed] [Google Scholar]
- Hardingham G.E., Arnold F.J., Bading H. Nuclear calcium signaling controls CREB-mediated gene expression triggered by synaptic activity. Nat. Neurosci. 2001;4:261–267. doi: 10.1038/85109. [DOI] [PubMed] [Google Scholar]
- Hardingham G.E., Fukunaga Y., Bading H. Extrasynaptic NMDARs oppose synaptic NMDARs by triggering CREB shut-off and cell death pathways. Nat. Neurosci. 2002;5:405–414. doi: 10.1038/nn835. [DOI] [PubMed] [Google Scholar]
- Horschitz S., Matthäus F., Groß A., Rosner J., Galach M., Greffrath W., Treede R.D., Utikal J., Schloss P., Meyer-Lindenberg A. Impact of preconditioning with retinoic acid during early development on morphological and functional characteristics of human induced pluripotent stem cell-derived neurons. Stem Cell Res. (Amst.) 2015;15:30–41. doi: 10.1016/j.scr.2015.04.007. [DOI] [PubMed] [Google Scholar]
- Huentelman M.J., Papassotiropoulos A., Craig D.W., Hoerndli F.J., Pearson J.V., Huynh K.D., Corneveaux J., Hänggi J., Mondadori C.R., Buchmann A. Calmodulin-binding transcription activator 1 (CAMTA1) alleles predispose human episodic memory performance. Hum. Mol. Genet. 2007;16:1469–1477. doi: 10.1093/hmg/ddm097. [DOI] [PubMed] [Google Scholar]
- Kim T.K., Hemberg M., Gray J.M., Costa A.M., Bear D.M., Wu J., Harmin D.A., Laptewicz M., Barbara-Haley K., Kuersten S. Widespread transcription at neuronal activity-regulated enhancers. Nature. 2010;465:182–187. doi: 10.1038/nature09033. [DOI] [PMC free article] [PubMed] [Google Scholar]
- Kim J.E., O’Sullivan M.L., Sanchez C.A., Hwang M., Israel M.A., Brennand K., Deerinck T.J., Goldstein L.S., Gage F.H., Ellisman M.H., Ghosh A. Investigating synapse formation and function using human pluripotent stem cell-derived neurons. Proc. Natl. Acad. Sci. USA. 2011;108:3005–3010. doi: 10.1073/pnas.1007753108. [DOI] [PMC free article] [PubMed] [Google Scholar]
- Kim D., Pertea G., Trapnell C., Pimentel H., Kelley R., Salzberg S.L. TopHat2: accurate alignment of transcriptomes in the presence of insertions, deletions and gene fusions. Genome Biol. 2013;14:R36. doi: 10.1186/gb-2013-14-4-r36. [DOI] [PMC free article] [PubMed] [Google Scholar]
- Kobori N., Hu B., Dash P.K. Altered adrenergic receptor signaling following traumatic brain injury contributes to working memory dysfunction. Neuroscience. 2011;172:293–302. doi: 10.1016/j.neuroscience.2010.10.048. [DOI] [PMC free article] [PubMed] [Google Scholar]
- Lanahan A., Worley P. Immediate-early genes and synaptic function. Neurobiol. Learn. Mem. 1998;70:37–43. doi: 10.1006/nlme.1998.3836. [DOI] [PubMed] [Google Scholar]
- Liu X., Somel M., Tang L., Yan Z., Jiang X., Guo S., Yuan Y., He L., Oleksiak A., Zhang Y. Extension of cortical synaptic development distinguishes humans from chimpanzees and macaques. Genome Res. 2012;22:611–622. doi: 10.1101/gr.127324.111. [DOI] [PMC free article] [PubMed] [Google Scholar]
- Love M.I., Huber W., Anders S. Moderated estimation of fold change and dispersion for RNA-seq data with DESeq2. Genome Biol. 2014;15:550. doi: 10.1186/s13059-014-0550-8. [DOI] [PMC free article] [PubMed] [Google Scholar]
- Maze I., Wenderski W., Noh K.M., Bagot R.C., Tzavaras N., Purushothaman I., Elsässer S.J., Guo Y., Ionete C., Hurd Y.L. Critical role of histone turnover in neuronal transcription and plasticity. Neuron. 2015;87:77–94. doi: 10.1016/j.neuron.2015.06.014. [DOI] [PMC free article] [PubMed] [Google Scholar]
- Mick E., Todorov A., Smalley S., Hu X., Loo S., Todd R.D., Biederman J., Byrne D., Dechairo B., Guiney A. Family-based genome-wide association scan of attention-deficit/hyperactivity disorder. J. Am. Acad. Child Adolesc. Psychiatry. 2010;49:898–905. doi: 10.1016/j.jaac.2010.02.014. [DOI] [PMC free article] [PubMed] [Google Scholar]
- Mo J., Kim C.H., Lee D., Sun W., Lee H.W., Kim H. Early growth response 1 (Egr-1) directly regulates GABAA receptor α2, α4, and θ subunits in the hippocampus. J. Neurochem. 2015;133:489–500. doi: 10.1111/jnc.13077. [DOI] [PubMed] [Google Scholar]
- Necsulea A., Kaessmann H. Evolutionary dynamics of coding and non-coding transcriptomes. Nat. Rev. Genet. 2014;15:734–748. doi: 10.1038/nrg3802. [DOI] [PubMed] [Google Scholar]
- Prabhakar S., Noonan J.P., Pääbo S., Rubin E.M. Accelerated evolution of conserved noncoding sequences in humans. Science. 2006;314:786. doi: 10.1126/science.1130738. [DOI] [PubMed] [Google Scholar]
- Pruunsild P., Sepp M., Orav E., Koppel I., Timmusk T. Identification of cis-elements and transcription factors regulating neuronal activity-dependent transcription of human BDNF gene. J. Neurosci. 2011;31:3295–3308. doi: 10.1523/JNEUROSCI.4540-10.2011. [DOI] [PMC free article] [PubMed] [Google Scholar]
- Qiu J., McQueen J., Bilican B., Dando O., Magnani D., Punovuori K., Selvaraj B.T., Livesey M., Haghi G., Heron S. Evidence for evolutionary divergence of activity-dependent gene expression in developing neurons. eLife. 2016;5:e20337. doi: 10.7554/eLife.20337. [DOI] [PMC free article] [PubMed] [Google Scholar]
- Reilly S.K., Yin J., Ayoub A.E., Emera D., Leng J., Cotney J., Sarro R., Rakic P., Noonan J.P. Evolutionary genomics. Evolutionary changes in promoter and enhancer activity during human corticogenesis. Science. 2015;347:1155–1159. doi: 10.1126/science.1260943. [DOI] [PMC free article] [PubMed] [Google Scholar]
- Reitmair A., Sachs G., Im W.B., Wheeler L. C6orf176: a novel possible regulator of cAMP-mediated gene expression. Physiol. Genomics. 2012;44:152–161. doi: 10.1152/physiolgenomics.00089.2011. [DOI] [PubMed] [Google Scholar]
- Rossner M.J., Dörr J., Gass P., Schwab M.H., Nave K.A. SHARPs: mammalian enhancer-of-split- and hairy-related proteins coupled to neuronal stimulation. Mol. Cell. Neurosci. 1997;9:460–475. doi: 10.1006/mcne.1997.0640. [DOI] [PubMed] [Google Scholar]
- Saha R.N., Wissink E.M., Bailey E.R., Zhao M., Fargo D.C., Hwang J.Y., Daigle K.R., Fenn J.D., Adelman K., Dudek S.M. Rapid activity-induced transcription of Arc and other IEGs relies on poised RNA polymerase II. Nat. Neurosci. 2011;14:848–856. doi: 10.1038/nn.2839. [DOI] [PMC free article] [PubMed] [Google Scholar]
- Shen P.J., Gundlach A.L. Differential spatiotemporal alterations in adrenoceptor mRNAs and binding sites in cerebral cortex following spreading depression: selective and prolonged up-regulation of alpha1B-adrenoceptors. Exp. Neurol. 1998;154:612–627. doi: 10.1006/exnr.1998.6915. [DOI] [PubMed] [Google Scholar]
- Silbereis J.C., Pochareddy S., Zhu Y., Li M., Sestan N. The cellular and molecular landscapes of the developing human central nervous system. Neuron. 2016;89:248–268. doi: 10.1016/j.neuron.2015.12.008. [DOI] [PMC free article] [PubMed] [Google Scholar]
- Spiegel I., Mardinly A.R., Gabel H.W., Bazinet J.E., Couch C.H., Tzeng C.P., Harmin D.A., Greenberg M.E. Npas4 regulates excitatory-inhibitory balance within neural circuits through cell-type-specific gene programs. Cell. 2014;157:1216–1229. doi: 10.1016/j.cell.2014.03.058. [DOI] [PMC free article] [PubMed] [Google Scholar]
- Thevenon J., Lopez E., Keren B., Heron D., Mignot C., Altuzarra C., Béri-Dexheimer M., Bonnet C., Magnin E., Burglen L. Intragenic CAMTA1 rearrangements cause non-progressive congenital ataxia with or without intellectual disability. J. Med. Genet. 2012;49:400–408. doi: 10.1136/jmedgenet-2012-100856. [DOI] [PubMed] [Google Scholar]
- Utikal J., Maherali N., Kulalert W., Hochedlinger K. Sox2 is dispensable for the reprogramming of melanocytes and melanoma cells into induced pluripotent stem cells. J. Cell Sci. 2009;122:3502–3510. doi: 10.1242/jcs.054783. [DOI] [PMC free article] [PubMed] [Google Scholar]
- Wang J., Campos B., Jamieson G.A., Jr., Kaetzel M.A., Dedman J.R. Functional elimination of calmodulin within the nucleus by targeted expression of an inhibitor peptide. J. Biol. Chem. 1995;270:30245–30248. doi: 10.1074/jbc.270.51.30245. [DOI] [PubMed] [Google Scholar]
- West A.E., Greenberg M.E. Neuronal activity-regulated gene transcription in synapse development and cognitive function. Cold Spring Harb. Perspect. Biol. 2011;3:a005744. doi: 10.1101/cshperspect.a005744. [DOI] [PMC free article] [PubMed] [Google Scholar]
- Wilson M.D., Odom D.T. Evolution of transcriptional control in mammals. Curr. Opin. Genet. Dev. 2009;19:579–585. doi: 10.1016/j.gde.2009.10.003. [DOI] [PubMed] [Google Scholar]
- Yingling J., Toyo-Oka K., Wynshaw-Boris A. Miller-Dieker syndrome: analysis of a human contiguous gene syndrome in the mouse. Am. J. Hum. Genet. 2003;73:475–488. doi: 10.1086/378096. [DOI] [PMC free article] [PubMed] [Google Scholar]
- Zanzouri M., Lauritzen I., Duprat F., Mazzuca M., Lesage F., Lazdunski M., Patel A. Membrane potential-regulated transcription of the resting K+ conductance TASK-3 via the calcineurin pathway. J. Biol. Chem. 2006;281:28910–28918. doi: 10.1074/jbc.M606092200. [DOI] [PubMed] [Google Scholar]
- Zhang S.J., Steijaert M.N., Lau D., Schütz G., Delucinge-Vivier C., Descombes P., Bading H. Decoding NMDA receptor signaling: identification of genomic programs specifying neuronal survival and death. Neuron. 2007;53:549–562. doi: 10.1016/j.neuron.2007.01.025. [DOI] [PubMed] [Google Scholar]
- Zhang S.J., Zou M., Lu L., Lau D., Ditzel D.A., Delucinge-Vivier C., Aso Y., Descombes P., Bading H. Nuclear calcium signaling controls expression of a large gene pool: identification of a gene program for acquired neuroprotection induced by synaptic activity. PLoS Genet. 2009;5:e1000604. doi: 10.1371/journal.pgen.1000604. [DOI] [PMC free article] [PubMed] [Google Scholar]
Associated Data
This section collects any data citations, data availability statements, or supplementary materials included in this article.
Supplementary Materials
Results of the ToppGene Suite analysis of GO category over-representation among genes more than 8-fold upregulated after generation of NPCs from iPSCs and 7 weeks of neuronal differentiation of NPCs (2106 genes). Results of the ToppGene Suite analysis of GO category over-representation among genes more than 8-fold downregulated after generation of NPCs from iPSCs and 7 weeks of neuronal differentiation of NPCs (2105 genes).
DESeq2 results showing human genes with significantly (padj < 0.1) changed RNA expression levels in response to one hour of Bic/4AP-treatment of 7 weeks differentiated hiPSCd neurons in co-culture with mouse primary hippocampal neurons. DESeq2 results showing human genes with significantly (padj < 0.1) changed RNA expression levels in response to one hour of Bic/4AP-treatment of 10 weeks differentiated hiPSCd neurons.
Shown are DESeq2 results for human IE genes in response to one hour of Bic/4AP-treatment of 7 weeks differentiated hiPSCd neurons in co-culture with mouse primary hippocampal neurons.
DESeq2 results showing human genes with significantly (padj < 0.1) changed RNA expression levels in response to four hours of Bic/4AP-treatment of 7 weeks differentiated hiPSCd neurons in co-culture with mouse primary hippocampal neurons. DESeq2 results showing human genes with significantly (padj < 0.1) changed RNA expression levels in response to four hours of Bic/4AP-treatment of 10 weeks differentiated hiPSCd neurons.
Shown are DESeq2 results for human late response genes in response to one hour of Bic/4AP-treatment of 7 weeks differentiated hiPSCd neurons in co-culture with mouse primary hippocampal neurons.