Abstract
Ribosome biogenesis is a highly complex process in eukaryotes, involving temporally and spatially regulated ribosomal protein (r-protein) binding and ribosomal RNA remodelling events in the nucleolus, nucleoplasm and cytoplasm1,2. Hundreds of assembly factors, organized into sequential functional groups3,4, facilitate and guide the maturation process into productive assembly branches in and across different cellular compartments. However, the precise mechanisms by which these assembly factors function are largely unknown. Here we use cryo-electron microscopy to characterize the structures of yeast nucleoplasmic pre-60S particles affinity-purified using the epitope-tagged assembly factor Nog2. Our data pinpoint the locations and determine the structures of over 20 assembly factors, which are enriched in two areas: an arc region extending from the central protuberance to the polypeptide tunnel exit, and the domain including the internal transcribed spacer 2 (ITS2) that separates 5.8S and 25S ribosomal RNAs. In particular, two regulatory GTPases, Nog2 and Nog1, act as hub proteins to interact with multiple, distant assembly factors and functional ribosomal RNA elements, manifesting their critical roles in structural remodelling checkpoints and nuclear export. Moreover, our snapshots of compositionally and structurally different pre-60S intermediates provide essential mechanistic details for three major remodelling events before nuclear export: rotation of the 5S ribonucleoprotein, construction of the active centre and ITS2 removal. The rich structural information in our structures provides a framework to dissect molecular roles of diverse assembly factors in eukaryotic ribosome assembly.
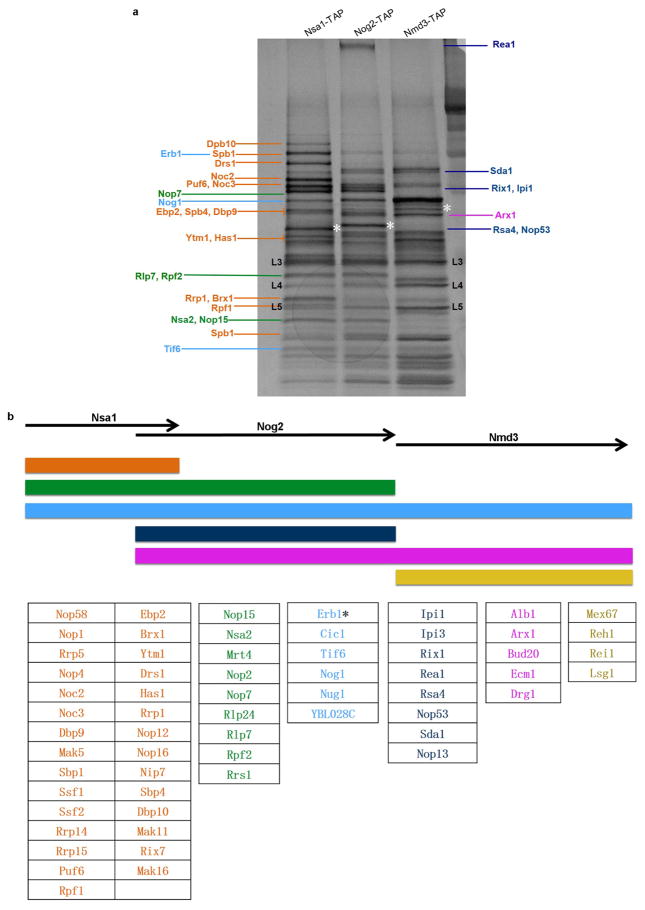
Assembly of pre-60S ribosomes occurs in consecutive stages, orchestrated by coordinated groups of assembly factors. The presence or absence of three mostly non-overlapping factors in pre-60S particles, Nsa1, Nog2 and Nmd3, defines a continuous transition from the nucleolus through the nucleoplasm to final stages licensing nuclear export (Extended Data Fig. 1). Nog2, an essential GTPase5, enters pre-60S particles in the nucleolus, and is present during most nucleoplasmic stages. The lifetime of Nog2 coincides with three important pre-60S remodelling and processing events: rotation of the 5S ribonucleoprotein (RNP)6, construction of the active site and cleavage of ITS2 (ref. 5), as well as the temporally regulated binding and release of assembly factors7. Nog2 departure constitutes a critical checkpoint for nuclear export of pre-60S particles8. The remodelling ATPase Rea1 is thought to catalyse conformational changes in late nucleoplasmic particles that stimulate the GTPase activity of Nog2 (ref. 8). This enables release of Nog2 and replacement by the key export factor Nmd3, whose binding site overlaps with that of Nog2 (refs 8, 9). This model of nucleoplasmic pre-60S maturation was established largely from biochemical and genetic experiments (reviewed in ref. 1). Low-resolution cryo-electron microscopy (cryo-EM) maps have revealed the location of several different assembly factors6,10–14, but atomic contacts with the 60S subunit are only known for Tif6 (ref. 15), Arx1, Alb1 and Rei1 (ref. 16). Nevertheless, spatial relationships among most of the assembly factors in pre-60S particles remain unclear. In particular, key assembly events responsible for activating successive maturation checkpoints are yet to be determined.
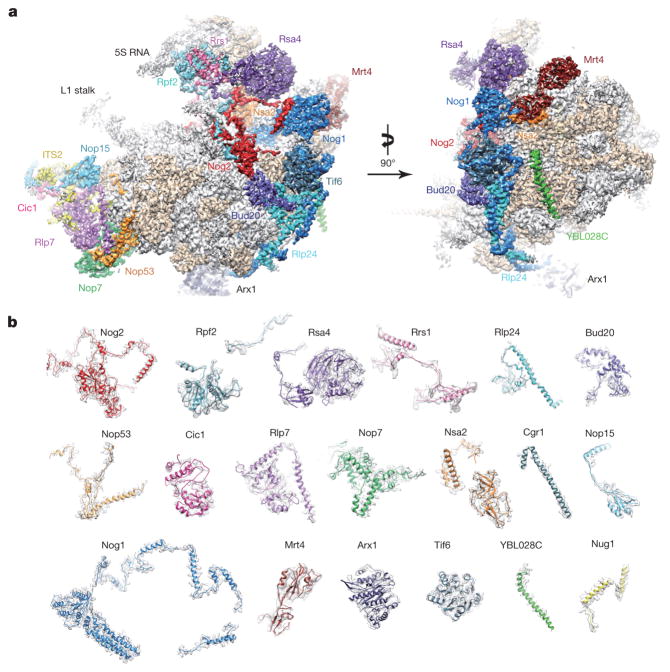
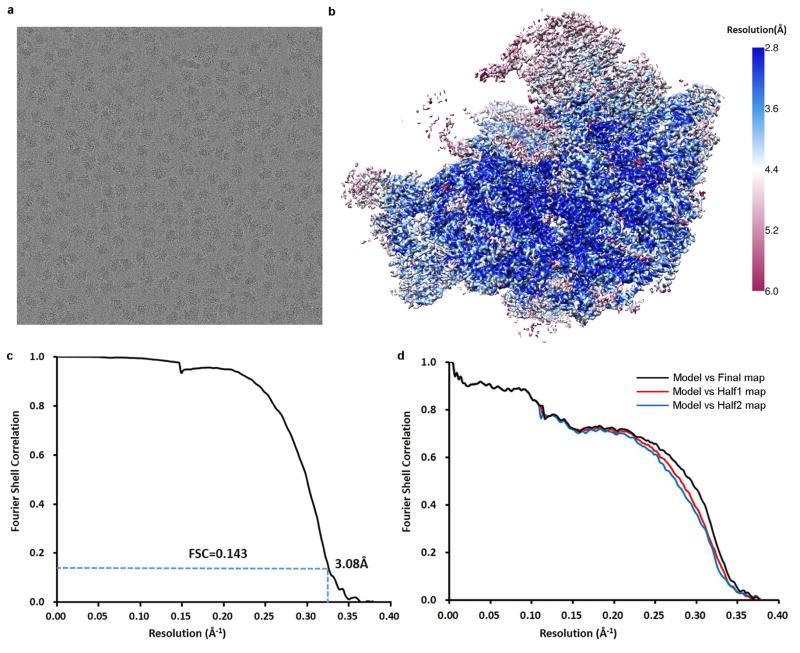
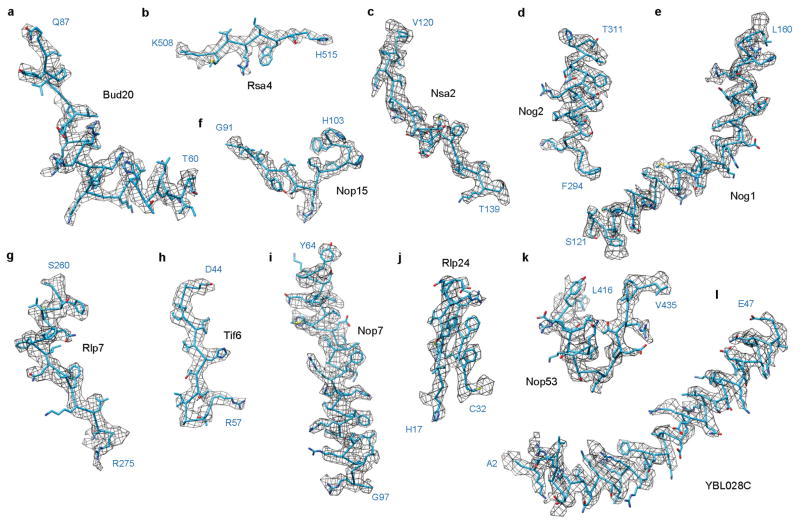
To further explore the mechanism of late nuclear steps in pre-60S assembly, we characterized structures of native nucleoplasmic particles isolated from Saccharomyces cerevisiae, using epitope-tagged assembly factor Nog2 (Extended Data Fig. 1a). These Nog2-particles were subjected to cryo-electron microscopy (cryo-EM) (Extended Data Table 1) to determine a series of structures (hereafter termed states 1–3) (Extended Data Fig. 2), presumably reflecting temporally related snapshots of final maturation steps of pre-60S particles before nuclear export. One of these structures, state 1, was solved at a nominal resolution of 3.08 Å (Extended Data Fig. 3b, c and Supplementary Video 1). We identified over 30 assembly factors in Nog2-particles (Extended Data Fig. 1b). Guided by chemical cross-linking of proteins coupled with mass spectrometry (XL–MS) (Supplementary Table 1), we were able to build atomic models for 19 of these assembly factors in the density map of state 1 (Fig. 1 and Extended Data Fig. 4). Intriguingly, 14 of them are located in the arc region of the central protuberance–polypeptide tunnel exit on the intersubunit surface (Fig. 1a), and five are immediately adjacent or bound to ITS2 (Fig. 1a). In addition, we also located Sda1, Rea1 and the Rix1 subcomplex14 in the map of state 2.
Figure 1. Cryo-EM structure (state 1) of the pre-60S particle purified from epitope-tagged Nog2.
a, The 3.08-Å cryo-EM map of state 1 is displayed in surface representation, with density of each assembly factor separately coloured. The 25S rRNA and r-proteins are coloured grey and beige, respectively. Both the intersubunit (left) and side (right) views are shown. b, Atomic models of 19 well-resolved assembly factors (coloured as in a) superimposed with their segmented cryo-EM densities (transparent grey).
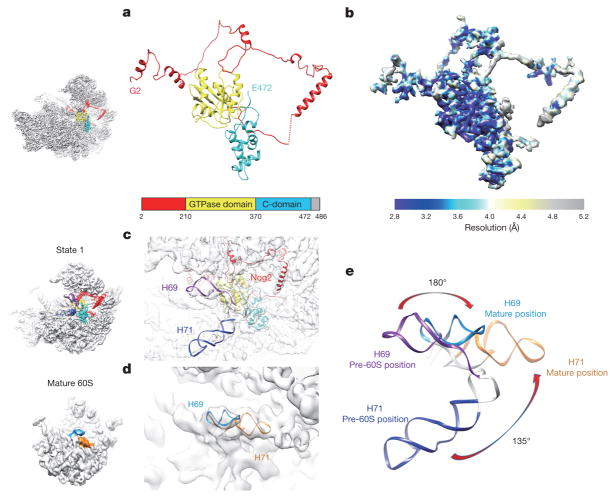
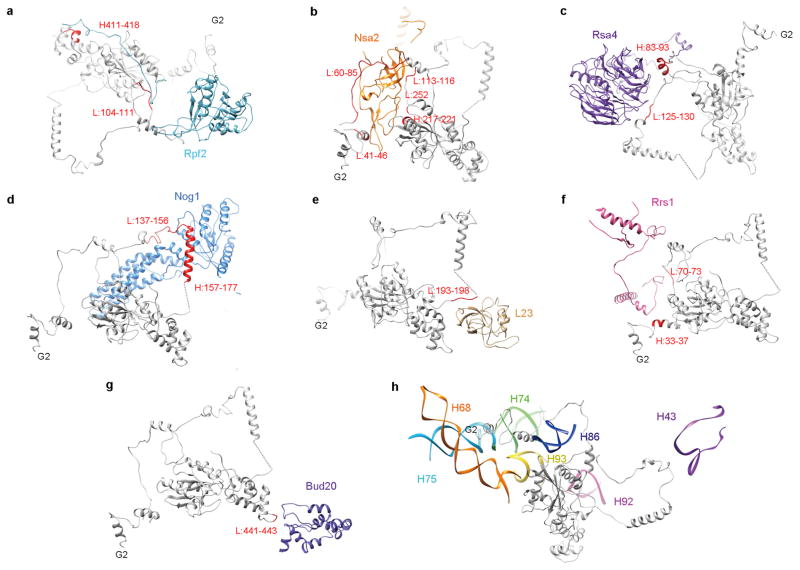
Nog2 binds at the centre of the pre-60S particle, via interaction of its GTPase domain and carboxy (C)-terminal domain with a multi-helical junction (Fig. 2), making extensive contacts with H93, H62, H64, H67, H69 and H71 of 25S ribosomal RNA (rRNA), and Bud20 (Extended Data Fig. 5g). This interaction stabilizes H69 and H71 in a nearly 180°-flipped position (Fig. 2c–e) compared with their mature forms17. In addition, the C-terminal extended loop of Rpf2 (residues 275–300) is inserted into the interface of Nog2–GTPase domain–C-terminal domain and H69–H71 (Extended Data Fig. 5a), also contributing to the displacement of H69–H71. Unexpectedly, the amino (N)-terminal extension of Nog2 (residues 1–200) lacks tertiary structures (Fig. 2a). Instead, in its fully extended form, the N-terminal extension of Nog2 wanders around the inner surface of the tRNA passageway on the pre-60S particle and interacts with multiple components, including H92, L23, Nog1, H43, Rsa4, Nsa2, Rpf2, Rrs1 and H86 (Extended Data Fig. 5). The very N terminus of Nog2 ends at a helical junction composed of H68, H74, H75 and H93 (Extended Data Fig. 5h). These observations nicely explain the previous model that Nog2 represents a converging node for different assembly branches and that its recruitment requires the prior association of multiple assembly factors18,19.
Figure 2. Structure of Nog2 and its remodelling role in central helices H69–H71.
a, Atomic structure of Nog2 (2–472 amino acids) with domains separately coloured, highlighting the N-terminal extension of Nog2. The orientation of Nog2 in the pre-60S particle is shown in the left thumbnail. b, Local resolution map of Nog2. Segmented Nog2 density map is coloured according to the scale bar below. c, Zoom-in view of the H69–H71 region in the map of state 1, superimposed with atomic models of Nog2, H69 and H71. d, Same as c, but for the density map of the mature 60S subunit. e, Comparison of H69–H71 in the two density maps.
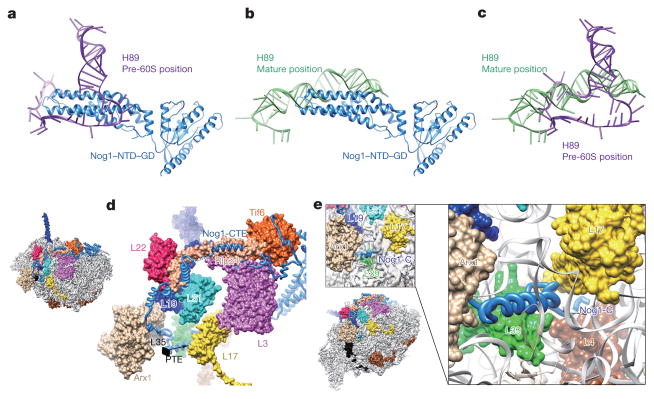
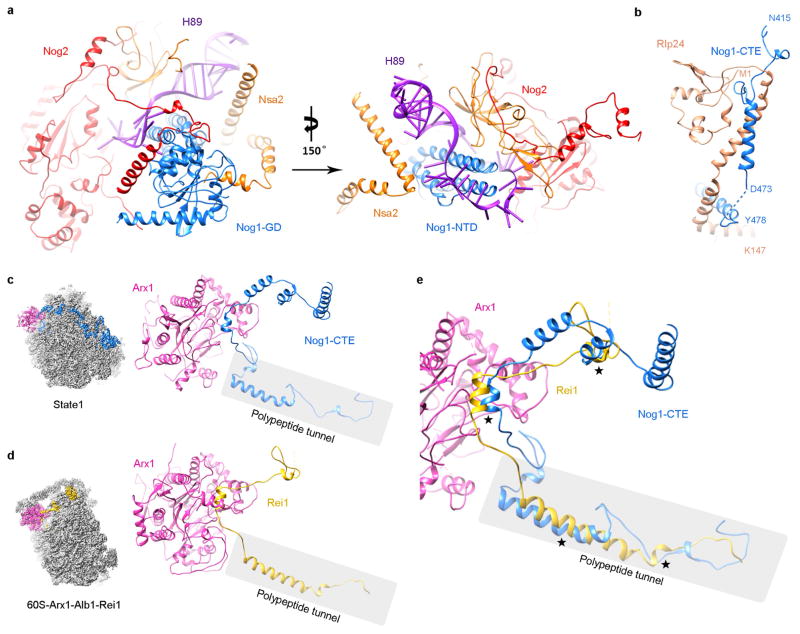
Our structures also reveal potential functions for the GTPase Nog1, which docks to a similar position in the pre-60S particle as its homologue ObgE does in bacterial large ribosomal subunits20, with its N-terminal four-helical-bundle domain (NTD) pointing to the peptidyl transferase centre (Fig. 3a). Interestingly, the NTD of Nog1 directly passes through H89, separating it into two strands (Fig. 3a–c). Besides rRNA, the GTPase domain and NTD of Nog1 also interact with Nog2 and Nsa2, respectively (Extended Data Fig. 6a). The C-terminal extension (CTE) of Nog1, similar to the N-terminal extension of Nog2, wraps around the pre-60S particle by over one-quarter of its circumference. On its way from the P0 stalk base to the polypeptide tunnel exit, the CTE of Nog1 makes extensive contacts with nearly all of the assembly factors and r-proteins in this arc region (Tif6, Rlp24, Arx1, L3, L31, L22, L19, L35) (Fig. 3d) and with a variety of rRNA helices. The spatial relationship of Nog1 with these assembly factors agrees well with the previous model for ordered recruitment and release of assembly factors during cytoplasmic maturation of pre-60S particles1. In particular, the CTE of Nog1 interlocks with Rlp24 by wrapping around a long helix (residues 85–130) at the C-terminal end of Rlp24 (Fig. 3d and Extended Data Fig. 6b), suggesting that these two assembly factors might be recruited and released as a subcomplex7. Indeed, the release of Nog1 and replacement of Rlp24 with L24 in the cytoplasm is catalysed by the ATPase Drg1 (refs 21, 22). Surprisingly, at the polypeptide tunnel exit, the CTE of Nog1 turns into the polypeptide tunnel, extending all the way through the tunnel to the peptidyl transferase centre (Fig. 3e). It is tempting to hypothesize that this C terminus of Nog1 (~75 residues) might enable polypeptide exit tunnel assembly, and/or test-drive the tunnel by surveying the conformational status of tunnel wall components (such as L39, L17 and L4). Altogether, our data suggest several distinct roles for Nog1 in the maturation of pre-60S particles. While the NTD might serve to remodel the peptidyl transferase centre, the CTE of Nog1 apparently acts as a scaffold for assembly of many assembly factors and r-proteins, and might participate in quality control of polypeptide tunnel construction. Notably, a recent study showed that the tunnel is again probed in the cytoplasm by Rei1 (ref. 16) in a similar fashion as the CTE of Nog1 does (Extended Data Fig. 6c, d), indicating the existence of continuous proofreading of the ribosomal tunnel from the nucleolus to the cytoplasm.
Figure 3. Structure and binding partners of Nog1.
a, The NTD of Nog1 inserts directly into the two strands of H89. GD, GTPase domain. b, Superimposition of the NTD of Nog1 with H89 in its mature conformation, displaying a steric clash in the terminal tip of the NTD of Nog1. c, Structural comparison of H89 in the pre-60S and mature conformations. d, The CTE of Nog1 interacts with multiple assembly factors (Tif6, Rlp24, Arx1) and r-proteins (L3, L31, L22, L19, L35) in an arc region of the pre-60S particle. The overview is shown in the left thumbnail. The position and direction of polypeptide tunnel exit is denoted by a black diamond. e, The last C-terminal portion of Nog1 goes into the polypeptide tunnel and interacts with L4, L17, and L39 (see also Extended Data Fig. 6).
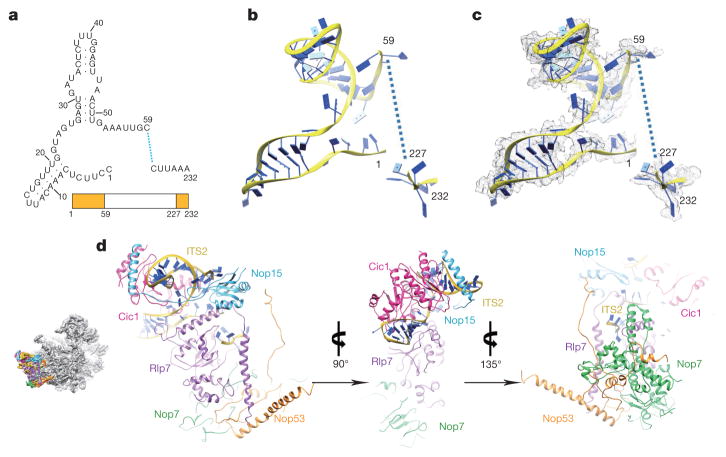
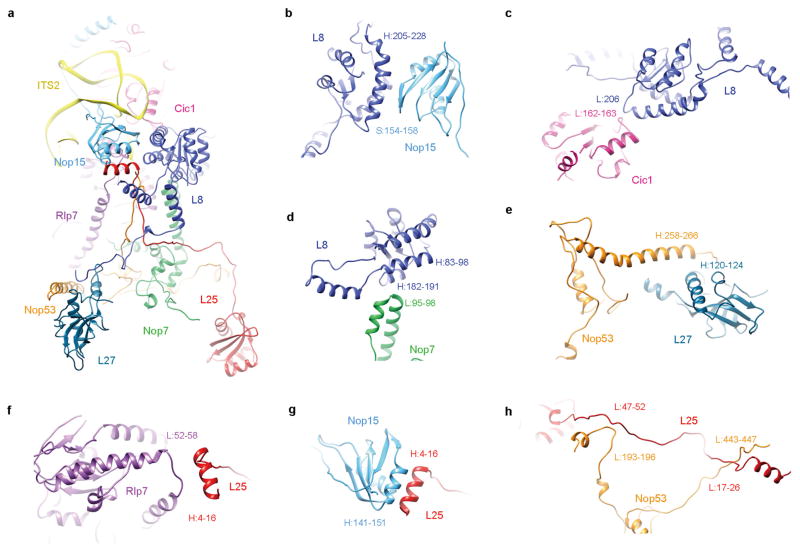
In the map of state 1, a portion of the ITS2 pre-rRNA spacer is well resolved. This includes 59 nucleotides extending from the 3′-end of 5.8S rRNA, and 6 nucleotides of ITS2 at the 5′-end of 25S rRNA (Fig. 4a–c), consistent with the presence of 25.5S and 7S pre-rRNAs in Nog2-particles5. In addition to known ITS2-binding factors Nop15, Rlp7 and Cic1 (ref. 23), we also identified Nop7 and Nop53 (ref. 24) in the region of ITS2 (Fig. 4d). This close co-localization of Nop15, Rlp7, Cic1, and Nop7 around ITS2 explains their mutually interdependent association with pre-60S particles1. Notably, Nop53 is required to recruit Mtr4 which participates in exosome-mediated ITS2 removal8,25. Three r-proteins, L8, L25 and L27, also interact with these ITS2 factors (Extended Data Fig. 7). L8 directly contacts Nop15, Cic1 and Nop7 (Extended Data Fig. 7a–d), complementing previous data that L8 is required for the assembly of these A3 factors26. The high protein content in the ITS2 region further suggests that these factors function to chaperone and protect ITS2 for proper processing. Given the space required for progressive trimming of 7S pre-rRNA from its 3′-end by the exosome and other nucleases27,28, it is conceivable that de-coating of assembly factors from ITS2 is coordinated with stepwise removal of ITS2. The de-coating process has to be accurately controlled, as depletion of A3 factors leads to rapid turnover of pre-rRNAs (reviewed in ref. 1).
Figure 4. Structure of ITS2 and associated factors.
a, Secondary structure of the partial ITS2 rRNA sequences resolved in the map of state 1. b, Atomic model of the partial ITS2 rRNA. c, Same as b, with density map superimposed. d, Three consecutively rotated views of ITS2 and associated factors. The orientation of the ITS2 subcomplex in the density map of state 1 is shown in the leftmost thumbnail.
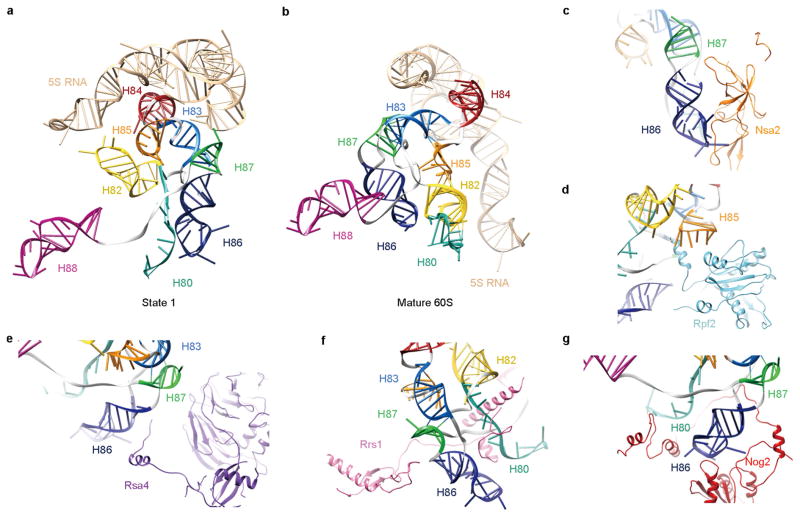
In the structure of state 1, the 5S RNP (the subcomplex of 5S rRNA, L5 and L11) is positioned almost 180°-rotated from its position in the mature subunit, as previously reported6,11. Two central-protuberance-binding factors, Rpf2 and Rrs1, which anchor the 5S RNP to the pre-60S particles in an earlier stage13,29, are apparently crucial to maintain this distinct conformation of the 5S RNP, as they provide a support to the floating helical stem of the 5S RNP in the middle (Fig. 1a). In addition, rRNA helices of the central protuberance, stabilized by several interacting factors (Rpf2, Rrs1, Nsa2, Rsa4 and Nog2), display radically different conformations compared with those in the mature 60S subunit (Extended Data Fig. 8). Many of them are in completely topside-down or inside-out positions (Extended Data Fig. 8a). The most dramatic change is that H80 is stretched into a single strand.
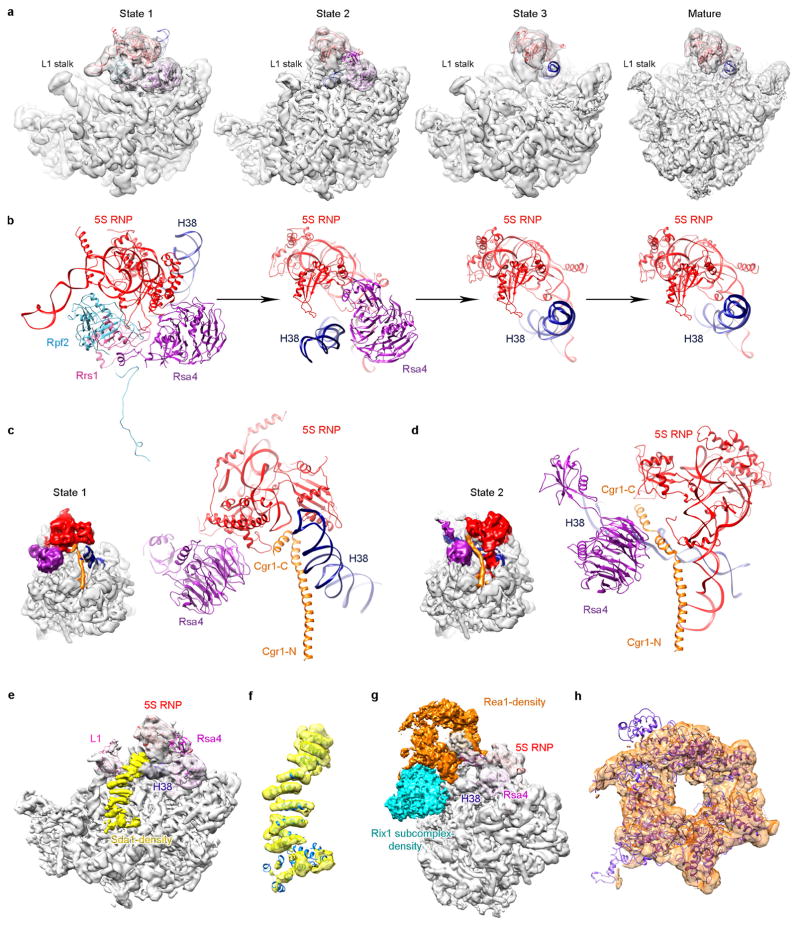
Comparison of the three states (1–3) indicates that the 5S RNP is in a different position in each state, reflecting snapshots of continuous rotational movement of the central protuberance (Extended Data Fig. 9a, b). In the structure of state 2, Rpf2 and Rrs1 are absent, and the 5S RNP has already rotated to a near-mature position, suggesting that removal of Rpf2 and Rrs1 is necessary for the rotation to occur. The structure of state 2 (~6.6 Å resolution) is very similar to that of the recently characterized Rix1–Rea1 particles14, containing five additional factors (Extended Data Fig. 9e–h): Sda1, Rix subcomplex (Ipi1, Rix1 and Ipi3), and Rea1. Sda1, with its characteristic HEAT (huntingtin, elongation factor 3, protein phosphatase 2A and lipid kinase TOR) repeat domain sandwiched between the L1 stalk and H38, pulls the L1 stalk into an inward position (Extended Data Fig. 9e, f). The Rix1 subcomplex sits above Sda1, contacting the gigantic remodelling ATPase Rea1 situated above the central protuberance14 (Extended Data Fig. 9g, h). Therefore, removal of Rpf2–Rrs1 might lead to binding of Sda1 and the Rix1 subcomplex, as well as Rea1 that subsequently releases Rsa4 (ref. 30). This last remodelling event enables further accommodation of the 5S RNP in the mature-like position observed in the structure of state 3. Notably, the stepwise conformational maturation of the 5S RNP is coordinated with sequential conformational changes of H38 in the three structures. Interestingly, repositioning of H38 from state 1 to state 2 involves the conformational change of the C terminus of Cgr1, from a bent helix to a straightened form (Extended Data Fig. 9c, d).
In summary, the rich atomic information presented in our structures provides a valuable resource to interpret and integrate a large body of existing genetic and biochemical data of eukaryotic ribosome assembly. In particular, it demonstrates potential diverse roles of assembly factors in late nuclear stages of large subunit assembly, and reveals unprecedented mechanistic details for two essential assembly GTPases, Nog1 and Nog2.
METHODS
No statistical methods were used to predetermine sample size. The experiments were not randomized. The investigators were not blinded to allocation during experiments and outcome assessment.
Purification of Nog2-particles
Pre-ribosomes were purified by tandem affinity purification (TAP) with magnetic Dynabeads (Invitrogen) as explained previously31. TAP-tagged Nsa1, Nog2 and Nmd3 were used as baits to isolate ribosome assembly intermediates. The protein composition of the TAP-purified pre-ribosomes was determined by SDS–PAGE (4–10% Tris-glycine and 4–12% Bis-Tris, Invitrogen) followed by silver-staining31. Protein levels in each intermediate were assayed by western blotting analysis. Furthermore, the proteins associated with each intermediate were identified by mass spectrometry. Purified samples were sent to Penn State Hershey Core Research Facilities for trypsin digestion and matrix-assisted laser desorption/ionization–time of flight analysis. Results were analysed by Protein Pilot software and proteins identified with >99.9% confidence were used for further analysis.
XL–MS analysis
The Nog2-particles containing ~10 μg total proteins were incubated with BS3 or DSS at 1:1 (w/w) protein-to-cross-linker ratio at 25 °C for 1 h before the cross-linking reaction was quenched with 20 mM ammonium bicarbonate. Proteins were then precipitated with acetone, dissolved in 20 μl 8 M urea, 100 mM Tris, pH 8.5, and digested with trypsin at 37 °C overnight. Liquid chromatography–tandem mass spectrometry (LC–MS/MS) analyses of the digested samples were performed on an EASY-nLC 1000 system (Thermo Fisher Scientific) interfaced to a Q-Exactive mass spectrometer (Thermo Fisher Scientific). Peptides were separated on a 75 μm × 10 cm analytical column packed with 1.8 μm, 120 Å UHPLC-XB-C18 resin (Welch Materials) over a 110-min linear gradient made with buffer A (0.1% formic acid in HPLC-grade water) and buffer B (0.1% formic acid in HPLC-grade acetonitrile) as follows: 0–3 min, 0–5% B; 3–93 min, 5–30% B; 93–100 min, 30–80% B; 100–110 min, 80% B. The flow rate was set to 200 nl min−1. The mass spectrometer was operated in data-dependent mode with one MS1 event at resolution 70,000 followed by ten HCD MS2 events at resolution 17,500. Dynamic exclusion time was set to 60 s. Precursors with a charge state of +1, +2 or unassigned were rejected. Three analytical replicates were performed for both BS3- and DSS-cross-linked samples. To identify proteins in the sample, we performed an additional LC–MS/MS analysis without rejecting precursors of +2 charge state, and the MS data were then searched against an S. cerevisiae protein database using ProLuCID32. After filtering the ProLuCID search results using DTASelect233, 264 proteins were identified (false discovery rate for protein identity = 0.46%) and a database containing the sequences of these proteins was constructed for pLink search. Cross-linked peptides were identified using this database and the pLink software34, and the results were filtered by requiring false discovery rate < 0.05, E value < 0.0001, and spectral count ≥ 2, which resulted in identification of 282 cross-linked peptide pairs (Supplementary Table 1). Results of XL–MS analysis, including information for peptide pair, statistical significance (E value), calculated mass, resolution (Δmass) and mass accuracy (parts per million), are summarized in Supplementary Table 2. The XL–MS data have been deposited in the ProteomeXchange Consortium under data set identifier PXD003736, which contains one SEARCH file (pLink search result, false discovery rate < 0.05), seven PEAK files (ms2 files) and seven RAW files.
Cryo-EM data acquisition
Vitrified specimens were prepared by adding 4-μl samples of Nog2-particles at a concentration of ~150 nM to a glow-discharged holey carbon grid (Quantifoil R2/2) covered with a freshly made thin carbon film. Grids were blotted for 1 s and plunge-frozen into liquid ethane using an FEI Vitrobot Mark IV (4 °C and 100% humidity). Cryo-grids were transferred to an FEI Titan Krios electron microscope that was operating at 300 kV, and images were recorded using a K2 Summit direct electron detector (Gatan) in counting mode at a nominal magnification of ×22,500, corresponding to a pixel size of 1.32 Å at the object scale and with the defocus varying from −1.0 to −2.0 μm. All micrographs with K2 camera were collected using UCSF Image4 (developed by X. Li and Y. Cheng) under low-dose conditions. Each micrograph was dose-fractionated to 32 frames with a dose rate of ~8.2 counts per physical pixel per second for a total exposure time of 8 s. A fraction of micrographs were also recorded using Titan Krios (FEI) microscope operated at 300 kV under low-dose conditions with an FEI eagle 4k × 4k CCD camera, using an automated data collection software AutoEMation35.
Image processing
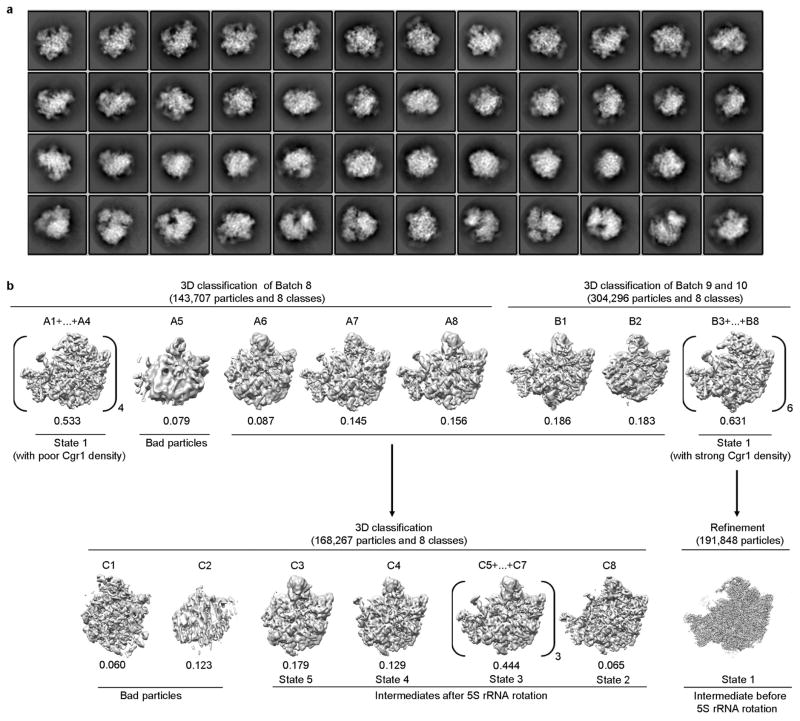
Original image stacks were summed and corrected for drift and beam-induced motion at micrograph level using MOTIONCORR (developed by X. Li and Y. Cheng)36. Programs of SPIDER37 and EMAN2 (ref. 38) were used for micrograph screening, automatic particle picking and normalization. The contrast transfer function parameters of each micrograph were estimated by CTFFIND3 (ref. 39). All 2D and 3D classification and refinement were performed with RELION40. Two-dimensional reference-free classification was applied to further screen particles (Extended Data Fig. 2a). At first, four batches of data were collected (Extended Data Table 1) and processed separately following the same procedures. For each batch, particles were split into ten classes during the first round of 3D classification, with a map of the mature 60S ribosomal subunit (low-pass filtered to 60 Å) as the initial model. Bases on the map features (the presence of ITS2 and the rotation of the 5S RNP), classes were combined and subjected the second and third rounds of 3D classification. Around 30% particles in the first four batches belong to state 1 (solid densities for ITS2 and the 5S RNP in a premature unrotated position). However, for the first four batches of data, particles displayed a strong orientation preference, which led to a noticeable distortion in the final density maps. Although the nominal resolutions of these maps were in the range of 3.8–4.5 Å, the distortion prevented accurate atomic modelling. To limit those strongly over-represented angular projections, SPIDER and RELION were used to balance the particles within different projection groups (by limiting the maximal number of particles for each projection group) during 3D refinement. Nevertheless, this additional procedure improved the map appearance to a certain extent, but could not completely eliminate the distortion in the final density maps. Another attempt was performed by combining the first four batches of data before 2D and 3D classification. All particles from the first four batches that belonged to state 1 were grouped together and subjected to 3D refinement with orientation-limiting procedure applied. However, the orientation preference still limited the high-resolution refinement and atomic modelling. Therefore, a series of optimizations in cryo-grid preparation were applied before the collection of the fifth data set, including elevated sample concentration, prolonged glow-discharge time, and reduced blotting time. As a result, there was no detectable orientation preference in the fifth data set (batch 8 in Extended Data Table 1a). For this batch of data, ~184,222 raw particles were picked from 833 micrographs for several rounds of reference-free 2D classification, yielding 143,707 good particles for 3D classification. A map of state 1 (low-pass filtered to 60 Å) was used as the initial reference for the 3D classification, which split the particles into eight classes (Extended Data Fig. 2b). One (A5) of the eight classes (8% of total particles) were discarded. Four of them belonged to state 1. The rest of these classes represented a series of intermediate structures. Another two batches of cryo-EM data were obtained (batches 9 and 10 in Extended Data Table 1a), which resulted in 304,296 particles for 3D classification into eight classes (B1–B8) (Extended Data Fig. 2b). Six of them (B3–B8) belonged to state 1, and as a result, they were combined for further high-resolution structural refinement. Comparison of state 1 structures from batch 8 and batch 9–10 indicates that the quality of last two batches of particles was slightly better, according to the density appearance of Cgr1 in the density map. Therefore, a homogeneous data subset (191,848 particles) for state 1 was obtained (B3–B8), from which a density map with 3.8-Å resolution (gold-standard Fourier shell correlation (FSC) 0.143 criteria) was constructed. To reduce the possible radiation damage to the particles, only frames 3–16 of each image stack were selected to generate a set of dose-reduced micrographs. A new set of particles were re-windowed from dose-reduced micrographs and subjected to 3D refinement, which improved the resolution to 3.6 Å. A soft-edged mask was then applied during final rounds of the high-resolution refinement, further improving the resolution to 3.46 Å. The final density map was corrected for the modulation transfer function of K2 detector, sharpened by applying a negative B-factor automatically estimated by post-processing program of RELION, and corrected for the soft-masked induced effects on FSC curves using high-resolution noise substitution41, resulting in a 3.08-Å density map for state 1. The local resolution map was estimated using ResMap42.
To further improve the density map of state 2, all non-state 1 particles from batches 8, 9 and 10 were combined (168,267 particles in total) and subjected to a round of 3D classification (Extended Data Fig. 2b) into eight classes. Around 6.5% of particles (10,900) belonged to state 2 (C8), and refinement of these particles rendered a final density map at a nominal resolution of 6.6 Å.
Model building and refinement
Crystal structure of the yeast 80S ribosome (PDB accession number 3U5D)17 was used as the initial template for rRNA modelling. The models of the rRNAs (25S, 5.8S) were docked into the density map manually using UCSF Chimera43. The 5S rRNA was separately fitted into its density by rigid-body docking. The crystal structure of the 25S rRNA was compared with that of the Arx1-TAP pre-60S structure (PDB accession number 3J64)6 in the density map, and fragments of nucleotides 995–1054, 2244–2318, 2615–2771 and 2789–2804 of the crystal structure were cut out and fitted into our density map. After the initial fitting, the entire chains of rRNAs were manually checked and adjusted with COOT44.
For modelling of ITS2 RNA, secondary structures were predicted using RNAfold45 and drawn using RnaViz46. Atomic modelling of ITS2 RNA was performed with COOT, started with a poly-adenine model, followed by sequence replacement.
For r-protein modelling, structures of individual proteins from the crystal structure of yeast 80S ribosome (PDB accession number 3U5E)17 were separately fitted into the density map using Chimera. Except for L10, L24, L29, L40, L41 and L42, which are absent in the density map of Nog2-particles, chains of the remaining r-proteins were manually adjusted using COOT. Structures of L5 and L11 were first docked into the density map in a subcomplex with the 5S rRNA, followed by a similar manual adjustment in COOT.
For modelling of biogenesis factors, the sequences of all factors according to the result of mass spectrometry (Extended Data Fig. 1b) were subjected to 2D and 3D structure prediction, using PSIPRED47 and I-TASSER48, respectively. Initial fitting of biogenesis factors, such as Nog2, Nop15, Rlp7, Nop7 and Cic1, was guided by previous biochemical data and our XL–MS data, and was confirmed by high agreement of secondary structural features between the predicted 3D models and the density map. Specifically, for each factor, the five 3D models predicted by I-TASSER were aligned in PYMOL49, and the common structural motifs were selected and used for rigid body fitting in Chimera. Taking Nog2 as an example, the GTPase domain (residues 207–369) and the C-terminal domain (residues 373–486) were first separately fitted into Chimera, followed by manual adjustment of main chains and side chains in COOT. Linker building and further extension of chains in both the N- and C-directions were done manually in COOT. Information from secondary structural predication was used to aid main-chain tracing. In many cases, poly-alanine models were first built, and sequence assignments were aided by well-resolved bulky residues such as Phe, Tyr, Trp and Arg. As for factors Nog1, Rlp24, Rsa4, Arx1 and Mrt4, the initial positions of them were taken from a previous low-resolution cryo-EM studies6,10, followed by extensive model rebuilding in COOT. In particular, main-chain tracing of the C-terminal extension of Nog1 was done completely manually. For factors Rpf2 and Rrs1, their S. cerevisiae models were generated using CHAINSAW50 in the CCP4 suite51 with the crystal structures of Aspergillus nidulans Rpf2 and Rrs1 (PDB accession number 4XD9 and 5BY8)12,52 as templates. The crystal structure of the yeast Tif6 (PDB accession number 1G62)53 was docked into the density map to provide an initial position. The modelling of the factors in the ITS2 region was largely facilitated by our XL–MS data, as some portions of these factors were not resolved in the map. The modelling of Nsa2 was facilitated by the crystal structure of Rsa4 in complex with Nsa2 peptide (PDB accession number 4WJV)54, which provided an anchor point for the N- and C-terminal halves of Nsa2 during atomic modelling.
Docking of Sda1 and Rea1 in the density map of state 2 was facilitated by the recent cryo-EM study of Rix1–Rea1 particles14. The models of Sda1 and Rea1 (PDB accession number 5FL8)14 were fitted into our density map of state 2 as rigid bodies (Extended Data Fig. 9e–h).
The atomic model of state 1 containing ribosomal proteins, rRNAs and assembly factors was refined against the density map first by real-space refinement (phenix.real_space_refine)55 in PHENIX56 with secondary structure and geometry constraints applied. After refinement, alternating rounds of manual model adjustment using COOT and model refinement using PHENIX were applied. A final round of model refinement was done in Fourier space using REFMAC57 with secondary structure, base pair and planarity restraints applied, according to previously established protocols58. To avoid overfitting, different weights of the density map for refinement were tested. Cross-validation against overfitting was performed following the procedures previously described58,59. The atom positions of the atomic model were randomly displaced by 0.5 Å before the model was refined against a map reconstructed from half of the data (named Half1 map) produced by RELION during the last iteration of high-resolution structural refinement. And two FSC curves were calculated on the basis of refined model: one was FSCwork (model versus Half1 map) and the other was FSCtest (model versus Half2 map). In addition, another FSC curve was calculated for the comparison of refined model with final density map. Comparison of FSCtest and FSCwork curves showed no large separation between them, indicating the final atomic model was not overfitted. Statistics of final model was evaluated using MolProbity60 (Extended Data Table 1b).
Of the 282 cross-linked peptide pairs identified in the XL–MS data, the distances of 151 lysine pairs could be calculated from the model of state 1. Ninety-four per cent of them (142) agree with the model with the Cα–Cα distances ≤ 24 Å between two cross-linked lysine residues. Among the incompatible nine pairs, five of them are with the Cα–Cα distances ≤ 30 Å.
Extended Data
Extended Data Figure 1. Compositional analysis of Nsa1, Nog2 and Nmd3 particles.
a, Mostly non-overlapping assembly factors Nsa1, Nog2 and Nmd3 were used to purify sequential ribosome assembly intermediates. Proteins identified by mass spectrometry analysis were marked on the gel. Orange coloured proteins are only present in Nsa1-TAP particles, green coloured proteins are present both in Nsa1-TAP and in Nog2-TAP particles, light blue coloured proteins are present in all three purified particles to varying levels, dark blue coloured proteins are present only in Nog2-particles, pink coloured proteins are present both in Nog2- and Nmd3-particles in varying levels and yellow coloured proteins are present only in Nmd3-particles. TAP-tagged proteins are indicated by white asterisks. For gel source data, see Supplementary Fig. 1. b, The lifetimes of mostly non-overlapping ribosome assembly intermediates containing assembly factors Nsa1, Nog2 and Nmd3 are indicated. Assembly factors identified in each of Nsa1-TAP, Nog2-TAP and Nmd3-TAP associated samples were colour coded. The colour scheme is identical to that used in a. *Even though this protein was identified in all three intermediates, its levels decreased more than sevenfold from Nsa1-TAP particles to Nog2-TAP particles.
Extended Data Figure 2. Cryo-EM data processing of Nog2-particles.
a, Representative 2D class averages of Nog2-particles. b, A flow-chart for 3D classification of Nog2-particles (data batch 8–10, see Methods for details).
Extended Data Figure 3. Resolution estimation and model validation.
a, Representative micrograph of Nog2-particles. b, Local resolution map of the final density map of state 1. c, FSC curve for the final density map (state 1). The nominal resolution is 3.08 Å estimated using the gold-standard (FSC = 0.143) criterion. d, Atomic model cross-validation. Three FSC curves were calculated between the refined model (against Half1 map) and the final map (black), between the refined model with Half1 map (FSCwork, red), and between the refined model with Half2 map (FSCtest, blue) (see Methods for details).
Extended Data Figure 4. Local densities of representative regions for different assembly factors.
a–l, Cryo-EM densities of representative regions of assembly factors, superimposed with respective atomic models.
Extended Data Figure 5. Interaction network of Nog2 in the pre-60S particle.
a–g, Pairwise illustration of binding partners of Nog2 in the pre-60S particle. Residues of Nog2 involved in atomic contacts are coloured red with residue numbers labelled. H and L denote helix and loop, respectively. h, Interactions between rRNA components (H43, H68, H74, H75, H86, H92, H93) and Nog2. For clarification, H69 and H71 are not shown. The N terminus of Nog2 is located in a helical junction composed of H68, H74, H75 and H93.
Extended Data Figure 6. The NTD of Nog1 interacts with Nsa2 and Nog2.
a, Nsa2, Nog2 and Nog1 collectively stabilize H89 in a distinct conformation. Nog1 interacts with Nog2 and Nsa2 through its GTPase domain and NTD, respectively. b, The CTE of Nog1 interlocks with Rlp24 by wrapping around a long helix at the C-terminal end of Rlp24 (see also Fig. 3). c, d, Comparison of the CTE of Nog1 and the CTE of Rei1 in the polypeptide tunnel. Atomic models of state 1 (c) and 60S-Arx1–Alb1–Rei1 (d) (PDB accession number 5APN)16 are aligned using the 60S subunit. For clarification, only Arx1, Nog1 and Rei1 are shown. e, Superimposition of c and d. Four major places of steric clash between Rei1 and Nog1 are marked by asterisks.
Extended Data Figure 7. Mutual interactions between factors and r-proteins in the ITS2 subcomplex.
a, An overall view of the ITS2 subcomplex. b–d, L8 interacts with three factors: Nop15 (b), Cic1 (c) and Nop7 (d). e, L27 interacts with Nop53. f–h, L25 interacts with Rlp7 (f), Nop15 (g) and Nop53 (h). Residues involved in atomic interaction sites are labelled with sequence numbers. H, L, S denote helix, loop and strand of respective structures.
Extended Data Figure 8. Restructuring of rRNA helices in the central protuberance region by Nsa2, Rpf2, Rsa4, Rrs1 and Nog2.
a, Conformation of rRNA helices from the central protuberance (H80, H82-H88, 5S rRNA) in the pre-60S particle (state 1). b, Same as a, but for the mature 60S subunit. The mature 60S subunit was aligned to state 1 structure globally. c–g, Pairwise interactions between the central protuberance helices and factors are shown in separate panels.
Extended Data Figure 9. Structures of different assembly states of the pre-60S ribosomal particles.
a, Cryo-EM density maps of three premature states (1–3) and the mature state are displayed in transparent surface representation, superimposed with models of the 5S RNA, H38 and associated central-protuberance-binding factors. b, Zoom-in views of the central protuberance regions in a. For clarification, only atomic models are shown. Comparison of these four states indicates that the 5S RNP rotates to a near-mature state (state 2) after Rpf2–Rrs1 leave, and further release of Rsa4 in state 3 results in a ‘mature-like’ conformation for the 5S RNP. H38 from these four states is in a series of continuous changes coupled with the 5S RNP conformational maturation. c, d, Spatial relationship of the 5S RNP, H38, Rsa4 and Cgr1 in state 1 (c) and state 2 (d). Note that repositioning of H38 from state 1 to state 2 is coupled with a dramatic conformational change on the C-terminal end of Cgr1. e–h, Additional assembly factors identified in the density map of state 2. One piece of additional density between H38 and L1 contains a characteristic HEAT repeat, which contacts the L1 stalk in an inward position (e). The atomic model of Sda1 (PDB accession number 5FL8)14 fits well with the segmented density (f). For clarification, densities immediately above Sda1 are not shown in e and f. A large piece of additional density in the map of state 2, composed of the Rix1 subcomplex and Rea1 (g, h). The density assignment was facilitated by the cryo-EM structure of Rix1–Rea1 particles14. Superimposition of the atomic model of Rea1 (PDB accession number 5FL8)14 with the segmented density map of Rea1 (h).
Extended Data Table 1.
Statistics of data collection, structural refinement and model validation
| Batches | Electron Microscope | Camera | Micrographs (Original micrographs) | Particles for 2D classification | Particles for 3D classification |
|---|---|---|---|---|---|
| 1 | F20 | US4000 | 381(966) | 76,323 | 19,253 |
| 2 | Titan Krios | Eagle | 3,184(4,701) | 154,785 | 133,455 |
| 3 | Titan Krios | K2 | 1,017(1,136) | 90,888 | 35,096 |
| 4 | Titan Krios | K2 | 1,497(1,579) | 200,292 | 100,956 |
| 5 | Titan Krios | K2 | 997(1,002) | 128,515 | 54,574 |
| 6 | Titan Krios | K2 | 1,114(1,114) | 139,309 | 54,257 |
| 7 | Titan Krios | K2 | 1,014(1,016) | 134,937 | 50,334 |
| 8 | Titan Krios | K2 | 833(852) | 184,222 | 143,707 |
| 9 | Titan Krios | K2 | 901(901) | 225,167 | 146,349 |
| 10 | Titan Krios | K2 | 1,019(1019) | 248,518 | 157,947 |
| Data Collection | |
| EM equipment | FEI Titan krios |
| Voltage (kV) | 300 |
| Detector | Gatan K2 |
| Particles | 191,848 |
| Pixel size (Å) | 1.32 |
| Defocus range (μm) | 1.0–2.0 |
| Electron dose (e−/Å2) | 50 (32 frames)/22 (frame 3–16) |
| Model composition | |
| Peptide chains | 54 |
| Protein residues | 13,982 |
| RNA chains | 3 |
| RNA bases | 3,446 |
| Refinement | |
| Resolution (Å) | 3.08 |
| Map sharpening B-factor (Å2) | −65 |
| R factor | 0.3040 |
| Fourier Shell Correlation | 0.7814 |
| Rms deviations | |
| Bonds (Å) | 0.0054 |
| Angels(°) | 0.9687 |
| Validation (proteins) | |
| Molprobity score | 2.43 (96th percentile) |
| Clashscore, all atoms | 3.44 (100th percentile) |
| Good rotamers (%) | 80.87 |
| Ramachandran plot | |
| Favored (%) | 88.14 |
| Outliers (%) | 3.46 |
| Validation (RNA) | |
| Correct sugar puckers (%) | 97.16 |
| Good backbone conformations (%) | 71.60 |
Acknowledgments
We thank the National Center for Protein Sciences (Beijing, China) for providing resource for cryo-EM data collection and computation. We also thank members of Woolford laboratory for reading the manuscript. This work was supported by the Ministry of Science and Technology of China (2013CB910404 to N.G. and 2014CB849800 to M.-Q.D.), the National Natural Science Foundation of China (31422016 and 31470722 to N.G., and 21375010 to M.-Q.D.) and National Institutes of Health grant R01GM028301 (to J.L.W.).
Footnotes
Online Content Methods, along with any additional Extended Data display items and Source Data, are available in the online version of the paper; references unique to these sections appear only in the online paper.
Supplementary Information is available in the online version of the paper.
Author Contributions N.G. and J.L.W. designed and directed experiments; B.K., H.B., M.G. and J.J. purified samples; D.T. and M.-Q.D. performed XL–MS; S.W. collected cryo-EM data (with J.L., Y.Y., Z.L., and C.M.), performed image processing (with Y.Z.), and analysed structures (with Y.K.). N.G., S.W. and K.Y. performed structural modelling. S.W., J.L.W. and N.G. wrote the paper.
The cryo-EM density maps of state 1 and state 2 have been deposited in the Electron Microscopy Data Bank under accession numbers EMD-6615 and EMD-6616, respectively. The atomic model of state 1 has been deposited in the Protein Data Bank (PDB) under accession number 3JCT. The XL–MS data have been deposited to the ProteomeXchange Consortium (http://www.proteomexchange.org/) with the dataset identifier PXD003736.
The authors declare no competing financial interests.
Readers are welcome to comment on the online version of the paper.
References
- 1.Woolford JL, Jr, Baserga SJ. Ribosome biogenesis in the yeast Saccharomyces cerevisiae. Genetics. 2013;195:643–681. doi: 10.1534/genetics.113.153197. [DOI] [PMC free article] [PubMed] [Google Scholar]
- 2.Panse VG, Johnson AW. Maturation of eukaryotic ribosomes: acquisition of functionality. Trends Biochem Sci. 2010;35:260–266. doi: 10.1016/j.tibs.2010.01.001. [DOI] [PMC free article] [PubMed] [Google Scholar]
- 3.Lebreton A, et al. 60S ribosomal subunit assembly dynamics defined by semi-quantitative mass spectrometry of purified complexes. Nucleic Acids Res. 2008;36:4988–4999. doi: 10.1093/nar/gkn469. [DOI] [PMC free article] [PubMed] [Google Scholar]
- 4.McCann KL, Charette JM, Vincent NG, Baserga SJ. A protein interaction map of the LSU processome. Genes Dev. 2015;29:862–875. doi: 10.1101/gad.256370.114. [DOI] [PMC free article] [PubMed] [Google Scholar]
- 5.Saveanu C, et al. Nog2p, a putative GTPase associated with pre-60S subunits and required for late 60S maturation steps. EMBO J. 2001;20:6475–6484. doi: 10.1093/emboj/20.22.6475. [DOI] [PMC free article] [PubMed] [Google Scholar]
- 6.Leidig C, et al. 60S ribosome biogenesis requires rotation of the 5S ribonucleoprotein particle. Nature Commun. 2014;5:3491. doi: 10.1038/ncomms4491. [DOI] [PubMed] [Google Scholar]
- 7.Saveanu C, et al. Sequential protein association with nascent 60S ribosomal particles. Mol Cell Biol. 2003;23:4449–4460. doi: 10.1128/MCB.23.13.4449-4460.2003. [DOI] [PMC free article] [PubMed] [Google Scholar]
- 8.Matsuo Y, et al. Coupled GTPase and remodelling ATPase activities form a checkpoint for ribosome export. Nature. 2014;505:112–116. doi: 10.1038/nature12731. [DOI] [PMC free article] [PubMed] [Google Scholar]
- 9.Sengupta J, et al. Characterization of the nuclear export adaptor protein Nmd3 in association with the 60S ribosomal subunit. J Cell Biol. 2010;189:1079–1086. doi: 10.1083/jcb.201001124. [DOI] [PMC free article] [PubMed] [Google Scholar]
- 10.Greber BJ, Boehringer D, Montellese C, Ban N. Cryo-EM structures of Arx1 and maturation factors Rei1 and Jjj1 bound to the 60S ribosomal subunit. Nature Struct Mol Biol. 2012;19:1228–1233. doi: 10.1038/nsmb.2425. [DOI] [PubMed] [Google Scholar]
- 11.Bradatsch B, et al. Structure of the pre-60S ribosomal subunit with nuclear export factor Arx1 bound at the exit tunnel. Nature Struct Mol Biol. 2012;19:1234–1241. doi: 10.1038/nsmb.2438. [DOI] [PMC free article] [PubMed] [Google Scholar]
- 12.Kharde S, Calviño FR, Gumiero A, Wild K, Sinning I. The structure of Rpf2–Rrs1 explains its role in ribosome biogenesis. Nucleic Acids Res. 2015;43:7083–7095. doi: 10.1093/nar/gkv640. [DOI] [PMC free article] [PubMed] [Google Scholar]
- 13.Madru C, et al. Chaperoning 5S RNA assembly. Genes Dev. 2015;29:1432–1446. doi: 10.1101/gad.260349.115. [DOI] [PMC free article] [PubMed] [Google Scholar]
- 14.Barrio-Garcia C, et al. Architecture of the Rix1–Rea1 checkpoint machinery during pre-60S-ribosome remodeling. Nature Struct Mol Biol. 2016;23:37–44. doi: 10.1038/nsmb.3132. [DOI] [PubMed] [Google Scholar]
- 15.Klinge S, Voigts-Hoffmann F, Leibundgut M, Arpagaus S, Ban N. Crystal structure of the eukaryotic 60S ribosomal subunit in complex with initiation factor 6. Science. 2011;334:941–948. doi: 10.1126/science.1211204. [DOI] [PubMed] [Google Scholar]
- 16.Greber BJ, et al. Insertion of the biogenesis factor Rei1 probes the ribosomal tunnel during 60S maturation. Cell. 2016;164:91–102. doi: 10.1016/j.cell.2015.11.027. [DOI] [PubMed] [Google Scholar]
- 17.Ben-Shem A, et al. The structure of the eukaryotic ribosome at 3.0 Å resolution. Science. 2011;334:1524–1529. doi: 10.1126/science.1212642. [DOI] [PubMed] [Google Scholar]
- 18.Talkish J, Zhang J, Jakovljevic J, Horsey EW, Woolford JL., Jr Hierarchical recruitment into nascent ribosomes of assembly factors required for 27SB pre-rRNA processing inSaccharomyces cerevisiae. Nucleic Acids Res. 2012;40:8646–8661. doi: 10.1093/nar/gks609. [DOI] [PMC free article] [PubMed] [Google Scholar]
- 19.Dembowski JA, Kuo B, Woolford JL., Jr Has1 regulates consecutive maturation and processing steps for assembly of 60S ribosomal subunits. Nucleic Acids Res. 2013;41:7889–7904. doi: 10.1093/nar/gkt545. [DOI] [PMC free article] [PubMed] [Google Scholar]
- 20.Feng B, et al. Structural and functional insights into the mode of action of a universally conserved Obg GTPase. PLoS Biol. 2014;12:e1001866. doi: 10.1371/journal.pbio.1001866. [DOI] [PMC free article] [PubMed] [Google Scholar]
- 21.Pertschy B, et al. Cytoplasmic recycling of 60S preribosomal factors depends on the AAA protein Drg1. Mol Cell Biol. 2007;27:6581–6592. doi: 10.1128/MCB.00668-07. [DOI] [PMC free article] [PubMed] [Google Scholar]
- 22.Kappel L, et al. Rlp24 activates the AAA-ATPase Drg1 to initiate cytoplasmic pre-60S maturation. J Cell Biol. 2012;199:771–782. doi: 10.1083/jcb.201205021. [DOI] [PMC free article] [PubMed] [Google Scholar]
- 23.Granneman S, Petfalski E, Tollervey D. A cluster of ribosome synthesis factors regulate pre-rRNA folding and 5.8S rRNA maturation by the Rat1 exonuclease. EMBO J. 2011;30:4006–4019. doi: 10.1038/emboj.2011.256. [DOI] [PMC free article] [PubMed] [Google Scholar]
- 24.Granato DC, Machado-Santelli GM, Oliveira CC. Nop53p interacts with 5.8S rRNA co-transcriptionally, and regulates processing of pre-rRNA by the exosome. FEBS J. 2008;275:4164–4178. doi: 10.1111/j.1742-4658.2008.06565.x. [DOI] [PubMed] [Google Scholar]
- 25.Thoms M, et al. The exosome is recruited to RNA substrates through specific adaptor proteins. Cell. 2015;162:1029–1038. doi: 10.1016/j.cell.2015.07.060. [DOI] [PubMed] [Google Scholar]
- 26.Jakovljevic J, et al. Ribosomal proteins L7 and L8 function in concert with six A3 assembly factors to propagate assembly of domains I and II of 25S rRNA in yeast 60S ribosomal subunits. RNA. 2012;18:1805–1822. doi: 10.1261/rna.032540.112. [DOI] [PMC free article] [PubMed] [Google Scholar]
- 27.Mitchell P, Petfalski E, Tollervey D. The 3′ end of yeast 5.8S rRNA is generated by an exonuclease processing mechanism. Genes Dev. 1996;10:502–513. doi: 10.1101/gad.10.4.502. [DOI] [PubMed] [Google Scholar]
- 28.Thomson E, Tollervey D. The final step in 5.8S rRNA processing is cytoplasmic in Saccharomyces cerevisiae. Mol Cell Biol. 2010;30:976–984. doi: 10.1128/MCB.01359-09. [DOI] [PMC free article] [PubMed] [Google Scholar]
- 29.Zhang J, et al. Assembly factors Rpf2 and Rrs1 recruit 5S rRNA and ribosomal proteins rpL5 and rpL11 into nascent ribosomes. Genes Dev. 2007;21:2580–2592. doi: 10.1101/gad.1569307. [DOI] [PMC free article] [PubMed] [Google Scholar]
- 30.Ulbrich C, et al. Mechanochemical removal of ribosome biogenesis factors from nascent 60S ribosomal subunits. Cell. 2009;138:911–922. doi: 10.1016/j.cell.2009.06.045. [DOI] [PubMed] [Google Scholar]
- 31.Sahasranaman A, et al. Assembly of Saccharomyces cerevisiae 60S ribosomal subunits: role of factors required for 27S pre-rRNA processing. EMBO J. 2011;30:4020–4032. doi: 10.1038/emboj.2011.338. [DOI] [PMC free article] [PubMed] [Google Scholar]
- 32.Xu T, et al. ProLuCID, a fast and sensitive tandem mass spectra-based protein identification program. Mol Cell Proteomics. 2006;5:S174. [Google Scholar]
- 33.Tabb DL, McDonald WH, Yates JR., III DTASelect and Contrast: tools for assembling and comparing protein identifications from shotgun proteomics. J Proteome Res. 2002;1:21–26. doi: 10.1021/pr015504q. [DOI] [PMC free article] [PubMed] [Google Scholar]
- 34.Yang B, et al. Identification of cross-linked peptides from complex samples. Nature Methods. 2012;9:904–906. doi: 10.1038/nmeth.2099. [DOI] [PubMed] [Google Scholar]
- 35.Lei J, Frank J. Automated acquisition of cryo-electron micrographs for single particle reconstruction on an FEI Tecnai electron microscope. J Struct Biol. 2005;150:69–80. doi: 10.1016/j.jsb.2005.01.002. [DOI] [PubMed] [Google Scholar]
- 36.Li X, et al. Electron counting and beam-induced motion correction enable near-atomic-resolution single-particle cryo-EM. Nature Methods. 2013;10:584–590. doi: 10.1038/nmeth.2472. [DOI] [PMC free article] [PubMed] [Google Scholar]
- 37.Shaikh TR, et al. SPIDER image processing for single-particle reconstruction of biological macromolecules from electron micrographs. Nature Protocols. 2008;3:1941–1974. doi: 10.1038/nprot.2008.156. [DOI] [PMC free article] [PubMed] [Google Scholar]
- 38.Tang G, et al. EMAN2: an extensible image processing suite for electron microscopy. J Struct Biol. 2007;157:38–46. doi: 10.1016/j.jsb.2006.05.009. [DOI] [PubMed] [Google Scholar]
- 39.Mindell JA, Grigorieff N. Accurate determination of local defocus and specimen tilt in electron microscopy. J Struct Biol. 2003;142:334–347. doi: 10.1016/s1047-8477(03)00069-8. [DOI] [PubMed] [Google Scholar]
- 40.Scheres SH. RELION: implementation of a Bayesian approach to cryo-EM structure determination. J Struct Biol. 2012;180:519–530. doi: 10.1016/j.jsb.2012.09.006. [DOI] [PMC free article] [PubMed] [Google Scholar]
- 41.Chen S, et al. High-resolution noise substitution to measure overfitting and validate resolution in 3D structure determination by single particle electron cryomicroscopy. Ultramicroscopy. 2013;135:24–35. doi: 10.1016/j.ultramic.2013.06.004. [DOI] [PMC free article] [PubMed] [Google Scholar]
- 42.Kucukelbir A, Sigworth FJ, Tagare HD. Quantifying the local resolution of cryo-EM density maps. Nature Methods. 2014;11:63–65. doi: 10.1038/nmeth.2727. [DOI] [PMC free article] [PubMed] [Google Scholar]
- 43.Pettersen EF, et al. UCSF Chimera—a visualization system for exploratory research and analysis. J Comput Chem. 2004;25:1605–1612. doi: 10.1002/jcc.20084. [DOI] [PubMed] [Google Scholar]
- 44.Emsley P, Lohkamp B, Scott WG, Cowtan K. Features and development of Coot. Acta Crystallogr D. 2010;66:486–501. doi: 10.1107/S0907444910007493. [DOI] [PMC free article] [PubMed] [Google Scholar]
- 45.Lorenz R, et al. ViennaRNA Package 2.0. Algorithms Mol Biol. 2011;6:26. doi: 10.1186/1748-7188-6-26. [DOI] [PMC free article] [PubMed] [Google Scholar]
- 46.De Rijk P, Wuyts J, De Wachter R. RnaViz 2: an improved representation of RNA secondary structure. Bioinformatics. 2003;19:299–300. doi: 10.1093/bioinformatics/19.2.299. [DOI] [PubMed] [Google Scholar]
- 47.Buchan DW, Minneci F, Nugent TC, Bryson K, Jones DT. Scalable web services for the PSIPRED Protein Analysis Workbench. Nucleic Acids Res. 2013;41:W349–W357. doi: 10.1093/nar/gkt381. [DOI] [PMC free article] [PubMed] [Google Scholar]
- 48.Yang J, et al. The I-TASSER Suite: protein structure and function prediction. Nature Methods. 2015;12:7–8. doi: 10.1038/nmeth.3213. [DOI] [PMC free article] [PubMed] [Google Scholar]
- 49.Schrodinger, LLC. The PyMOL molecular graphics system, version 1.3r1. 2010. [Google Scholar]
- 50.Stein N. CHAINSAW: a program for mutating pdb files used as templates in molecular replacement. J Appl Cryst. 2008;41:641–643. [Google Scholar]
- 51.Winn MD, et al. Overview of the CCP4 suite and current developments. Acta CrystallogrD. 2011;67:235–242. doi: 10.1107/S0907444910045749. [DOI] [PMC free article] [PubMed] [Google Scholar]
- 52.Asano N, et al. Structural and functional analysis of the Rpf2–Rrs1 complex in ribosome biogenesis. Nucleic Acids Res. 2015;43:4746–4757. doi: 10.1093/nar/gkv305. [DOI] [PMC free article] [PubMed] [Google Scholar]
- 53.Groft CM, Beckmann R, Sali A, Burley SK. Crystal structures of ribosome anti-association factor IF6. Nature Struct Biol. 2000;7:1156–1164. doi: 10.1038/82017. [DOI] [PubMed] [Google Scholar]
- 54.Baßler J, et al. A network of assembly factors is involved in remodeling rRNA elements during preribosome maturation. J Cell Biol. 2014;207:481–498. doi: 10.1083/jcb.201408111. [DOI] [PMC free article] [PubMed] [Google Scholar]
- 55.Afonine PV, et al. Towards automated crystallographic structure refinement with phenix.refine. Acta Crystallogr D. 2012;68:352–367. doi: 10.1107/S0907444912001308. [DOI] [PMC free article] [PubMed] [Google Scholar]
- 56.Adams PD, et al. PHENIX: a comprehensive Python-based system for macromolecular structure solution. Acta Crystallogr D. 2010;66:213–221. doi: 10.1107/S0907444909052925. [DOI] [PMC free article] [PubMed] [Google Scholar]
- 57.Murshudov GN, Vagin AA, Dodson EJ. Refinement of macromolecular structures by the maximum-likelihood method. Acta Crystallogr D. 1997;53:240–255. doi: 10.1107/S0907444996012255. [DOI] [PubMed] [Google Scholar]
- 58.Amunts A, et al. Structure of the yeast mitochondrial large ribosomal subunit. Science. 2014;343:1485–1489. doi: 10.1126/science.1249410. [DOI] [PMC free article] [PubMed] [Google Scholar]
- 59.Fernández IS, Bai XC, Murshudov G, Scheres SH, Ramakrishnan V. Initiation of translation by cricket paralysis virus IRES requires its translocation in the ribosome. Cell. 2014;157:823–831. doi: 10.1016/j.cell.2014.04.015. [DOI] [PMC free article] [PubMed] [Google Scholar]
- 60.Chen VB, et al. MolProbity: all-atom structure validation for macromolecular crystallography. Acta Crystallogr D. 2010;66:12–21. doi: 10.1107/S0907444909042073. [DOI] [PMC free article] [PubMed] [Google Scholar]


