Abstract
Liver stereotactic body radiation therapy (SBRT) patients differ in both pre-treatment liver function (e.g. due to degree of cirrhosis and/or prior treatment) and radiosensitivity, leading to high variability in potential liver toxicity with similar doses. This work investigates three treatment planning optimization models that minimize risk of toxicity: two consider both voxel-based pre-treatment liver function and local-function-based radiosensitivity with dose; one considers only dose. Each model optimizes different objective functions (varying in complexity of capturing the influence of dose on liver function) subject to the same dose constraints and are tested on 2D synthesized and 3D clinical cases. The normal-liver-based objective functions are the linearized equivalent uniform dose (ℓEUD) (conventional ‘ℓEUD model’), the so-called perfusion-weighted ℓEUD (fEUD) (proposed ‘fEUD model’), and post-treatment global liver function (GLF) (proposed ‘GLF model’), predicted by a new liver-perfusion-based dose-response model. The resulting ℓEUD, fEUD, and GLF plans delivering the same target ℓEUD are compared with respect to their post-treatment function and various dose-based metrics. Voxel-based portal venous liver perfusion, used as a measure of local function, is computed using DCE-MRI. In cases used in our experiments, the GLF plan preserves up to 4.6%(7.5%) more liver function than the fEUD (ℓEUD) plan does in 2D cases, and up to 4.5%(5.6%) in 3D cases. The GLF and fEUD plans worsen in ℓEUD of functional liver on average by 1.0 Gy and 0.5 Gy in 2D and 3D cases, respectively. Liver perfusion information can be used during treatment planning to minimize the risk of toxicity by improving expected GLF; the degree of benefit varies with perfusion pattern. Although fEUD model optimization is computationally inexpensive and often achieves better GLF than ℓEUD model optimization does, the GLF model directly optimizes a more clinically relevant metric and can further improve fEUD plan quality.
Keywords: treatment planning, functional imaging, optimization, liver SBRT, dose-response
1. Introduction
Stereotactic body radiation therapy (SBRT) has become a popular method of treatment for liver cancer for its efficacy in local tumor control (Liu et al 2013, Wahl et al 2015). SBRT is generally used to treat small tumors (approximately 5 cm or less in diameter) due to the risk of normal tissue toxicity when treating larger volumes to high doses. High dose from treatment, patients’ sensitivity to radiation, and their pre-treatment liver function all affect the likelihood of radiation-induced liver disease (RILD). The latter two factors are patient attributes that are not reflected in computed tomography (CT) scans typically used to characterize patient geometry for treatment planning. In this paper, we focus on incorporating pre-treatment liver function into treatment planning decisions, motivated by the following considerations. The liver is well-known to function in a parallel-like fashion (Jackson et al 1995), e.g. a certain portion of the liver may be removed or damaged without losing overall function. However, local liver function is not uniform, and initial function as well as which functional portions are damaged influences the post-treatment global liver function. This implies the need to take into consideration during treatment planning (1) spacial features of a dose distribution, which would prioritize sparing of high-functioning portions of the liver, and (2) liver tissue dose response.
There has been ongoing work exploring use of physiological imaging to consider organ function and/or tumor aggression information in treatment planning (e.g. brain target radiosensitivity from dynamic susceptibility contrast-enhanced MRI (Chen et al 2007), lung target proliferation rate from fluorine-18-fluorodeoxyglucose PET (Das et al 2004, Feng et al 2009), liver function from 99mTc-sulphur colloid (SC) SPECT/CT (Bowen et al 2015), and lung function from various imaging modalities (Seppenwoolde et al 2002, Ireland et al 2007)). Bowen et al (2015) segmented high-functioning liver into regions binned by intervals of SC uptake and redistributed dose by scaling the mean dose of each of these regions according to SC uptake in the objective function. Ireland et al (2007) segmented functional lung using 3He MRI and compared treatment plans from minimizing the volume receiving at least 20 Gy in the total lung versus total functional lung. Seppenwoolde et al (2002) showed potential of using voxel-based cost functions and classifying patients by perfusion pattern. Two advantages of using voxel-based information are the ability to view the relevant organ approximately as a continuous body, as opposed to (manually) segmenting it into disjoint functional and nonfunctional structures (e.g. as in Bowen et al (2015) and Ireland et al (2007)), and to use functional imaging information directly, which is operationally better suited for adaptive planning. In these previous works, all approaches used surrogates for post-treatment organ function and do not consider organ dose-response behavior in the optimization. Zhang et al (2010) examined lung dose response and observed that post-treatment reduction in perfusion plateaus beyond a particular dose threshold, i.e. damage becomes saturated; the liver dose-response model from Wang et al (2016) reflects similar behavior.
In this paper, we propose two new treatment planning approaches aimed at better preserving liver function without compromising tumor coverage or exceeding acceptable limits to other critical structures. In particular, we propose replacing the traditional objective of minimizing linearized equivalent uniform dose (ℓEUD) to the liver with ones that account for liver function: (1) perfusion-weighted ℓEUD (fEUD) that avoids delivering dose to highly-perfused liver by explicitly incorporating voxel-based pre-treatment liver perfusion into a treatment planning model, resulting in a problem that is convex and can be efficiently solved to global optimality, and (2) post-treatment global liver function (GLF) that explicitly captures global liver function using a model of liver dose-response based on pre- and post-treatment perfusion, resulting in a problem that is nonconvex and can be solved to local optimality. To measure liver function, our study uses voxel-based pre-treatment liver perfusion, computed from Dynamic-Contrast Enhanced MRI (DCE-MRI). Cao et al (2013) have shown portal venous perfusion to be a good indicator of both local and global liver function.
The rest of this paper is organized as follows. In section 2, we formalize the three models used and describe both 2D (sythensized data) and 3D (real patient data) instances that we used to test these models. In section 3, we present and compare resulting dose distributions obtained from each of the models. In section 4, we show how the fEUD and GLF models produce alternative dose distributions to the ones obtained by the ℓEUD model, and in particular show the potential benefits of each alternative dose distribution. We conclude the paper in section 5.
2. Methods
2.1. Notation and treatment criteria
We discretize the relevant areas of the patient anatomy into a finite set of voxels V, and discretize the beams, whose orientation is chosen a priori by a dosimetrist, into a finite set of beamlets N. Let S be the set of structures, Vs be the set of voxels in structure s∈S, with V =∪s∈S Vs, and D ∈ R|N|×|V| be the dose deposition matrix, where an entry Dij is the dose deposited in voxel j∈V from beamlet i∈N at unit intensity. In our treatment planning model, the decisions include xi, i∈ N, which is the intensity of beamlet i, and zj, j∈V, which is the (physical) dose delivered to voxel j computed as
Given dose distribution z ∈ R|V|, the generalized equivalent uniform dose (gEUD) (Niemierko 1999), a biological criterion, can be used to evaluate a dose distribution to a structure s∈S with voxel set Vs. The gEUD to a structure s∈S is defined as
| (1) |
where as is a structure-specific parameter (Li et al 2012). For computational efficiency, we use a piecewise-linear approximation of the gEUD, namely, the linearized equivalent uniform dose (ℓEUD) (Thieke et al 2002), which is a convex combination of the mean and maximum dose, or of the mean and minimum dose, for structures where we are concerned with overdosing or underdosing, respectively:
where is also structure-specific. We note that, in optimization models, typically is bounded from above to avoid hot spots (e.g. if s is a critical structure) and is bounded from below to ensure sufficient coverage and avoid any cold spots (e.g. if s is a target). From an optimization perspective, both of these ℓEUD-bounding constraints are convex, and therefore tractable.
2.2. Optimization models
Using the treatment criteria discussed above, our treatment planning optimization model minimizes an objective function based on dose, subject to dose constraints for various structures. The model is as follows:
| (2) |
| (3) |
| (4) |
| (5) |
| (6) |
Here, in (3), ℓEUD to the planning target volume (PTV), denoted , is bounded below by the parameter , which is typically the prescription dose. In our experiments, we only consider cases with one target, but more constraints of this type can be added to represent multiple targets. In (4), the parameters denote upper bounds on to the remaining critical structures s∈S\ {Liver, PTV}. Constraints in (5) link dose and beamlet intensity variables. Inequalities in (6) provide lower and upper bounds on beamlet intensities. Solutions to these models are treatment plans consisting of beamlet intensities x that deliver resulting dose distributions z, which together satisfy constraints (3)–(6). The function being optimized in (2) reflects an objective related to the liver dose; the standard approach is to minimize —we will refer to the model with this objective as the ℓEUD model. Note that in the ℓEUD model, the objective function gives uniform weight to the dose to each voxel in the liver, i.e. it considers every voxel as equally important to spare. In the following sections, we propose two alternative liver objectives: the first of these objectives reflects relative importance of liver voxels by considering their relative perfusion level to discourage dose to highly-perfused liver; the other objective accounts for voxel-based dose response that considers ‘damage-resistant’ and ‘damage-saturated’ dose thresholds (global liver response is then the sum of appropriate terms over voxels).
2.3. Perfusion avoidance model
As previously mentioned, we can use liver perfusion maps computed from DCE-MRI as an indicator of local and global liver function (Cao et al 2013). We denote the perfusion vector for the liver by , where the jth component of f is the perfusion level of voxel j∈VLiver. Liver perfusion values range from to over . In this paper, we assume there is no uncertainty in these measurements, e.g. due to noise or image registration. Letting be a vector-valued function g(f) = (g1(f),…,g|VLiver|(f)), we define each component gj(f), j∈ VLiver, as the relative importance of voxel j among all liver voxels, given perfusion vector f. In this work, we consider gj(·) that only depend on fj, and we require each gj(·) to be non-decreasing in fj. This gives greater importance to highly-perfused voxels, which we most want to preserve. In our selection of g(·), we reflect the findings of previous studies (Cao et al 2008, Wang et al 2016) that there exists a perfusion threshold below which voxels do not have any functional value. Although there is not a consensus on the value of this threshold, in the following we use as a compromise between suggested values. Similarly, we assume that voxels with values measured over do not have higher function than those at , as in Pandharipande et al (2005) and Cao et al (2006). Thus, values are rounded accordingly and the effective range of perfusion considered is [30, 100]. These values are then shifted down to [0, 70] to further distinguish voxels with higher function from ones with lower function. Based on these considerations, we use
| (7) |
in our experiments. To incorporate perfusion information into treatment planning, we use a so-called ‘perfusion-weighted ℓEUD’ (denoted fEUD), which is similar to the functional EUD described, e.g. by Miften et al (2004) and used by Seppenwoolde et al (2002) to reduce dose to high-functioning lung. We define fEUD to the liver by weighting the dose to each liver voxel by the voxel’s relative importance:
| (8) |
(note: ). We refer to the optimization model (2)–(6) with used as the objective in (2) as the perfusion avoidance model, or simply the fEUD model. The fEUD model is similar to Bowen et al’s approach of differentiating functional liver regions by intervals of 99mTc-sulphur colloid SPECT uptake and then minimizing a weighted sum of mean doses to each of the differentiated regions. However, we do not segment the liver by perfusion ranges and instead differentiate function at the voxel level.
Although we also introduce a liver dose-response model to optimize post-treatment global liver function in the next section, we include in our experiments since it essentially reflects preference for delivering less dose to higher-perfused voxels, in order to show the potential benefits of a perfusion-conscious model. Moreover, because of the convex piece-wise linear structure of this objective function, the resulting optimization model is linear and can be solved much more efficiently than the more complex global liver function model.
2.4. Global liver function preservation model
The perfusion avoidance model described in the previous section may not fully capture characteristics of normal liver dose response. We thus propose an alternative optimization model, with an objective function designed to reflect post-treatment global liver function. The model was developed using liver perfusion dose-response data from an Institutional Review Board-approved study. The study consisted of 24 patients who were treated with variable fractionation schemes and imaged using DCE-MRI at the following time points: pre-treatment, after 60% of planned treatment, and 1 month post-treatment. In the analysis, physical dose was converted to EQD2 (equivalent dose in 2 Gy fractions) to account for the variable fractionation.
Our model of perfusion-based post-treatment global liver function has two components. The first is a perfusion-based model of global liver function. According to Wang et al (2016), given perfusion value fj at voxel j, the corresponding so-called probability of function, p, for this voxel is computed as
| (9) |
where F0.5 is the perfusion value at which the voxel functions with a likelihood of 50%, and n is a steepness parameter. Due to the nature of the logistic function, voxels with poor/high perfusion have similarly poor/high function probability, implying two perfusion thresholds: one below which all voxels have no function, and another above which all voxels are simply considered fully functioning, a behavior consistent with the weights used in the fEUD objective. Given the probability of function for each liver voxel, global liver function (assuming a parallel structure) can be computed as follows (see Wang et al (2016)):
| (10) |
where γ is the probability threshold under which voxels do not contribute to global liver function and ṼLiver = {j ∈ VLiver : p(fj) > γ}.
The second component of our model captures the impact of dose on liver voxel perfusion. In the following, we use superscripts ‘pre’ and ‘post’ to denote pre- and post-treatment measurements. Previous lung studies indicate a potential dose threshold beyond which damage is saturated, i.e. no more function is lost (Zhang et al 2010). To consistently reflect these thresholds for our liver response model, we assume a logistic form. Let be a vector-valued function, with given by:
| (11) |
where D50 is the EQD2 dose required to reduce initial perfusion by 50%, k determines the steepness of the curve, and
| (12) |
where is the alpha-beta ratio of structure s, and T is the total number of fractions. The parameters of this model were found from logistic fitting from the study’s patient population.
Combining (10) and (11) we can express post-treatment global liver function in terms of EQD2 and pre-treatment perfusion:
| (13) |
and, substituting (11), we obtain a model for post-treatment global liver function GLFpost(z;fpre) as a function of physical dose z and pre-treatment perfusion fpre:
| (14) |
Each term in the above summation (corresponding to voxel j) represents the post-treatment probability of function given dose zj and pre-treatment perfusion .
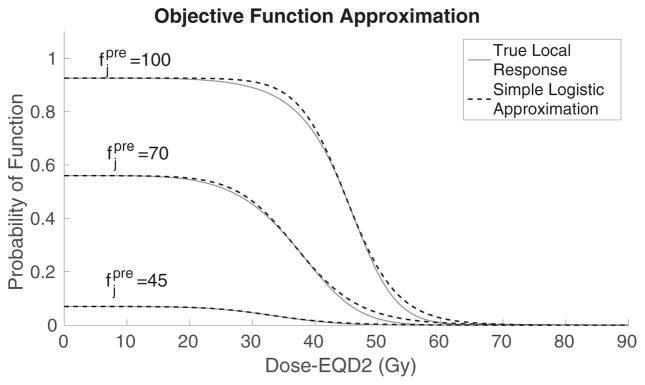
We illustrate the shape of several terms in the sum (13), which reflect probability of function, in terms of EQD2, for voxels with various pre-treatment perfusion levels (solid curves), in figure 1. There are two important dose thresholds concerning post-treatment function: below the dose-damage threshold no significant function is lost, and above the dose-saturation threshold no additional function is lost. The terms in the sum (14), if plotted with physical dose as the independent variable instead of EQD2, have similar S-shapes but are steeper due to the different scaling of the independent axis. For implementation purposes, we approximate each term of (14) by a simpler logistic function; details of the approximation are discussed in the next section. Note that since GLF should be maximized, to fit into our optimization framework, we (equivalently) minimize its additive inverse.
Figure 1.
Comparison between examples of true local response (solid) and simple logistic approximation (dotted) varied by pre-treatment perfusion levels.
2.4.1. A simple logistic approximation of GLF
To simplify implementation, we approximate GLFpost(z;fpre) with the following simpler function :
| (15) |
where . To derive this simplification, each term in the summation (14) (corresponding to voxel j) is replaced by a simple logistic function
where is the pre-treatment probability of function of voxel j (computed using (9)), z̄j is the dose that results, for this voxel, in reduction of pre-treatment function by 50%, and σj is the slope of the corresponding term in (14) at z̄j (z̄j is also approximately the point of change in the sign of curvature in the corresponding term in (14)). Note that the values of these parameters are based on pre-treatment perfusion , and in particular, that the steepness parameter σj reflects the sensitivity of the voxel, i.e. the magnitude of its response to dose. Also, in (15) we include all voxels whose pre-treatment probability of function exceeds γ, with minimal impact on the resulting values. The dotted curves in figure 1 illustrate the approximation (with the formulae adjusted to the EQD2 dose scale).
We refer to the optimization model (2)–(6) with used as the objective in (2) as the global liver function preservation model, or simply the GLF model.
2.5. Experiment
In sections 2.2–2.4, we proposed an optimization model (2)–(6) with three options for objective function (2): of (8), and of (15). To test the effectiveness of considering varying degrees of function information during optimization, we compared dose distributions obtained from these three models (we refer to these dose distributions as the ℓEUD, fEUD, and GLF plans, respectively) for the same set of treatment parameters (i.e. the bounds that appear on the right-hand sides of (3) and (4)). Thus, the set of constraints was identical in the three models and the only difference was the objective function used in (2). All treatment planning performed for the purpose of the current study was retrospective.
Both radiation therapy simulation imaging and perfusion data were obtained from patients enrolled in a prospective study approved by an institutional review board. Plan setup and dose coefficient (Dij) calculations were done in the University of Michigan’s in-house treatment planning software packages, UMPlan and UMOpt (Kim et al 1995, Kessler et al 2005).
To evaluate dose to the PTV with gEUD in (1), it is common to use aPTV ≈ −10 (Li et al 2012). Using the piecewise linear approximation (ℓEUD-underdose) to evaluate dose to the PTV, we set so that , where zdelivered is a treatment plan delivered to a typical liver patient in the Department of Radiation Oncology at the University of Michigan. We simply used the mean dose, i.e. , for , as liver is widely considered to be a highly parallel organ. For all other structures, the maximum dose in structure s was used for , i.e. , s∈S\ {Liver, PTV}. The maximum intensity of any beamlet in (6) was bounded by U = 40 (according to institutional practice) to avoid extremely high beamlet intensities that would result in high monitor units and inefficient treatment delivery. This constraint typically does not restrict solution quality as beamlet intensities rarely reach this maximum value. In (11), D50 = 51.7 Gy-EQD2 and k = 4.9, which were determined from model fitting. In (9), and n = 6.4, both of which were obtained from Wang et al (2016). To compute EQD2 dose for liver, we used and T = 5 fractions (according to the protocol at the University of Michigan Hospital).
We remark that, in formulating our models, we have assumed that the liver perfusion data is known and not subject to uncertainty. In practice, uncertainty is undoubtedly present, in part due to possible measurement and registration imprecision, and can have a clinical impact. While this paper focuses on incorporating functional imaging and using true dose-response models for capturing change in organ function in treatment planning, in our future work we plan to test the impact of parameter uncertainty on treatment plans obtained with the models presented here, and extend the models to make them robust. This would involve developing appropriate analytical models of the uncertainty and incorporating them into the optimization. As our preliminary work suggests, robust versions of the models considered in this paper will be significantly more mathematically complex, and will require development of corresponding solution methods. We plan to report on the methodology and results of robust models in future publications.
Our implementation of all three models was done in C++, with Gurobi’s primal simplex method (Gurobi Optimization, Houston, TX) used to solve the linear optimization problems resulting from ℓEUD and fEUD models. The GLF model results in a nonconvex nonlinear optimization problem, which was solved using IpOpt’s primal-dual interior point method (Wächter and Biegler 2006) (and linear solver subroutine by HSL (2013)). All experiments were performed on a custom-built machine with 3.5 GHz 8-Core Intel i7-3770K processor and 31.4 GB memory at 3901 MHz. Although the interior point method is only guaranteed to find locally optimal solutions, it was warm-started with the fEUD plan to guarantee a treatment plan that was at least as good (in terms of GLF objective) as the fEUD plan.
2.6. Liver perfusion patterns
The patient population varies widely in terms of liver perfusion patterns. Since 3D dose distributions are difficult to visualize, analyzing synthesized 2D cases with specific patterns allows for a comprehensive illustration of where dose is effectively reduced and how this reduction is compensated for to maintain target coverage. We identified oft-observed 3D perfusion patterns from DCE-MRI in real patient cases and, for one typical 2D liver geometry, replicated these perfusion patterns to generate diverse problem instances. We also applied our models to real 3D patient cases.
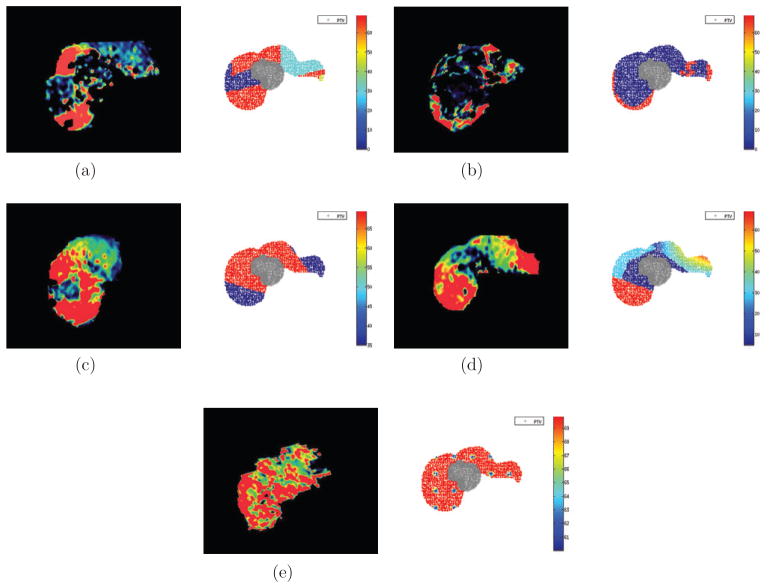
The 2D liver cases had 3 structures: PTV, normal liver, and unspecified normal tissue (figure 2). Figure 3 shows the 5 perfusion patterns investigated within the same geometry. On the left are axial views of liver perfusion maps, color-coded by level of perfusion, that were observed in clinical cases; on the right are the synthesized cases where the PTV voxels (crosses) are contoured and the surrounding liver voxels (dots) are color-coded with respect to their perfusion-based relative importance (g) values, see (7). The unspecified normal tissue is not shown.
Figure 2.
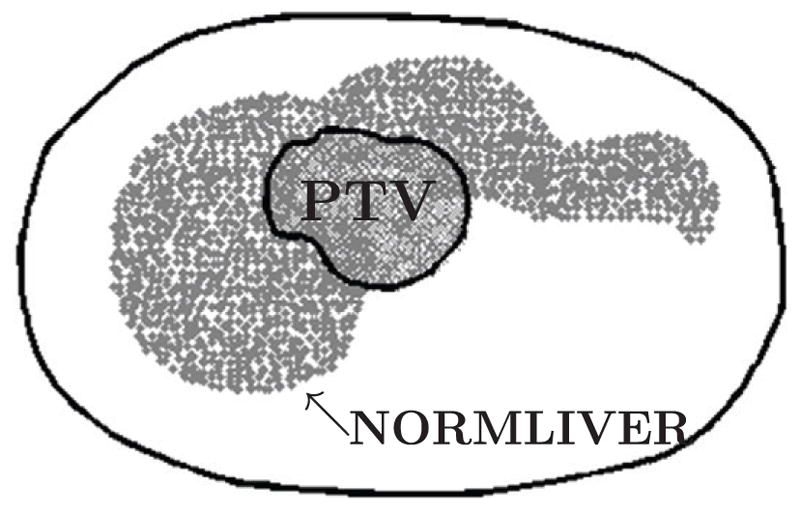
Geometry of 2D liver case (axial view). The small contour represents the boundary of the PTV voxels and is surrounded by normal liver voxels. The large contour represents the boundary of the patient and contains normal tissue voxels that are not shown.
Figure 3.
Commonly encountered perfusion patterns on DCE-MRI (left); synthesized 2D liver cases with PTV in gray and surrounding liver voxels color-coded by relative importance (i.e. gj(fj)) values (right). (a) Pattern P1: large clusters of high and poor perfusion. (b) Pattern P2: small regions of high perfusion. (c) Pattern P3: high perfusion around tumor. (d) Pattern P4: poor perfusion around tumor and high elsewhere. (e) Pattern P5: high perfusion throughout.
Table 1 summarizes parameter values used in the models for the 2D cases. We note that the upper bound for the normal tissue, , is given (in physical dose) as 80 Gy in order to allow the fEUD and GLF models to focus on improving solely the dose distribution in the normal liver. However, when applying the models to real patient data, all bounds on to critical structures are based on clinical practice at the University of Michigan Hospital.
Table 1.
Parameter values used in models for the 2D cases.
| Structure | s |
|
|
||
|---|---|---|---|---|---|
| PTV | 0 | α− = 0.84 | 60 (Rx dose) | ||
| PTV | 0 | α+ = 0 | 80 | ||
| NORMLIVER | 1 | α+ = 1.0 | Objective function | ||
| NORMAL TISSUE | 2 | α+ = 0 | 80 |
We also considered five typical 3D patient cases. Table 2 summarizes parameter values used for all 3D cases. Lastly, in the 3D cases, 14 non-coplanar beams were used in order to allow flexibility to produce an appreciable alternative dose distribution (in the 2D cases, nine beams were used).
Table 2.
Parameter values used in models for the 3D casesa.
| Structure (s) |
|
|
||
|---|---|---|---|---|
| NORMLIVER | α+ = 1.0 | Objective function | ||
| PTV | α− = 0.84 | 60 | ||
| PTV | α+ = 0 | 80 | ||
| CORD | α+ = 0 | 25 | ||
| LTKIDNEY | α+ = 0 | 27.3 | ||
| RTKIDNEY | α+ = 0 | 27.3 | ||
| STOMACH | α+ = 0 | 27.5 | ||
| HEART | α+ = 0 | 32 | ||
| DUODENUM | α+ = 0 | 30 | ||
| BOWEL | α+ = 0 | 30 | ||
| ESOPHAGUS | α+ = 0 | 27.5 |
Approximated lower and upper bounds based on clinical practice at University of Michigan Hospital.
3. Results
In this section we show the potential benefits and limitations of treatment plans obtained by the ℓEUD, fEUD, and GLF models. First, we discuss results for the sythensized 2D cases to provide intuition on differences in the resulting dose distributions. These examples also show which perfusion patterns have the most to gain from the models that use functional imaging information. Then, we discuss results for five representative real 3D patient cases.
In computing liver ℓEUD, we only concern ourselves with pre-treatment functional liver and denote it as s = fLiver:
| (16) |
3.1. 2D liver cases
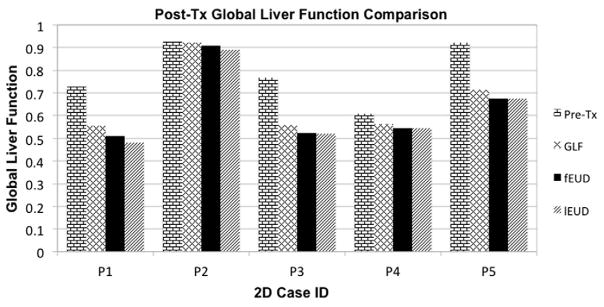
We compare the (as in (16)) achieved by the fEUD and GLF plans in table 3. We present GLF values of the three plans in table 4 and in figure 4, along with pre-treatment GLF for each case. We use the ‘true’ expression for GLF defined in (14) to calculate post-treatment global liver function values. Recall that, for each case, the solution process for the non-convex GLF model is warm-started with the solution of the fEUD model; after the numerical optimization reaches a pre-specified time limit (we use 30 h), we report either the algorithm output or its warm-start input, whichever achieves higher post-treatment GLF, as the GLF plan.
Table 3.
achieved by fEUD and GLF plans on 2D cases.
| Perfusion patterns | ℓEUD plan | fEUD plan | GLF plan |
|---|---|---|---|
| P1: Large clusters of high and poor perfusion | 18.9 | 19.0 | 21.6 |
| P2: Small regions of high perfusion | 8.6 | 6.9 | 10.7 |
| P3: High perfusion around tumor | 18.7 | 18.7 | 20.8 |
| P4: Poor perfusion around tumor | 14.5 | 14.5 | 17.0 |
| P5: High perfusion throughout | 6.5 | 5.8 | 10.2 |
Figure 4.
Pre- and post-treatment GLF achieved by ℓEUD, fEUD and GLF plans on 2D cases. (Note: all cases have some deficit in function at the beginning of treatment.)
The values reported in table 4 include the pre-treatment (Pre-Tx) GLF and post-treatment (Post-Tx) GLF from the 3 plans (GLF, fEUD, ℓEUD). As expected, the GLF plan achieved the best GLF among the three plans. However, fEUD plans achieved varying improvement in GLF over ℓEUD plans. Although in our experiments the fEUD plan typically achieved a better GLF than the ℓEUD plan did, we warn the reader that this may not always be the case: the ℓEUD plan may achieve a better GLF than an fEUD plan in very select perfusion patterns (e.g. consider a liver perfusion pattern with alternating radial strips of high and poor perfusion, each rooted at the PTV).
Table 4.
Pre- and post-treatment GLF achieved by ℓEUD, fEUD and GLF plans on 2D cases.
| Perfusion patterns | Pre-Tx | GLF plan | fEUD plan | ℓEUD plan |
|---|---|---|---|---|
| P1: Large clusters of high and poor perfusion | 0.729 | 0.555 | 0.509 | 0.480 |
| P2: Small regions of high perfusion | 0.926 | 0.922 | 0.908 | 0.890 |
| P3: High perfusion around tumor | 0.769 | 0.558 | 0.524 | 0.521 |
| P4: Poor perfusion around tumor | 0.608 | 0.564 | 0.545 | 0.545 |
| P5: High perfusion throughout | 0.923 | 0.714 | 0.675 | 0.675 |
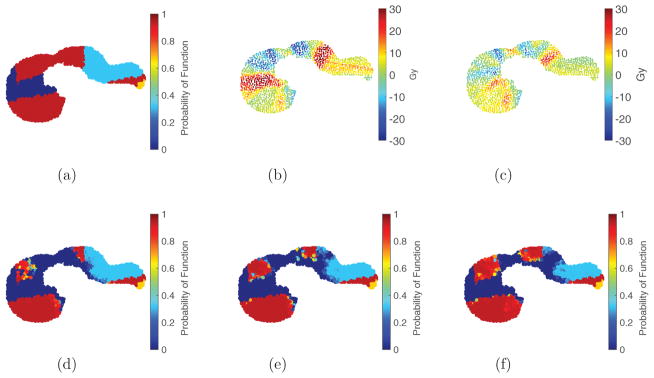
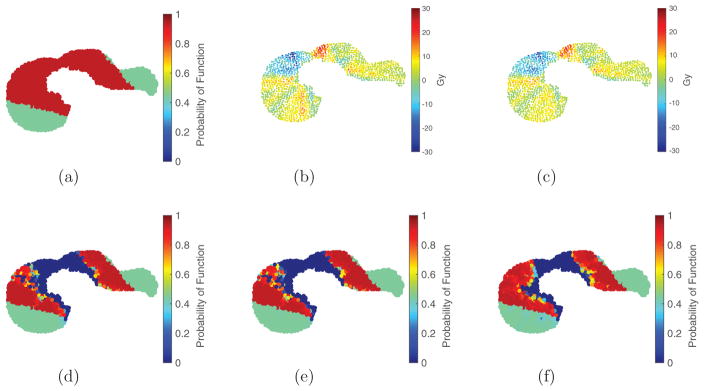
We highlight two patterns, P1 (figure 5(a)) and P3 (figure 6(a)), for their noticeable and limited differences, respectively, in GLF achieved by the fEUD plan over the ℓEUD plan. Figures 5 and 6 provide a visual comparison of the ℓEUD, fEUD, and GLF plans for each of these two cases, and their impacts on liver function. The dose difference between the ℓEUD and GLF plans to each liver voxel is shown in figures 5(b) and 6(b), and the dose difference between the fEUD and GLF plans to each liver voxel is shown in figures 5(c) and 6(c).
Figure 5.
Visualization of pre- and post-treatment liver function maps and dose wash differences for 2D liver perfusion pattern P1: there is noticeable reduction in dose to high-functioning regions using either fEUD or GLF objective. Figure (a), figures (d)–(f) are function maps; figures (b) and (c) are dose wash differences. (a) P1 Pre-Tx function (0.729). (b) Dose wash difference: GLF–ℓEUD. (c) Dose wash difference: GLF–fEUD. (d) Post-Tx function (0.480, ℓEUD plan). (e) Post-Tx function (0.509, fEUD plan). (f) Post-Tx function (0.555, GLF plan).
Figure 6.
Visualization of pre- and post-treatment liver function maps and dose wash differences for 2D liver perfusion pattern P3: there is noticeable reduction in dose to high-functioning regions using GLF objective but limited difference using fEUD objective. Figure (a), figures (d)–(f) are function maps; figures (b) and (c) are dose wash differences. (a) P3 Pre-Tx function (0.769). (b) Dose wash difference: GLF–ℓEUD (c) Dose wash difference: GLF–fEUD. (d) Post-Tx function (0.521, ℓEUD plan). (e) Post-Tx function (0.524, fEUD plan). (f) Post-Tx function (0.558, GLF plan).
3.2. Clinical (3D) liver cases
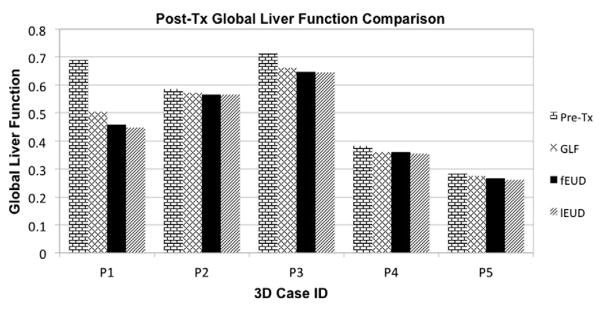
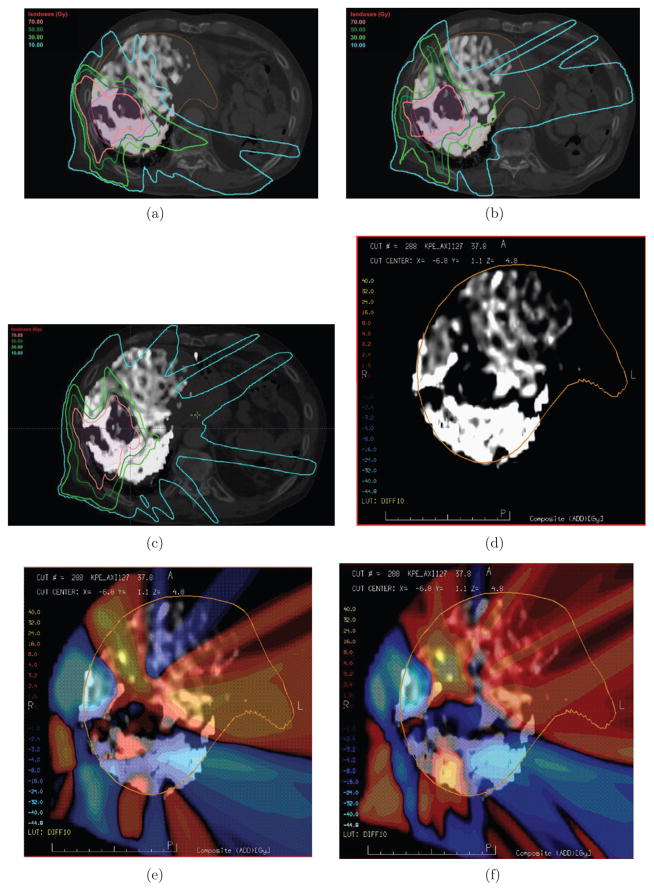
In this section we present results of applying the ℓEUD, fEUD, and GLF models to five real patient cases. We compare the (as in (16)) achieved by the ℓEUD, fEUD, and GLF plans in table 5. GLF values are presented in table 6 and figure 7. Since these patient cases have perfusion patterns that are analogous to certain 2D patterns, we discuss in detail only patient case 1 (PC1), which is an example where the perfusion map led to an appreciable decrease in dose to high-functioning liver using the fEUD model, and an increase in global liver function using the GLF model. Using Eclipse (Varian Medical, Palo Alto, CA) to visualize dose distributions, we show in figures 8(a)–(c) the same axial view from the ℓEUD, fEUD, and GLF plans, respectively. In the background is an axial CT of the patient: the PTV is contoured in pink, and the liver is contoured in orange. The liver is represented separately in figure 8(d) by its gray-scale DCE-MRI perfusion map, which is also overlaid on the axial CTs (figures 8(a)–(c)). Bright/dark coloring represent high/poor perfusion. To see the change in dose at each voxel, we show two dose wash differences (fEUD plan minus ℓEUD plan, and GLF plan minus ℓEUD plan) in figures 8(e) and (f), where lighter color intensities correspond to larger dose differences, and hot/cold colors correspond to positive/negative dose differences.
Table 5.
achieved by ℓEUD, fEUD, and GLF plans on 3D cases.
| Patient Case | ℓEUD Plan | fEUD Plan | GLF Plan |
|---|---|---|---|
| PC1 | 20.3 | 19.4 | 21.7 |
| PC2 | 6.3 | 5.7 | 8.3 |
| PC3 | 6.9 | 7.0 | 8.0 |
| PC4 | 5.8 | 5.4 | 5.4 |
| PC5 | 6.5 | 5.8 | 10.2 |
Table 6.
Pre- and post-treatment GLF achieved by ℓEUD, fEUD, and GLF plans for 3D cases.
| Patient case | Pre-Tx | GLF Plan | fEUD Plan | ℓEUD Plan |
|---|---|---|---|---|
| PC1 | 0.689 | 0.504 | 0.459 | 0.448 |
| PC2 | 0.585 | 0.572 | 0.567 | 0.565 |
| PC3 | 0.712 | 0.661 | 0.647 | 0.645 |
| PC4 | 0.383 | 0.359 | 0.359 | 0.353 |
| PC5 | 0.285 | 0.276 | 0.268 | 0.262 |
Figure 7.
Pre- and post-treatment GLF achieved by ℓEUD, fEUD, and GLF plans on 3D cases. (Note: all cases have some deficit in function at the beginning of treatment.)
Figure 8.
Dose distributions, and their differences, for ℓEUD, fEUD, and GLF plans illustrated for patient case 1. (a) EUD plan, Post-Tx GLF 0.448. (b) fEUD plan, Post-Tx GLF 0.459. (c) GLF plan, Post-Tx GLF 0.504. (d) Perfusion map of liver (grayscale: light = high; dark = low), Pre-Tx GLF 0.689. (e) Dose wash difference (fEUD–ℓEUD) overlaid on perfusion map. (f) Dose wash difference (GLF–ℓEUD) overlaid on perfusion map.
4. Discussion
Although it is unknown which values of GLF are clinically acceptable, the GLF model does produce treatment plans that retain the most liver function compared to the fEUD and ℓEUD models. This is done by delivering dose exceeding the damage saturation threshold to fewer high-functioning voxels. We first discuss the results of 2D cases. Table 3 shows that, for most cases, the fEUD and GLF plans achieve comparable as the ℓEUD plan (albeit dependent on the specific perfusion pattern). Moreover, the plans are guaranteed to achieve adequate target coverage, which is enforced by constraint (3). In certain cases, although there is a notable increase in in the GLF plan from the ℓEUD plan, there is also notable gain in GLF (see figure 4). From the dose wash differences, we observe that applying the fEUD and GLF models may be more effective in reducing dose to highly-perfused liver for particular perfusion patterns than for others. Specifically, the fEUD model follows the intuition that patterns P1, P2, and P4 have more beam paths to the target that are composed of low functioning liver voxels than patterns P3 and P5 do. In figures 5(b) and (c), we see that voxels with the higher perfusion mostly receive less dose, but in order to maintain target coverage, this dose is compensated for by boosting voxels with poor perfusion. However, for pattern P3, observe that although the fEUD plan achieves almost no improvement in post-treatment GLF over the ℓEUD plan (figures 6(b) and (c) look similar due to subtracting similar plans, and consequently so do figures 6(d) and (e)), the GLF plan is able to better preserve additional parts of high-functioning liver and therefore achieves higher post-treatment GLF. Figures 5(c) and 6(c) contrast how the GLF and fEUD objectives prioritize where dose is deposited. The GLF plan achieves better GLF than the fEUD plan by delivering additional dose (red) to both a small region of high-functioning voxels, which are damage-saturated already in the fEUD plan, and large regions of the low-functioning voxels, which contribute little to global function. Thus, accounting for the two dose thresholds in the liver response allows a reduction in physical dose of up to 30 Gy (blue) in a large region of the high-functioning liver.
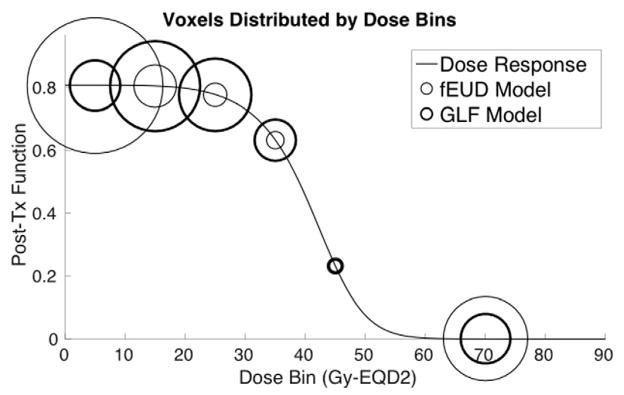
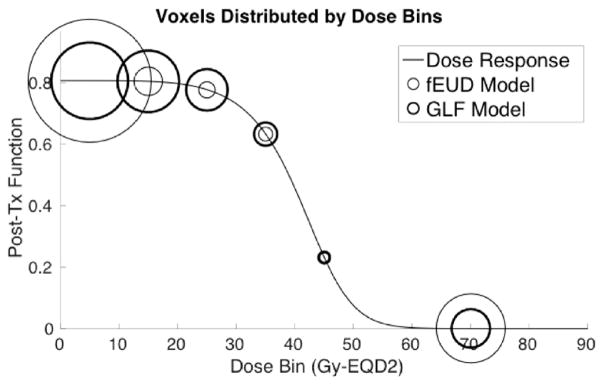
Figure 9 shows how the GLF plan is able to achieve better GLF than the fEUD plan does. The line plot represents the dose-response of the pre-treatment high-functioning liver (the parameters for this dose-response are derived from using the average pre-treatment function of these voxels). The threshold we considered as high-functioning was probability of function ≥ 0.5, i.e. perfusion ≥F0.5. Liver voxels are then grouped into bins by dose for each plan (bin size of 10 Gy-EQD2, with all voxels beyond the damage-saturation threshold of 50 Gy-EQD2 grouped into a single bin) and each bin is represented in the figure by circles, where the diameter of each circle reflects the number of voxels in that bin (thin circles correspond to the fEUD plan while thick circles correspond to the GLF plan). The GLF plan delivers dose beyond the damage-saturation threshold to fewer voxels compared to the fEUD plan, and instead delivers tolerable amounts of dose (e.g. 15–20 Gy-EQD2) to more voxels to achieve comparable target coverage. Since tolerable amounts of dose insignificantly affect post-treatment function, the resulting post-treatment GLF is higher.
Figure 9.
Distribution of voxels with high pre-treatment function by dose-bins of 10 Gy-EQD2 (one bin for dose-saturated voxels) along post-treatment function line-plot; 2D case P1.
Although the differences in dose distributions from 3D patient cases are not as conspicuous as those from the 2D cases, we observe analogous behavior. Qualitatively, patient case 1 has a 3D perfusion map analogous to the 2D perfusion pattern P1 in figure 3(a): large clusters of various perfusion surrounding the tumor. Figures 8 and 10 show this analogous benefit of using a GLF objective. In particular, comparing figures 8(a)–(c), we observe that the bright-green 30 Gy iso-dose line (typically, where damage saturates) is pushed further in toward the PTV and covering less functional liver in the GLF plan, while more highly-perfused liver is covered by the 30 Gy line in the fEUD and ℓEUD plans. Moreover, using the ℓEUD plan as the baseline plan, the dose wash difference in figure 8(f) (GLF–ℓEUD plan) shows a larger reduction in dose to the posterior region of the liver, which is the highest-functioning portion (as seen in figure 8(d)), compared to the dose wash difference in figure 8(e) (fEUD–ℓEUD plan).
Figure 10.
Distribution of voxels with high pre-treatment function by dose-bins of 10 Gy-EQD2 (one bin for dose-saturated voxels) along post-treatment function line-plot; patient case 1.
Our current model considers voxel-based organ function information. A next step is to consider function at a higher level by preserving not only individual high-functioning liver voxels, but also so-called ‘highly functional subvolumes of liver,’ i.e. contiguous groups of voxels—identifying such subvolumes would supplement existing dose-based evaluation criteria. Another direction is to make our model robust by accounting for uncertainty in functional imaging data, e.g. from image registration errors and the perfusion measurements themselves. Finally, since response parameters are currently population-based, we intend to further individualize planning through an adaptive framework by anticipating, part-way through treatment, patient-specific radiosensitivity with patient-specific response parameters (such response models have also been developed in Wang et al (2016)).
5. Conclusion
We developed methods to explicitly incorporate voxel-level liver function information into SBRT treatment planning. The fEUD model can often effectively generate an alternative dose distribution that reduces dose to highly-perfused voxels and increases dose to poorly-perfused voxels (not necessarily by the same amount), while achieving the same target linearized equivalent uniform dose and satisfying dose limits to other critical structures. Although this model is computationally inexpensive in comparison to the GLF model, minimizing fEUD is only a surrogate for maximizing post-treatment global liver function and is not a uniformly good surrogate. Though computationally more expensive, the GLF model directly optimizes expected post-treatment global liver function, a more clinically-relevant metric. The results of this work suggest a need to further investigate numerical methods that more efficiently optimize nonconvex objective functions such as GLF. Although these models are effective for certain types of perfusion patterns, future work consists of quantitatively identifying perfusion patterns that may indicate patient benefit from planning treatment with the fEUD or GLF models.
Acknowledgments
This work has been funded by the University of Michigan MCubed program through the Department of Industrial and Operations Engineering and the Department of Radiation Oncology (Radiation Physics Division), NIH R01-CA132834, and P01-CA59827.
References
- Bowen SR, Saini J, Chapman TR, Miyaoka RS, Kinahan PE, Sandison GA, Wong T, Vesselle HJ, Nyflot MJ, Apisarnthanarax S. Differential hepatic avoidance radiation therapy: proof of concept in hepatocellular carcinoma patients. Radiother Oncol. 2015;115:203–10. doi: 10.1016/j.radonc.2015.04.011. [DOI] [PMC free article] [PubMed] [Google Scholar]
- Cao Y, Alspaugh J, Shen Z, Balter JM, Lawrence TS, Ten Haken RK. A practical approach for quantitative estimates of voxel-by-voxel liver perfusion using dce imaging and a compartmental model. Med Phys. 2006;33:3057–62. doi: 10.1118/1.2219773. [DOI] [PubMed] [Google Scholar]
- Cao Y, Pan C, Balter JM, Platt JF, Francis IR, Knol JA, Normolle D, Ben-Josef E, Ten Haken RK, Lawrence TS. Liver function after irradiation based on computed tomographic portal vein perfusion imaging. Int J Radiat Oncol Biol Phys. 2008;70:154–60. doi: 10.1016/j.ijrobp.2007.05.078. [DOI] [PMC free article] [PubMed] [Google Scholar]
- Cao Y, et al. Prediction of liver function by using magnetic resonance-based portal venous perfusion imaging. Int J Radiat Oncol Biol Phys. 2013;85:258–63. doi: 10.1016/j.ijrobp.2012.02.037. [DOI] [PMC free article] [PubMed] [Google Scholar]
- Chen G-P, Ahunbay E, Schultz C, Li XA. Development of an inverse optimization package to plan nonuniform dose distributions based on spatially inhomogeneous radiosensitivity extracted from biological images. Med Phys. 2007;34:1198–205. doi: 10.1118/1.2710948. [DOI] [PubMed] [Google Scholar]
- Das S, et al. Feasibility of optimizing the dose distribution in lung tumors using fluorine-18-fluorodeoxyglucose positron emission tomography and single photon emission computed tomography guided dose prescriptions. Med Phys. 2004;31:1452–61. doi: 10.1118/1.1750991. [DOI] [PubMed] [Google Scholar]
- Feng M, Kong F-M, Gross M, Fernando S, Hayman JA, Ten Haken RK. Using fluorodeoxyglucose positron emission tomography to assess tumor volume during radiotherapy for non-small-cell lung cancer and its potential impact on adaptive dose escalation and normal tissue sparing. Int J Radiat Oncol Biol Phys. 2009;73:1228–34. doi: 10.1016/j.ijrobp.2008.10.054. [DOI] [PMC free article] [PubMed] [Google Scholar]
- HSL A. Collection of fortran codes for large-scale scientific computation. 2013 (see: www.hsl.rl.ac.uk)
- Ireland RH, Bragg CM, McJury M, Woodhouse N, Fichele S, Van Beek EJ, Wild JM, Hatton MQ. Feasibility of image registration and intensity-modulated radiotherapy planning with hyperpolarized helium-3 magnetic resonance imaging for non-small-cell lung cancer. Int J Radiat Oncol Biol Phys. 2007;68:273–81. doi: 10.1016/j.ijrobp.2006.12.068. [DOI] [PMC free article] [PubMed] [Google Scholar]
- Jackson A, Ten Haken R, Robertson J, Kessler M, Kutcher G, Lawrence T. Analysis of clinical complication data for radiation hepatitis using a parallel architecture model. Int J Radiat Oncol Biol Phys. 1995;31:883–91. doi: 10.1016/0360-3016(94)00471-4. [DOI] [PubMed] [Google Scholar]
- Kessler ML, Mcshan DL, Epelman MA, Vineberg KA, Eisbruch A, Lawrence TS, Fraass BA. Costlets: a generalized approach to cost functions for automated optimization of imrt treatment plans. Optim Eng. 2005;6:421–48. [Google Scholar]
- Kim J, Dogan N, McShan D, Kessler M. An avs-based system for optimization of conformal radiotherapy treatment plans. Proc of AVS. 1995:417–31. [Google Scholar]
- Li XA, et al. The use and qa of biologically related models for treatment planning: short report of the tg-166 of the therapy physics committee of the aapm. Med Phys. 2012;39:1386–409. doi: 10.1118/1.3685447. [DOI] [PubMed] [Google Scholar]
- Liu E, Stenmark MH, Schipper MJ, Balter JM, Kessler ML, Caoili EM, Lee OE, Ben-Josef E, Lawrence TS, Feng M. Stereotactic body radiation therapy for primary and metastatic liver tumors. Trans Oncol. 2013;6:442–6. doi: 10.1593/tlo.12448. [DOI] [PMC free article] [PubMed] [Google Scholar]
- Miften MM, Das SK, Su M, Marks LB. Incorporation of functional imaging data in the evaluation of dose distributions using the generalized concept of equivalent uniform dose. Phys Med Biol. 2004;49:1711. doi: 10.1088/0031-9155/49/9/009. [DOI] [PubMed] [Google Scholar]
- Niemierko A. A generalized concept of equivalent uniform dose (EUD) Med Phys. 1999;26:1100. doi: 10.1118/1.598063. [DOI] [PubMed] [Google Scholar]
- Pandharipande PV, Krinsky GA, Rusinek H, Lee VS. Perfusion imaging of the liver: current challenges and future goals. Radiology. 2005;234:661–73. doi: 10.1148/radiol.2343031362. [DOI] [PubMed] [Google Scholar]
- Seppenwoolde Y, et al. Optimizing radiation treatment plans for lung cancer using lung perfusion information. Radiother Oncol. 2002;63:165–77. doi: 10.1016/s0167-8140(02)00075-0. [DOI] [PubMed] [Google Scholar]
- Thieke C, Bortfeld T, Küfer K-H. Characterization of dose distributions through the max and mean dose concept. Acta Oncol. 2002;41:158–61. doi: 10.1080/028418602753669535. [DOI] [PubMed] [Google Scholar]
- Wächter A, Biegler LT. On the implementation of an interior-point filter line-search algorithm for large-scale nonlinear programming. Math Program. 2006;106:25–57. [Google Scholar]
- Wahl DR, Stenmark MH, Tao Y, Pollom EL, Caoili EM, Lawrence TS, Schipper MJ, Feng M. Outcomes after stereotactic body radiotherapy or radiofrequency ablation for hepatocellular carcinoma. J Clin Oncol. 2015;34:452–9. doi: 10.1200/JCO.2015.61.4925. [DOI] [PMC free article] [PubMed] [Google Scholar]
- Wang H, Feng M, Jackson A, Ten Haken RK, Lawrence TS, Cao Y. Local and global function model of the liver. Int J Radiat Oncol Biol Phys. 2016;94:181–8. doi: 10.1016/j.ijrobp.2015.09.044. [DOI] [PMC free article] [PubMed] [Google Scholar]
- Zhang J, Ma J, Zhou S, Hubbs JL, Wong TZ, Folz RJ, Evans ES, Jaszczak RJ, Clough R, Marks LB. Radiation-induced reductions in regional lung perfusion: 0.1–12 year data from a prospective clinical study. Int J Radiat Oncol Biol Phys. 2010;76:425–32. doi: 10.1016/j.ijrobp.2009.02.005. [DOI] [PubMed] [Google Scholar]


