

Abstract
Importance
Preclinical Alzheimer disease (AD) can be staged using a 2-factor model denoting the presence or absence of β-amyloid (Aβ+/−) and neurodegeneration (ND+/−). The association of these stages with longitudinal biomarker outcomes is unknown.
Objective
To examine whether longitudinal Aβ accumulation and hippocampal atrophy differ based on initial preclinical staging.
Design, Setting, and Participants
This longitudinal population-based cohort study used data collected at the Knight Alzheimer Disease Research Center, Washington University, St Louis, Missouri, from December 1, 2006, to June 31, 2015. Cognitively normal older adults (n = 174) were recruited from the longitudinal Adult Children Study and Healthy Aging and Senile Dementia Study at the Knight Alzheimer Disease Research Center. At baseline, all participants had magnetic resonance imaging (MRI) scans, positron emission tomography (PET) scans with carbon 11-labeled Pittsburgh Compound B (PiB), and cerebrospinal fluid assays of tau and phosphorylated tau (ptau) acquired within 12 months. Using the baseline biomarkers, individuals were classified into preclinical stage 0 (Aβ−/ND−), 1 (Aβ+/ND−), or 2+ (Aβ+/ND+) or suspected non-AD pathophysiology (SNAP; Aβ−/ND+).
Main Outcomes and Measures
Subsequent longitudinal accumulation of Aβ assessed with PiB PET and loss of hippocampal volume assessed with MRI in each group.
Results
Among the 174 participants (81 men [46.6%]; 93 women [53.4%]; mean [SD] age, 65.7 [8.9] years), a proportion (14%-17%) of individuals with neurodegeneration alone (SNAP) later demonstrated Aβ+. The rates of Aβ accumulation and loss of hippocampal volume in individuals with SNAP were indistinguishable from those without any pathologic features at baseline (for Aβ accumulation: when hippocampal volume was used to define ND, t = 0.00 [P > .99]; when tau and ptau were used to define ND, t = −0.02 [P = .98]; for loss of hippocampal volume: when hippocampal volume was used to define ND, t = −1.34 [P = .18]; when tau and ptau were used to define ND, t = 0.84 [P = .40]). Later preclinical stages (stages 1 and 2+) had elevated Aβ accumulation. Using hippocampal volume to define ND, individuals with stage 1 had accelerated Aβ accumulation relative to stage 0 (t = 11.06; P < .001), stage 2+ (t = 2.10; P = .04), and SNAP (t = 9.32; P < .001), and those with stage 2+ had accelerated Aβ accumulation relative to stage 0 (t = 4.38; P < .001) and SNAP (t = 4.08; P < .001). When ND was defined using tau and ptau, individuals with stage 2+had accelerated Aβ accumulation relative to stage 0 (t = 4.96) and SNAP (t = 4.06), and those with stage 1 had accelerated Aβ accumulation relative to stage 0 (t = 8.44) and SNAP (t = 6.61) (P < .001 for all comparisons). When ND was defined using cerebrospinal fluid biomarkers, individuals with stage 2+ had accelerated hippocampal atrophy relative to stage 0 (t = −3.41; P < .001), stage 1 (t = −2.48; P = .03), and SNAP (t = −2.26; P = .03).
Conclusions and Relevance
More advanced preclinical stages of AD have greater longitudinal Aβ accumulation. SNAP appears most likely to capture inherent individual variability in brain structure or to represent comorbid pathologic features rather than early emerging AD. Low hippocampal volumes or elevated levels of tau or ptau in isolation may not accurately represent ongoing neurodegenerative processes.
As with many neurodegenerative diseases, pathophysiological processes in Alzheimer disease (AD) begin well before the onset of clinical symptoms. Using cerebro-spinal fluid (CSF) assays and neuroimaging, detection of preclinical β-amyloid (Aβ) deposition in the brain and purported markers of neurodegeneration (ND) are possible. Based on proposed and observed temporal orderings of biomarkers,1-5 a National Institute on Aging–Alzheimer's Association (NIA-AA) workgroup developed recommendations for the staging of preclinical AD.6
According to the NIA-AA guidelines, Aβ deposition can be measured in vivo using CSF assays or positron emission tomography (PET), and ND can be assessed in CSF assays, fluorodeoxyglucose PET, or volumetric magnetic resonance imaging (MRI). In stage 1, evidence of β-amyloidosis only is found; in stage 2, evidence of β-amyloidosis and ND; and in stage 3, both biomarkers are abnormal along with subtle cognitive declines. Additional suggestions have been proposed7,8 to incorporate individuals with no abnormal biomarkers (stage 0), and those with evidence of ND in the absence of abnormal Aβ levels, termed suspected non-AD pathophysiology (SNAP).7
This 2-factor model of pathologic features has been applied to cognitively normal older adults,7,9-16 patients at memory clinics,17,18 and cognitively impaired individuals.19-22 The proportion of individuals classified as having SNAP ranges from 12% to 29%, with similar percentages across cohorts. Work by Knopman and colleagues16 indicate that SNAP cohorts are comparable to individuals with Aβ-positive findings on levels of cerebrovascular disease, α-synucleinopathy, and other imaging and clinical features. This work, and parallel work examining incident amyloid positivity,23 indicates that the appearance of neuronal injury biomarkers may not depend on the presence of Aβ and could represent multiple abnormalities. Alternatively, such biomarkers could represent pathologic features of AD, but precede evidence of amyloidosis.24,25
Given its substantial portion in cross-sectional studies, SNAP has deservedly received more in-depthattention.25 The objective of the present study was to examine longitudinal Aβ accumulation and ND in each preclinical stage and individuals classified as having SNAP. Because both biomarkers have been used in the literature, we defined ND at baseline using hippocampal volume and CSF measures of tau and phosphorylated tau (ptau) 181.
Methods
Participants
We drew 174 participants from the Adult Children Study and the Healthy Aging and Senile Dementia Study through the Knight Alzheimer Disease Research Center, Washington University in St Louis, St Louis, Missouri, based on the following criteria: baseline clinical examination, PET with carbon 11–labeled Pittsburgh Compound B (PiB), and MRI within 12 months; cognitively normal (Clinical Dementia Rating score, 0)26 at baseline; and at least 1 subsequent PET session. Demographic characteristics are presented in Table 1. A subset of 110 individuals also had CSF samples drawn within 12 months of the baseline PiB PET assessment. Longitudinal volumetric information was available for 171 participants. Written informed consent was obtained from all participants, and the Human Research Protection Office of Washington University in St Louis approved all procedures.
Table 1. Baseline Demographic Characteristics of Entire Cohort Using Different Definitions of NDa.
| Characteristic | HCVz-Defined ND | CSF Tau- and pTau 181–Defined ND | ||||||
|---|---|---|---|---|---|---|---|---|
| Stage 0 (n = 98) | Stage 1 (n = 31) | Stage 2+ (n = 11) | SNAP (n = 34) | Stage 0 (n = 72) | Stage 1 (n = 14) | Stage 2+ (n = 12) | SNAP (n = 12) | |
| Female sex, No. (%) | 59 (60.2) | 20 (64.5) | 7 (63.6) | 7 (20.6) | 47 (65.3) | 11 (78.6) | 7 (58.3) | 8 (66.7) |
| APOE ε4+, No. (%) | 18 (18.4) | 20 (64.5) | 7 (63.6) | 7 (20.6) | 13 (18.1) | 10 (71.4) | 7 (58.3) | 2 (16.7) |
| Age, y | 63.9 (8.1) | 69.6 (8.3) | 72.3 (8.3) | 65.2 (9.9) | 63.4 (8.5) | 66.6 (7.4) | 71.6 (5.5) | 67.4 (5.6) |
| Educational level, yb | 15.9 (2.4) | 16.3 (2.2) | 15.6 (3.0) | 15.4 (2.6) | 15.8 (2.5) | 16.3 (2.1) | 15.7 (2.4) | 16.9 (2.0) |
| MMSE score | 29.0 (1.1) | 29.3 (1.0) | 28.1 (1.9) | 29.1 (1.2) | 29.0 (1.2) | 29.2 (1.1) | 28.9 (1.9) | 28.7 (1.2) |
| PET follow-up, No. of visits | 2.3 (0.5) | 2.3 (0.5) | 2.0 (0) | 2.3 (0.5) | 2.3 (0.5) | 2.3 (0.5) | 2.3 (0.5) | 2.6 (0.5) |
| PET follow-up, d | 51.8 (16.6) | 42.7 (24.2) | 35.5 (15.4) | 49.7 (19.6) | 51.7 (17.9) | 46.1 (23.3) | 41.2 (26.3) | 60.7 (13.8) |
| MRI follow-up, No. of visits | 2.5 (0.7) | 2.7 (0.7) | 2.2 (0.4) | 2.5 (0.6) | 2.5 (0.6) | 2.8 (0.7) | 2.6 (0.7) | 2.8 (0.6) |
| MRI follow-up, mo | 54.4 (17.9) | 52.1 (25.2) | 41.5 (16.8) | 53.3 (18.3) | 54.5 (18.5) | 57.8 (25.0) | 48.7 (25.9) | 65.1 (12.2) |
| MCBP | 0.12 (0.05) | 0.70 (0.47) | 0.99 (0.70) | 0.12 (0.05) | 0.12 (0.05) | 0.60 (0.37) | 1.07 (0.58) | 0.12 (0.06) |
| HCVz | 0.38 (0.47) | .039 (0.52) | −0.70 (0.24) | −0.68 (0.32) | 0.11 (0.62) | 0.17 (0.62) | −0.09 (0.44) | −0.10 (0.66) |
| Hippocampal volume, mm3 | 8028.0 (603.9) | 7742.3 (833.0) | 6318.1 (641.0) | 6757.8 (770.5) | 7754.5 (770.1) | 7700.0 (788.6) | 7062.9 (732.4) | 7325.6 (928.9) |
| Tau level, pg/mLc | 220.4 (89.0) | 383.6 (195.4) | 359.5 (203.2) | 239.7 (127.9) | 194.2 (52.1) | 247.2 (50.2) | 530.6 (186.6) | 411.7 (114.8) |
| pTau 181 level, pg/mLc | 46.5 (19.0) | 70.5 (33.7) | 68.6 (33.2) | 51.0 (25.8) | 41.6 (9.9) | 46.8 (8.9) | 97.2 (29.6) | 83.5 (30.4) |
Abbreviations: APOE, apolipoprotein E; CSF, cerebrospinal fluid; HCVz, hippocampal age-adjusted z score; MCBP, mean cortical binding potential; MMSE, Mini-Mental State Examination; MRI, magnetic resonance imaging; ND, neuronal degeneration; PET, positron emission tomography; pTau, phosphorylated tau; SNAP, suspected Non-Alzheimer disease pathophysiology.
Stages are described in the Introduction. Unless otherwise indicated, data are expressed as mean (SD).
Not available for 8 individuals.
For the HCVz analysis, includes 63 participants in the stage 0 cohort, 20 in the stage 1 cohort, 6 in the stage 2+ cohort, and 21 in the SNAP cohort.
PET Imaging
Methods of PET imaging have been described elsewhere.27,28 Participants underwent a 60-minute dynamic scan with PiB. In each region, a tissue mask (gray matter, white matter, and CSF) was generated based on the FreeSurfer segmentation.29 A regional spread function–based technique28,30 was used to correct for partial volume effects and obtain corrected regional time-activity curves. Binding potentials were calculated using the corrected regional time-activity curves in each region of interest with a cerebellar gray reference region. A mean of the data across the left and right lateral orbitofrontal, medial orbitofrontal, rostral middle frontal, superior frontal, superior temporal, middle temporal, and precuneus regions was used to create a mean cortical binding potential (MCBP).
MRI Data
We acquired T1-weighted magnetization-prepared rapid gradient-echo sequences on 1 of 2 3T MRI scanners (TIM Trio; Siemens) with 1-mm isotropic resolution (repetition time, 2400 milliseconds; flip angle, 8°; and field of view, 256 × 256 mm). Hippocampal volumes were obtained using FreeSurfer (version 5.1; http://freesurfer.net/) and adjusted for total intra-cranial volume using a regression approach. For classification into preclinical stages, hippocampal volumes were converted to age-adjusted z scores (HCVz) relative to a normative cohort of 196 individuals (mean age, 64.8 [range, 43-90] years; 128 women [65.3%]; 45 apolipoprotein E [APOE] ε4 carriers [23.0%]) partially overlapping with the present sample who had negative findings for any PiB PET biomarker or Aβ42 data within a year of the scan and remained cognitively normal for at least 3 years. A mean z score was calculated for the left and right sides together. By converting hippocampal volume to z scores, ND can be interpreted as a reduced volume relative to the individual's peers, and such approaches are common in the literature.31-33
CSF Samples
The CSF samples (20-30 mL) were collected after overnight fasting as described previously.34 Total tau and ptau 181 levels were measured using an enzyme-linked immunosorbent assay (INNOTEST; Fujirebio [formerly Innogenetics]).
NIA-AA Classification
Participants were classified using a 2-factor model10-13,23 denoting abnormality of Aβ (Aβ+/−) and ND (ND+/−) biomarkers. Individuals with Aβ−/ND− were designated as stage 0; Aβ+ only, as stage 1; Aβ+/ND+, as stage 2+ (combined stages 2 and 3); and ND+/Aβ− as SNAP. Although the initial preclinical stages6 included a stage 3 (Aβ+/ND+ with subtle cognitive impairment), the definition of impairment has not been established in the field. As a result, we combined stages 2 and 3 into a single stage 2+ category.
Abnormal PiB PET Aβ levels and HCVz were determined using a receiver operating characteristics curve to maximize the Youden index (sensitivity + specificity −1) that best differentiated a population of cognitively normal older adults (n = 212) from those with a Clinical Dementia Rating score of 0.5 and a clinical diagnosis of AD (59 patients with PiB PET findings; 141 patients with hippocampal volume findings). The age-adjusted HCVz was used to classify ND at baseline to prevent ND from being a proxy for older age. Cutoffs to determine CSF abnormality were taken from previously published work14 using the Youden index in a similar population. Abnormality was defined as a corrected MCBP greater than 0.23, HCVz less than −0.3023, tau level greater than 339 pg/mL; and ptau 181 level greater than 67 pg/mL.
Owing to potential incongruences in markers of ND,35 participants were classified into NIA-AA stages at baseline in 2 ways. For the first set of analyses, baseline ND+ was defined using only HCVz. Because the 2 values were highly correlated (r = 0.81; 91.8% concordance), in the second set of analyses ND+ was defined if tau or ptau 181 levels were abnormal. For both sets of analyses, Aβ+ was defined using PiB PET. Using these baseline NIA-AA classifications, we then examined longitudinal Aβ deposition and hippocampal volume (in cubic millimeters).
Statistical Analysis
Baseline differences in demographic features across NIA-AA subgroups were analyzed using analysis of variance for continuous variables and the χ2 test or logistic regression models for categorical variables. Longitudinal data were analyzed in 2 ways. The first method used a χ2 analysis to examine the proportion of individuals in each NIA-AA stage who were Aβ+ or ND+ at any subsequent longitudinal time point (eFigure and eTable in the Supplement).
The second set of analyses used linear mixed-effects models implemented in the R software suite36 using the nlme package.37 With this approach we examined the longitudinal rate of Aβ accumulation or hippocampal change in each NIA-AA group, modeling the individual as a random effect and controlling for baseline age and sex. Time at each data point was quantified as months after the initial baseline visit. When examining the main effect of group, stage 0 was set as the reference group. When examining the main effect of sex, female participants were set as the reference group. The B values represent a change in the outcome (eg, MCBP) with a 1-unit change of the variable (eg, female to male, 1 year of age, and 1 month of time).
Results
Preclinical AD Stages
The final sample included 174 participants, of whom 81 were men (46.6%) and 93 were women (53.4%), with a mean (SD) age of 65.7 (8.9) years. Baseline frequencies of each NIA-AA stage are presented in Table 1 with sampled emographics. Educational levels were not available for 8 individuals.
Demographics Using HCVz and PiB PET
We found a main effect of NIA-AA stage on age (F3,170 = 5.75; P < .001). The stages 1 and 2+ cohorts were significantly older than the stage 0 (t = 3.20 [P = .002] and t = 3.08 [P = .002], respectively) and SNAP (t = 2.06 [P = .04] and t = 2.39 [P = .02], respectively) cohorts. Mini-Mental State Examination scores differed (F3,170 = 2.91; P = .04), with the stage 0 (t = 2.51; P = .01) and stage 1 (t = 2.95; P = .004) cohorts having higher scores than the stage 2+ cohort. The APOE ε4 distribution differed significantly among the stages (χ2 = 31.3; P < .001), with a greater frequency in the stage 1 compared with stage 0 (χ2 = 24.1; P < .001) and SNAP (χ2 = 12.9; P < .001) cohorts and the stage 2+ cohort having a greater frequency than the stage 0 (χ2 = 11.5; P < .001) and SNAP (χ2 = 7.2; P = .007) cohorts. We found no significant differences in the number of visits for MRI or the days of MRI follow-up or between the numbers of visits for MRI (χ2 = 9.9; P = .36) or PET (χ2 = 5.6; P = .46). However, we found a significant effect on days of PET follow-up (F3,170 = 3.82; P = .01), with the stage 0 cohort having more days of follow-up than the stage 2+ (t = 2.73; P = .007) and stage 1 (t = 2.37; P = .02) cohorts. In the subset with CSF findings, we found a main effect on tau level (F3,106 = 9.53; P < .001), with the stages 1 and 2+ cohorts having higher levels than the stage 0 (t = 4.96 [P < .001] and t = 2.53 [P = .01], respectively) and SNAP (t = 3.58 [P = .001] and t = 2.01 [P = .047], respectively) cohorts. We found an effect on ptau 181 level (F3,106 = 5.92; P < .001), with the stage 1 (t = 3.88; P < .001) and stage 2+ (t = 2.14; P = .04) cohorts having higher levels than the stage 0 cohort and the stage 1 cohort having elevated levels relative to the SNAP cohort (t = 2.59; P = .01).
Demographics Using CSF Tau and pTau 181 Levels
When we examined baseline demographics using PiB PET and CSF measures of tau and ptau 181 levels to classify participants into NIA-AA stages, we found significant group effects on age (F3,106 = 4.30; P = .0071), with the stage 2+ cohort being older than the stage 0 cohort (t = 3.32; P = .001). We found a significant difference in APOE ε4 frequency (χ2 = 22.3; P < .001), with higher frequencies in the stage 1 cohort relative to the stage 0 (χ2 = 17.0; P < .001) and SNAP (χ2 = 7.8; P < .001) cohorts and the stage 2+ cohort more than the stage 0 cohort (χ2 = 9.2; P = .002). We found no significant effects for educational level (F3,98 = 0.87; P = .46), Mini-Mental State Examination score (F3,106 = 0.43; P = .73), the number of longitudinal PET (χ2 = 5.6; P = .46) or MRI (χ2 = 5.6; P = .46) visits, or the length of PET (F3,106 = 2.3; P = .08) or MRI (F3,106 = 2.3; P = .08) follow-up. We found no main effect on HCVz volume (F3,106 = 0.84; P = .47), although a significant effect on hippocampal volumes (F3,106 = 3.32; P = .02) occurred, with the stage 2+ cohort having smaller adjusted volumes than the stage 0 (t = 2.82; P = .006) and stage 1 (t = 2.06; P = .04) cohorts.
Linear Mixed Models
Aβ Accumulation Using HCVz to Denote ND
Longitudinal changes in PiB deposition (MCBP) within individuals are depicted in Figure 1A, which illustrates change in each cohort using the coefficients derived from the linear mixed models. The main effects and interaction results from the linear mixed models are presented in Table 2. The intercept represents the mean baseline MCBP in stage 0 (reference group) accounting for covariates. The stages 1 and 2+ cohorts had a higher baseline MCBP compared with the stage 0 cohort, but the stage 0 and SNAP cohorts did not differ. Levels of Aβ accumulation increased longitudinally in all 4 groups (P < .01 for all). We found no difference in this increase between the stage 0 and SNAP cohorts, and the longitudinal increase in the stage 1 cohort was significantly greater than that observed in the SNAP, stage 0, and stage 2+ cohorts. The increase in the stage 2+ cohort was significantly greater than in the SNAP and stage 0 cohorts.
Figure 1. Longitudinal Change in β-Amyloid (Aβ) Deposition Across Preclinical Stages of Alzheimer Disease.
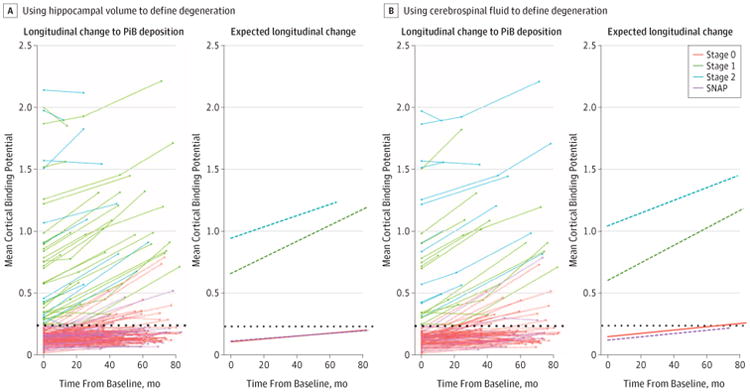
Stages are determined using the recommendations of the National Institute on Aging–Alzheimer Association described in the Introduction. Deposition of Aβ is measured by positron emission tomography with carbon 11–labeled Pittsburgh Compound B (PiB). Rates of change in Aβ deposition in individuals and for the groups are assessed using hippocampal volumes converted to age-adjusted z scores (HCVz) to define neurodegeneration (A) and using cerebrospinal fluid levels of tau and phosphorylated tau 181 (B) to define neurodegeneration at baseline. The dotted line represents an abnormal level of amyloid defined by mean cortical binding potential. SNAP indicates suspected non–Alzheimer disease pathophysiology.
Table 2. Linear Mixed Models Examining Longitudinal Aβ Accumulation Across NIA-AA Staging Groupsa.
| Model Variable | Aβ Accumulation | ||
|---|---|---|---|
| B Value (SE) | t Value | P Value | |
| ND defined by HCVz | |||
| Intercept | 0.1257 (0.0316) | 3.66 | <.001 |
| Male sex | 0.0412 (0.0419) | 0.98 | .34 |
| Age | 0.0040 (0.0023) | 1.71 | .09 |
| Stage 1 | 0.5474 (0.0551) | 9.94 | <.001 |
| Stage 2+ | 0.8317 (0.0850) | 9.78 | <.001 |
| SNAP | −0.0022 (0.0526) | −0.04 | .97 |
| Stage 0 × time | 0.0010 (0.0002) | 4.74 | <.001 |
| Stage 1 × time | 0.0065 (0.0004) | 14.73 | <.001 |
| Stage 2+ × time | 0.0046 (0.0008) | 5.88 | <.001 |
| SNAP × time | 0.0010 (0.0004) | 2.73 | .007 |
| Longitudinal slopes | |||
| Stage 0 vs 1 | −0.0054 (0.0005) | −11.06 | <.001 |
| Stage 0 vs 2+ | −0.0036 (0.0008) | −4.38 | <.001 |
| Stage 0 vs SNAP | 0.0000 (0.0004) | 0.00 | >.99 |
| Stage 1 vs 2+ | 0.0019 (0.0009) | 2.10 | .04 |
| Stage 1 vs SNAP | 0.0054 (0.0006) | 9.32 | <.001 |
| Stage 2+ vs SNAP | 0.0036 (0.0009) | 4.08 | <.001 |
| ND defined by CSF ptau level | |||
| Intercept | 0.1469 (0.0320) | 4.59 | <.001 |
| Male sex | −0.0460 (0.0464) | −0.99 | .32 |
| Age | 0.0058 (0.0028) | 2.04 | .04 |
| Stage 1 | 0.4533 (0.0676) | 6.70 | <.001 |
| Stage 2+ | 0.8951 (0.0748) | 11.96 | <.001 |
| SNAP | −0.0305 (0.0722) | −0.42 | .67 |
| Stage 0 × time | 0.0013 (0.0003) | 4.96 | <.001 |
| Stage 1 × time | 0.0071 (0.0006) | 11.18 | <.001 |
| Stage 2+ × time | 0.0052 (0.0007) | 7.02 | <.001 |
| SNAP × time | 0.0013 (0.0006) | 2.18 | .03 |
| Longitudinal slopes | |||
| Stage 0 vs 1 | −0.0058 (0.0007) | −8.44 | <.001 |
| Stage 0 vs 2+ | −0.0039 (0.0008) | −4.96 | <.001 |
| Stage 0 vs SNAP | 0.0000 (0.0007) | −0.02 | .98 |
| Stage 1 vs 2+ | 0.0019 (0.0010) | 1.96 | .052 |
| Stage 1 vs SNAP | 0.0058 (0.0009) | 6.61 | <.001 |
| Stage 2+ vs SNAP | 0.0039 (0.0010) | 4.06 | <.001 |
Abbreviations: Aβ, β-amyloid; CSF, cerebrospinal fluid; HCVz, hippocampal age-adjusted z scores; ND, neuronal degeneration; NIA-AA, National Institute on Aging–Alzheimer's Association; ptau, phosphorylated tau; SNAP, suspected non-Alzheimer disease pathophysiology.
Stages are described in the Introduction.
Aβ Accumulation Using CSF to Denote ND
Longitudinal changes in Aβ levels are presented in Figure 1B, and statistical results are in Table 2. We found a change in baseline MCBP when comparing the stage 0 with stage 1 and the stage 0 with stage 2+ cohorts, but no differences between the stage 0 and SNAP cohorts. We found a significant longitudinal increase in Aβ levels for all 4 cohorts (P < .05 for all). No differences in these longitudinal increases were seen between the stage 0 and SNAP cohorts. The longitudinal increase in the stage 1 cohort was significantly greater than in the SNAP and stage 0 cohorts, but differences were not significant compared with the stage 2+ cohort (t = 2.0; P = .052). The increase in the stage 2+ cohort was significantly greater than in the SNAP and stage 0 cohorts. The results across the stages were highly similar across classification schemes.
Hippocampal Atrophy Using HCVz to Denote ND
Longitudinal changes in hippocampal volume are depicted in Figure 2A, and statistical results are presented in Table 3. Results looking at longitudinal change in HCVz are presented in the eFigure and eTable in the Supplement. The stage 2+ and SNAP cohorts had lower baseline hippocampal volumes compared with the stage 0 cohort (t = −7.40 [P < .001] and t = −11.59 [P < .001], respectively). Significant atrophy occurred in all 4 groups (P < .001 for all). Numerically atrophy was the slowest in the SNAP cohort, although this was only significant compared with the stage 1 cohort (t = −1.98; P = .049).
Figure 2. Longitudinal Change in Hippocampal Volume Across Preclinical Stages of Alzheimer Disease (AD).
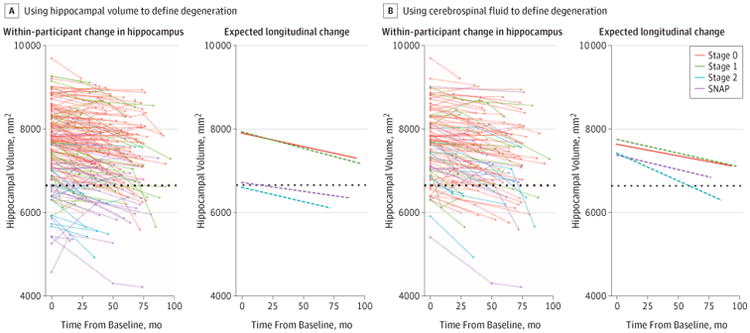
Stages are determined using the recommendations of the National Institute on Aging–Alzheimer Association described in the Introduction. Rates of change in hippocampal volume in individuals and by stages use hippocampal volumes converted to age-adjusted z scores (HCVz) (A) and cerebrospinal fluid levels of tau and phosphorylated tau 181 (B) to define neurodegeneration at baseline. The dotted line represents an abnormal level of neurodegeneration defined by hippocampal volume. SNAP indicates suspected non-AD pathophysiology.
Table 3. Linear Mixed Models Examining Longitudinal Total Hippocampal Volume Across NIA-AA Staging Groupsa.
| Model Variable | Hippocampal Atrophy | ||
|---|---|---|---|
| B Value (SE) | t Value | P Value | |
| ND defined by HCVz | |||
| Intercept | 7892.32 (63.59) | 124.11 | <.001 |
| Male sex | 152.47 (83.98) | 1.82 | .07 |
| Age | −54.77 (4.70) | −11.66 | <.001 |
| Stage 1 | 36.95 (110.12) | 0.34 | .74 |
| Stage 2+ | −1278.74 (176.63) | −7.24 | <.001 |
| SNAP | −1182.63 (105.29) | −11.23 | <.001 |
| Stage 0 × time | −6.25 (0.73) | −8.52 | <.001 |
| Stage 1 × time | −7.81 (1.33) | −5.86 | <.001 |
| Stage 2+ × time | −6.94 (2.68) | −2.59 | .01 |
| SNAP × time | −4.12 (1.25) | −3.29 | .001 |
| Longitudinal slopes | |||
| Stage 0 vs 1 | 1.63 (1.48) | 1.10 | .27 |
| Stage 0 vs 2+ | 0.99 (2.72) | 0.36 | .72 |
| Stage 0 vs SNAP | −1.88 (1.41) | −1.34 | .18 |
| Stage 1 vs 2+ | −0.64 (2.92) | −0.22 | .83 |
| Stage 1 vs SNAP | −3.51 (1.77) | −1.98 | .049 |
| Stage 2+ vs SNAP | −2.87 (2.89) | −0.99 | .32 |
| ND defined by CSF ptau level | |||
| Intercept | 7647.58 (100.80) | 75.87 | <.001 |
| Male sex | 116.45 (146.43) | 0.80 | .43 |
| Age | −46.14 (9.12) | −5.06 | <.001 |
| Stage 1 | 108.03 (210.79) | 0.52 | .61 |
| Stage 2+ | −221.03 (240.26) | −0.92 | .36 |
| SNAP | −252.86 (225.52) | −1.14 | .26 |
| Stage 0 × time | −5.59 (0.76) | −7.31 | <.001 |
| Stage 1 × time | −6.55 (1.64) | −4.20 | .001 |
| Stage 2+ × time | −13.07 (2.06) | −6.25 | <.001 |
| SNAP × time | −7.12 (1.64) | −4.32 | <.001 |
| Longitudinal slopes | |||
| Stage 0 vs 1 | 0.96 (1.80) | 0.53 | .60 |
| Stage 0 vs 2+ | 7.48 (2.20) | 3.41 | <.001 |
| Stage 0 vs SNAP | 1.52 (1.81) | 0.84 | .40 |
| Stage 1 vs 2+ | 6.52 (2.63) | 2.48 | .01 |
| Stage 1 vs SNAP | 0.56 (2.32) | 0.24 | .81 |
| Stage 2+ vs SNAP | −5.96 (2.63) | −2.26 | .03 |
Abbreviations: CSF, cerebrospinal fluid; HCVz, hippocampal age-adjusted z scores; ND, neuronal degeneration; NIA-AA, National Institute on Aging–Alzheimer's Association; ptau, phosphorylated tau; SNAP, suspected non-Alzheimer disease pathophysiology.
Stages are described in the Introduction.
Hippocampal Atrophy Using CSF to Denote ND
Longitudinal changes in hippocampal volume are presented in Figure 2B, and results are presented in Table 3. Results looking at longitudinal change in HCVz are presented in the eFigure and eTable in the Supplement. We found no significant differences in baseline hippocampal volume. The stage 2+cohort demonstrated greater atrophy than the stage 0 (t = 3.31; P < .0001), stage 1 (t = 2.28; P = .01), and SNAP (t = 2.19; P = .03) cohorts.
Discussion
We performed analyses examining longitudinal Aβ deposition and hippocampal atrophy in cognitively normal individuals grouped according to NIA-AA staging criteria. A proportion (14%-17%) of individuals classified as Aβ− and ND+ (SNAP) at baseline become Aβ+ over time and subsequently would shift into a canonical AD preclinical classification. In the longitudinal rates of Aβ accumulation and hippocampal atrophy, the SNAP cohort was near identical to the stage 0 cohort. As predicted by their later disease stage, individuals classified as stage 1 or 2+ have greater baseline levels and rates of Aβ accumulation than the stage 0 and SNAP cohorts. Our work is consistent with prior reports denoting that more advanced preclinical stages have greater Aβ accumulation10 and hippocampal volume loss.10,12
Proposed patterns of biomarker progression1-5 place elevated levels of amyloid before neuronal dysfunction and ND. Work using preclinical staging has raised the possibility that the initial appearance of brain injury biomarkers may not depend on β-amyloidosis.24,25 The fact that apportion of our SNAP cohort later show elevated Aβ levels would be consistent with this interpretation. However, this atypical temporal ordering could result from other causes. One explanation is that true discrepancies may exist in the detectable temporal profiles of Aβ and ND in AD.24 Neuropathologic studies demonstrate that tau pathology in limbic regions precede Aβ pathology,38 and at least some level of tau pathology is present in middle age39-43 or earlier.44 However, this age-related tau accumulation alone is thought to be insufficient to cause ND42,45,46 in the absence of Aβ accumulation.10,42,47
Alternatively, the altered ordering of ND and Aβ positivity may have to do with the nature of biomarker positivity that transforms continuous measures into dichotomous ones. Such transformations inherently create subthreshold, but meaningful, levels of abnormality.25 Indeed, when defining ND with HCVz, individuals in the SNAP cohort who later become Aβ+ have higher levels of Aβ at baseline than those who remain Aβ− (F1,32 = 9.34; P = .004), and individuals in the stage 0 cohort show similar findings (F1,96 = 3.68; P = .06). The comparison of dichotomized biomarkers to determine ordering is problematic because modalities inherently have different levels of noise, leading to variable sensitivity to subtle changes in the underlying biological features. As a result, the point when an individual crosses a threshold to denote abnormality is at best only a rough approximation of timing.
Prior work in the field suggests in congruences between markers of ND.19,35,48 This heterogeneity suggests that multiple pathways could lead to abnormal markers of neuronal injury and ND. Individuals who are initially classified as SNAP but go onto demonstrate Aβ+ would technically then fall into preclinical stage 2. However, this finding likely represents individuals with initial comorbid pathologic features who are in the early stages of AD rather than individuals at a later preclinical stage. This interpretation is supported by the similar frequencies of later Aβ+ as well as near identical slopes of Aβ accumulation in stage 0 and SNAP cohorts. This finding is in contrast to the influence of ND in the presence of abnormal Aβ levels. Individuals in the stage 2+ cohort had higher baseline levels, but qualitatively similar longitudinal accumulation of Aβ as individuals in the stage 1 cohort, and when defined using CSF, more rapid declines in hippocampal volume. This finding suggests that in general, stage 2+ represents a more advanced preclinical AD phase.
Finally, more important may be the term neurodegeneration used in the context of these biomarkers. Smaller hippocampal volumes at baseline (SNAP and stage 2+ cohorts) were not associated with a more rapid loss of tissue relative to those groups without abnormal hippocampal volumes (stages 0 and 1). This finding is true when examining hippocampal volume or HCVz over time (eTable and eFigure in the Supplement). Abnormal levels of CSF tau and ptau 181 were associated with an accelerated volume loss, but only in the presence of abnormal Aβ accumulation. These results suggest that the SNAP designation derived from cross-sectional data does not always represent an ongoing degenerative process. Instead, these biomarker abnormalities could represent individual variability in morphologic features (ie, inherently smaller hippocampi) or transient (eg, ischemia, head trauma) rather than persistent neuronal insults. This finding suggests that cross-sectional measures purported to measure degeneration, particularly hippocampal volume, may not accurately capture ongoing neurodegenerative processes. Additional work must be performed to separate AD neuronal injury from more nebulous factors to increase specificity.
Our work is consistent with disagreements between markers of ND noted in the literature.19,35,48 Of the 24 individuals defined as ND+ using CSF, 8 (33.3%) were defined as ND+ using HCVz. Although hippocampal volume is often used as a proxy for atrophy, it may be more appropriate for the field to shift toward using a summary volumetric signature selective for AD.6,49-51 Further volumetrics may demonstrate floor effects or residual effects of sex, whereas CSF markers could be a more active marker of degeneration. Future work should focus on integrating volumetrics and CSF measures into models predicting longitudinal biomarker and cognitive change.
Strengths of the current analyses include a large cohort of cognitively normal older adults, multiple measures of neurodegeneration, and the long duration of follow-up. The study is limited by constraints imposed by dichotomizing a continuous variable, that only longitudinal volumetric but not CSF data were available, and the modest number of individuals in advanced preclinical stages.
Conclusions
Our combined PET, MRI, and CSF study supports the general framework of the NIA-AA staging, and most individuals classified in the SNAP group do not demonstrate elevated AD processes. Our analyses revealed increasing Aβ deposition over time in a SNAP cohort, and a proportion of these individuals later became Aβ+. The rate of accumulation and frequency of biomarker conversion in individuals with SNAP were similar to those without any pathology at baseline.
Key Points.
Question
Do β-amyloid accumulation and hippocampal atrophy over time differ based on initial preclinical Alzheimer disease (AD) staging?
Findings
This population-based cohort study of 174 cognitively normal older adults found that more advanced preclinical AD stages have greater β-amyloid accumulation than those without any abnormal biomarkers or only abnormal neurodegenerative biomarkers at baseline.
Meaning
These results support the framework of AD preclinical stages and that neurodegeneration in isolation often represents comorbid influences rather than emerging AD.
Acknowledgments
Dr Gordon reports participating in a clinical trial with Avid Radiopharmaceuticals outside the submitted work. Dr Fagan reports receiving support from grants P50AG005681, P01AG003991, P01AG026276, and UF01AG032438 from the National Institutes of Health (NIH); serving on the Scientific Advisory Boards for Roche and IBL International; and consulting for DiamiR and Biogen. Dr Holtzman reports being a cofounder of and serving on the scientific advisory board for C2N Diagnostics and serving as a consultant for Genentech, AstraZeneca, AbbVie, Denali, Eli Lilly, and NeuroPhage. Dr Morris reports current participation in the Anti-Amyloid Treatment in Asymptomatic Alzheimer's Disease trial; serving as a consultant for Lilly USA and Takeda Pharmaceuticals; and receiving research support from Eli Lilly/Avid Radiopharmaceuticals and grants P50AG005681, P01AG003991, P01AG026276, and UF01AG032438 from the NIH. Dr Benzinger reports receiving grants and other support from Avid Radiopharmaceuticals, Eli Lilly, and Hoffman LaRoche, outside the submitted work.
Funding/Support: This study was supported by grants P01 AG026276, P01 AG003991, and P50 AG005681 from the NIH; Washington University Institute of Clinical and Translational Sciences grant UL1 TR000448 from the National Center for Advancing Translational Sciences; grant 5P30NS048056 from the NIH (services of the Neuroimaging Informatics and Analysis Center); Fred Simmons and Olga Mohan; the Barnes-Jewish Hospital Foundation; and Charles F. and Joanne Knight Alzheimer's Research Initiative.
Role of the Funder/Sponsor: The funding sources had no role in the design and conduct of the study; collection, management, analysis, or interpretation of the data; preparation, review, or approval of the manuscript; and decision to submit the manuscript for publication.
Footnotes
Author Contributions: Dr Gordon had full access to all the data in the study and takes responsibility for the integrity of the data and the accuracy of the data analysis.
Study concept and design: Gordon, Holtzman, Benzinger.
Acquisition, analysis, or interpretation of data: Gordon, Blazey, Su, Fagan, Morris, Benzinger.
Drafting of the manuscript: Gordon.
Critical revision of the manuscript for important intellectual content: All authors.
Statistical analysis: Gordon, Blazey.
Obtained funding: Morris, Benzinger.
Administrative, technical, or material support: Su, Fagan, Holtzman, Benzinger.
Study supervision: Benzinger.
Supplemental content at jamaneurology.com
Conflict of Interest Disclosures: No other disclosures were reported.
References
- 1.Bateman RJ, Xiong C, Benzinger TLS, et al. Dominantly Inherited Alzheimer Network. Clinical and biomarker changes in dominantly inherited Alzheimer's disease. N Engl J Med. 2012;367(9):795–804. doi: 10.1056/NEJMoa1202753. [DOI] [PMC free article] [PubMed] [Google Scholar]
- 2.Benzinger TLS, Blazey T, Jack CR, Jr, et al. Regional variability of imaging biomarkers in autosomal dominant Alzheimer's disease. Proc Natl Acad Sci U S A. 2013;110(47):E4502–E4509. doi: 10.1073/pnas.1317918110. [DOI] [PMC free article] [PubMed] [Google Scholar]
- 3.Ingelsson M, Fukumoto H, Newell KL, et al. Early Aβ accumulation and progressive synaptic loss, gliosis, and tangle formation in AD brain. Neurology. 2004;62(6):925–931. doi: 10.1212/01.wnl.0000115115.98960.37. [DOI] [PubMed] [Google Scholar]
- 4.Jack CR, Jr, Knopman DSD, Jagust WJW, et al. Hypothetical model of dynamic biomarkers of the Alzheimer's pathological cascade. Lancet Neurol. 2010;9(1):119–128. doi: 10.1016/S1474-4422(09)70299-6. [DOI] [PMC free article] [PubMed] [Google Scholar]
- 5.Jack CR, Jr, Knopman DS, Jagust WJ, et al. Tracking pathophysiological processes in Alzheimer's disease: an updated hypothetical model of dynamic biomarkers. Lancet Neurol. 2013;12(2):207–216. doi: 10.1016/S1474-4422(12)70291-0. [DOI] [PMC free article] [PubMed] [Google Scholar]
- 6.Sperling RA, Aisen PS, Beckett LA, et al. Toward defining the preclinical stages of Alzheimer's disease: recommendations from the National Institute on Aging–Alzheimer's Association workgroups on diagnostic guidelines for Alzheimer's disease. Alzheimers Dement. 2011;7(3):280–292. doi: 10.1016/j.jalz.2011.03.003. [DOI] [PMC free article] [PubMed] [Google Scholar]
- 7.Jack CR, Jr, Knopman DS, Weigand SD, et al. An operational approach to National Institute on Aging–Alzheimer's Association criteria for preclinical Alzheimer disease. Ann Neurol. 2012;71(6):765–775. doi: 10.1002/ana.22628. [DOI] [PMC free article] [PubMed] [Google Scholar]
- 8.Dubois B, Feldman HH, Jacova C, et al. Advancing research diagnostic criteria for Alzheimer's disease: the IWG-2 criteria. Lancet Neurol. 2014;13(6):614–629. doi: 10.1016/S1474-4422(14)70090-0. [DOI] [PubMed] [Google Scholar]
- 9.Knopman DS, Jack CR, Jr, Wiste HJ, et al. Short-term clinical outcomes for stages of NIA-AA preclinical Alzheimer disease. Neurology. 2012;78(20):1576–1582. doi: 10.1212/WNL.0b013e3182563bbe. [DOI] [PMC free article] [PubMed] [Google Scholar]
- 10.Jack CR, Jr, Wiste HJ, Knopman DS, et al. Rates of β-amyloid accumulation are independent of hippocampal neurodegeneration. Neurology. 2014;82(18):1605–1612. doi: 10.1212/WNL.0000000000000386. [DOI] [PMC free article] [PubMed] [Google Scholar]
- 11.Jack CR, Jr, Wiste HJ, Weigand SD, et al. Age-specific population frequencies of cerebral β-amyloidosis and neurodegeneration among people with normal cognitive function aged 50-89 years: a cross-sectional study. Lancet Neurol. 2014;13(10):997–1005. doi: 10.1016/S1474-4422(14)70194-2. [DOI] [PMC free article] [PubMed] [Google Scholar]
- 12.Knopman DS, Jack CR, Jr, Wiste HJ, et al. Selective worsening of brain injury biomarker abnormalities in cognitively normal elderly persons with β-amyloidosis. JAMA Neurol. 2013;70(8):1030–1038. doi: 10.1001/jamaneurol.2013.182. [DOI] [PMC free article] [PubMed] [Google Scholar]
- 13.Mormino EC, Betensky RA, Hedden T, et al. Synergistic effect of β-amyloid and neurodegeneration on cognitive decline in clinically normal individuals. JAMA Neurol. 2014;71(11):1379–1385. doi: 10.1001/jamaneurol.2014.2031. [DOI] [PMC free article] [PubMed] [Google Scholar]
- 14.Vos SJ, Xiong C, Visser PJ, et al. Preclinical Alzheimer's disease and its outcome: a longitudinal cohort study. Lancet Neurol. 2013;12(10):957–965. doi: 10.1016/S1474-4422(13)70194-7. [DOI] [PMC free article] [PubMed] [Google Scholar]
- 15.Toledo JB, Weiner MW, Wolk DA, et al. Alzheimer's Disease Neuroimaging Initiative. Neuronal injury biomarkers and prognosis in ADNI subjects with normal cognition. Acta Neuropathol Commun. 2014;2(1):26. doi: 10.1186/2051-5960-2-26. [DOI] [PMC free article] [PubMed] [Google Scholar]
- 16.Knopman DS, Jack CR, Jr, Wiste HJ, et al. Brain injury biomarkers are not dependent on β-amyloid in normal elderly. Ann Neurol. 2013;73(4):472–480. doi: 10.1002/ana.23816. [DOI] [PMC free article] [PubMed] [Google Scholar]
- 17.Ivanoiu A, Dricot L, Gilis N, et al. Classification of non-demented patients attending a memory clinic using the new diagnostic criteria for Alzheimer's disease with disease-related biomarkers. J Alzheimers Dis. 2015;43(3):835–847. doi: 10.3233/JAD-140651. [DOI] [PubMed] [Google Scholar]
- 18.van Harten AC, Smits LL, Teunissen CE, et al. Preclinical AD predicts decline in memory and executive functions in subjective complaints. Neurology. 2013;81(16):1409–1416. doi: 10.1212/WNL.0b013e3182a8418b. [DOI] [PubMed] [Google Scholar]
- 19.Caroli A, Prestia A, Galluzzi S, et al. Alzheimer's Disease Neuroimaging Initiative. Mild cognitive impairment with suspected nonamyloid pathology (SNAP): prediction of progression. Neurology. 2015;84(5):508–515. doi: 10.1212/WNL.0000000000001209. [DOI] [PMC free article] [PubMed] [Google Scholar]
- 20.Lowe VJ, Peller PJ, Weigand SD, et al. Application of the National Institute on Aging–Alzheimer's Association AD criteria to ADNI. Neurology. 2013;80(23):2130–2137. doi: 10.1212/WNL.0b013e318295d6cf. [DOI] [PMC free article] [PubMed] [Google Scholar]
- 21.Petersen RC, Aisen P, Boeve BF, et al. Mild cognitive impairment due to Alzheimer disease in the community. Ann Neurol. 2013;74(2):199–208. doi: 10.1002/ana.23931. [DOI] [PMC free article] [PubMed] [Google Scholar]
- 22.Vos SJ, Verhey F, Frölich L, et al. Alzheimer's Disease Neuroimaging Initiative. Prevalence and prognosis of Alzheimer's disease at the mild cognitive impairment stage. Brain. 2015;138(pt 5):1327–1338. doi: 10.1093/brain/awv029. [DOI] [PMC free article] [PubMed] [Google Scholar]
- 23.Jack CR, Jr, Wiste HJ, Weigand SD, et al. Amyloid-first and neurodegeneration-first profiles characterize incident amyloid PET positivity. Neurology. 2013;81(20):1732–1740. doi: 10.1212/01.wnl.0000435556.21319.e4. [DOI] [PMC free article] [PubMed] [Google Scholar]
- 24.Chételat G. Alzheimer disease: Aβ-independent processes—rethinking preclinical AD. Nat Rev Neurol. 2013;9(3):123–124. doi: 10.1038/nrneurol.2013.21. [DOI] [PMC free article] [PubMed] [Google Scholar]
- 25.Jack CR, Jr, Knopman DS, Chételat G, et al. Suspected non-Alzheimer disease pathophysiology: concept and controversy. Nat Rev Neurol. 2016;12(2):117–124. doi: 10.1038/nrneurol.2015.251. [DOI] [PMC free article] [PubMed] [Google Scholar]
- 26.Morris JC. The Clinical Dementia Rating (CDR): current version and scoring rules. Neurology. 1993;43(11):2412–2414. doi: 10.1212/wnl.43.11.2412-a. [DOI] [PubMed] [Google Scholar]
- 27.Su Y, D'Angelo GM, Vlassenko AG, et al. Quantitative analysis of PiB-PET with FreeSurfer ROIs. PLoS One. 2013;8(11):e73377. doi: 10.1371/journal.pone.0073377. [DOI] [PMC free article] [PubMed] [Google Scholar]
- 28.Su Y, Blazey TM, Snyder AZ, et al. Dominantly Inherited Alzheimer Network. Partial volume correction in quantitative amyloid imaging. Neuroimage. 2015;107:55–64. doi: 10.1016/j.neuroimage.2014.11.058. [DOI] [PMC free article] [PubMed] [Google Scholar]
- 29.Fischl B, van der Kouwe A, Destrieux C, et al. Automatically parcellating the human cerebral cortex. Cereb Cortex. 2004;14(1):11–22. doi: 10.1093/cercor/bhg087. [DOI] [PubMed] [Google Scholar]
- 30.Rousset OG, Ma Y, Evans AC. Correction for partial volume effects in PET: principle and validation. J Nucl Med. 1998;39(5):904–911. [PubMed] [Google Scholar]
- 31.Jack CR, Jr, Petersen RC, Xu YC, et al. Medial temporal atrophy on MRI in normal aging and very mild Alzheimer's disease. Neurology. 1997;49(3):786–794. doi: 10.1212/wnl.49.3.786. [DOI] [PMC free article] [PubMed] [Google Scholar]
- 32.Jack CR, Jr, Dickson DW, Parisi JE, et al. Antemortem MRI findings correlate with hippocampal neuropathology in typical aging and dementia. Neurology. 2002;58(5):750–757. doi: 10.1212/wnl.58.5.750. [DOI] [PMC free article] [PubMed] [Google Scholar]
- 33.Ossenkoppele R, Cohn-Sheehy BI, La Joie R, et al. Atrophy patterns in early clinical stages across distinct phenotypes of Alzheimer's disease. Hum Brain Mapp. 2015;36(11):4421–4437. doi: 10.1002/hbm.22927. [DOI] [PMC free article] [PubMed] [Google Scholar]
- 34.Fagan AM, Mintun MA, Mach RH, et al. Inverse relation between in vivo amyloid imaging load and cerebrospinal fluid Aβ42 in humans. Ann Neurol. 2006;59(3):512–519. doi: 10.1002/ana.20730. [DOI] [PubMed] [Google Scholar]
- 35.Vos SJB, Gordon BA, Su Y, et al. NIA-AA staging of preclinical Alzheimer disease: discordance and concordance of CSF and imaging biomarkers. Neurobiol Aging. 2016;44:1–8. doi: 10.1016/j.neurobiolaging.2016.03.025. [DOI] [PMC free article] [PubMed] [Google Scholar]
- 36.R Development Core Team. R: A language and environment for statistical computing. [Accessed January 2016];2010 https://www.r-project.org/
- 37.Pinheiro J, Bates D, DebRoy S, Sakor D R Core Team. nlme: Linear and nonlinear mixed effects models. R package, version 3.1-128. [Accessed January 2016]; http://CRAN.R-project.org/package=nlme. Published 2016.
- 38.Braak H, Braak E. Neuropathological stageing of Alzheimer-related changes. Acta Neuropathol. 1991;82(4):239–259. doi: 10.1007/BF00308809. [DOI] [PubMed] [Google Scholar]
- 39.Arriagada PV, Marzloff K, Hyman BT. Distribution of Alzheimer-type pathologic changes in nondemented elderly individuals matches the pattern in Alzheimer's disease. Neurology. 1992;42(9):1681–1688. doi: 10.1212/wnl.42.9.1681. [DOI] [PubMed] [Google Scholar]
- 40.Elobeid A, Soininen H, Alafuzoff I. Hyperphosphorylated tau in young and middle-aged subjects. Acta Neuropathol. 2012;123(1):97–104. doi: 10.1007/s00401-011-0906-z. [DOI] [PMC free article] [PubMed] [Google Scholar]
- 41.Knopman DS, Parisi JE, Salviati A, et al. Neuropathology of cognitively normal elderly. J Neuropathol Exp Neurol. 2003;62(11):1087–1095. doi: 10.1093/jnen/62.11.1087. [DOI] [PubMed] [Google Scholar]
- 42.Price JL, Morris JC. Tangles and plaques in nondemented aging and “preclinical” Alzheimer's disease. Ann Neurol. 1999;45(3):358–368. doi: 10.1002/1531-8249(199903)45:3<358::aid-ana12>3.0.co;2-x. [DOI] [PubMed] [Google Scholar]
- 43.Troncoso JC, Martin LJ, Dal Forno G, Kawas CH. Neuropathology in controls and demented subjects from the Baltimore Longitudinal Study of Aging. Neurobiol Aging. 1996;17(3):365–371. doi: 10.1016/0197-4580(96)00028-0. [DOI] [PubMed] [Google Scholar]
- 44.Braak H, Del Tredici K. The pathological process underlying Alzheimer's disease in individuals under thirty. Acta Neuropathol. 2011;121(2):171–181. doi: 10.1007/s00401-010-0789-4. [DOI] [PubMed] [Google Scholar]
- 45.Gómez-Isla T, Price JL, McKeel DW, Jr, Morris JC, Growdon JH, Hyman BT. Profound loss of layer II entorhinal cortex neurons occurs in very mild Alzheimer's disease. J Neurosci. 1996;16(14):4491–4500. doi: 10.1523/JNEUROSCI.16-14-04491.1996. [DOI] [PMC free article] [PubMed] [Google Scholar]
- 46.Price JL, Morris JC. So what if tangles precede plaques? Neurobiol Aging. 2004;25(6):721–723. doi: 10.1016/j.neurobiolaging.2003.12.017. [DOI] [PubMed] [Google Scholar]
- 47.Musiek ES, Holtzman DM. Origins of Alzheimer's disease: reconciling cerebrospinal fluid biomarker and neuropathologydata regarding the temporal sequence of amyloid-beta and tau involvement. Curr Opin Neurol. 2012;25(6):715–720. doi: 10.1097/WCO.0b013e32835a30f4. [DOI] [PMC free article] [PubMed] [Google Scholar]
- 48.Alexopoulos P, Kriett L, Haller B, et al. Alzheimer's Disease Neuroimaging Initiative. Limited agreement between biomarkers of neuronal injury at different stages of Alzheimer's disease. Alzheimers Dement. 2014;10(6):684–689. doi: 10.1016/j.jalz.2014.03.006. [DOI] [PubMed] [Google Scholar]
- 49.Dickerson BC, Bakkour A, Salat DH, et al. The cortical signature of Alzheimer's disease: regionally specific cortical thinning relates to symptom severity in very mild to mild AD dementia and is detectable in asymptomatic amyloid-positive individuals. Cereb Cortex. 2009;19(3):497–510. doi: 10.1093/cercor/bhn113. [DOI] [PMC free article] [PubMed] [Google Scholar]
- 50.Dickerson BC, Stoub TR, Shah RC, et al. Alzheimer-signature MRI biomarker predicts AD dementia in cognitively normal adults. Neurology. 2011;76(16):1395–1402. doi: 10.1212/WNL.0b013e3182166e96. [DOI] [PMC free article] [PubMed] [Google Scholar]
- 51.Wang L, Benzinger TL, Hassenstab J, et al. Spatially distinct atrophy is linked to β-amyloid and tau in preclinical Alzheimer disease. Neurology. 2015;84(12):1254–1260. doi: 10.1212/WNL.0000000000001401. [DOI] [PMC free article] [PubMed] [Google Scholar]