

Abstract
Abnormal extracellular matrix (ECM) remodeling is a prominent feature of many glomerular diseases and is a final common pathway of glomerular injury. However, changes in ECM composition accompanying disease-related remodeling are unknown. The physical properties of ECM create challenges for characterization of composition using standard protein extraction techniques, as the insoluble components of ECM are frequently discarded and many ECM proteins are in low abundance compared to other cell proteins. Prior proteomic studies defining normal ECM composition used a large number of glomeruli isolated from human kidneys retrieved for transplantation or by nephrectomy for cancer. Here we examined the ability to identify ECM proteins by mass spectrometry using glomerular sections compatible with that available from standard renal biopsy specimens. Proteins were classified as ECM by comparison to the Matrisome database and previously identified glomerular ECM proteins. Optimal ECM protein identification resulted from sequential decellularization and protein extraction of 100 human glomerular sections isolated by laser capture microdissection from either frozen or formalin fixed paraffin embedded tissue. In total, 147 ECM proteins were identified, including the majority of structural and GBM proteins previously identified along with a number of matrix and glomerular basement membrane proteins not previously associated with glomeruli. Thus, our study demonstrates the feasibility of proteomic analysis of glomerular ECM from retrieved glomerular sections isolated from renal biopsy tissue and expands the list of known ECM proteins in glomeruli.
Keywords: Extracellular matrix, glomeruli, mass spectrometry, laser capture microdissection, human
Introduction
Extracellular matrix (ECM) is a three-dimensional network of cross-linked, secreted proteins that exists in two major forms, a form surrounding cells as a structural scaffold and a specialized ECM that forms basement membranes. Genomic and proteomic analysis determined that mammalian ECM consists of about 300 core proteins, including 43 collagen subunits, 35 proteoglycans, and about 200 complex glycoproteins1,2. In addition to the core matrisome, over 700 matrix-associated proteins have been identified, including secreted proteins, growth factors, cytokines, and proteins that regulate ECM organization and remodeling3-6. ECM in different tissues contains a more limited number of proteins, as studies of ECM from lung and colon contained 146 and 106 matrix proteins, respectively, of which only 84 were common to both tissues3. ECM undergoes continual remodeling by adherent cells through release of degradative enzymes and production of new ECM1,6. Cells interact with ECM through matrix component receptors, including integrins, discoidin domain receptor tyrosine kinases, syndecans, CD44, and dystroglycan2. In addition to receptors for specific matrix components, cells express receptors for matrix-associated cytokines and growth factors, for degradative fragments of matrix components, and that recognize mechanical stress. Interaction of those receptors with their ligands activates intracellular signal transduction pathways that regulate cell adhesion, migration, proliferation, differentiation, and survival2,7. The signal transduction pathways activated by interaction of cells with ECM also regulate synthesis and secretion of ECM proteins. Thus, cells constantly remodel their surrounding ECM, while ECM regulates diverse cell functions. Aberrant ECM remodeling contributes to a number of diseases and produces fibrosis and organ failure.
The glomerular ECM is generated, organized, and maintained by all three resident cell types, podocytes, mesangial cells, and endothelium8. Glomerular ECM functions as a structural matrix surrounding mesangial cells and providing a scaffold for glomerular capillaries9. The glomerular basement membrane (GBM) is a specialized ECM generated by, and separating, podocytes and fenestrated vascular endothelial cells10. An increased accumulation of glomerular ECM occurs in a number of diseases, including diabetic nephropathy, IgA nephropathy, and focal segmental glomerulosclerosis (FSGS). Disordered ECM remodeling leading to glomerulosclerosis is postulated to represent a final common pathway of glomerular injury. Kidneys obtained from animal models of human disease have been used to provide insight into disease-specific ECM alterations. Xu et al.11 analyzed glomeruli isolated by laser capture microdissection (LCMD) from the 5/6 nephrectomy rat model of FSGS to show that the proteomic pattern of nonsclerotic glomeruli was more similar to sclerotic than normal glomeruli. They also identified thymosin β4 in endothelial cells of sclerotic and non-sclerotic glomeruli, but not in normal glomeruli. Thus, identification of the components of the glomerular ECM under normal and diseased conditions may provide insight into glomerular physiology and the pathophysiology of a number of glomerular diseases.
Several studies applied proteomic approaches to define normal ECM composition using whole glomeruli isolated from human kidneys retrieved for transplantation12 or by nephrectomy13,14 . Lennon et al.12 identified 144 core ECM and ECM-associated proteins from intact glomeruli isolated from human donor kidneys unsuitable for transplantation. Identifying the composition of glomerular ECM from the limited tissue available from human biopsies has been hindered by the technical difficulties of separating ECM from cellular compartments and the limited amount of protein available for mass spectrometry analysis. The goal of the current study was to determine the feasibility of using glomerular sections obtained by laser capture microdissection of kidney biopsies for proteomic analysis of the glomerular ECM. The tissue type (fixed and frozen tissue), protein extraction technique, and number of glomerular sections isolated by LCMD were studied. Our study demonstrated the feasibility of a proteomic analysis of glomerular ECM composition from glomerular sections isolated from limited renal tissue and expanded the list of known glomerular ECM proteins.
Results
Number of Glomerular Sections Required for Protein Identification
To compare protein identification from different tissue preparations and protein extraction techniques, we first examined the total number of proteins and peptides identified by mass spectrometry from varying numbers of glomerular sections. Figure 1 shows the total number of MS2 events and of proteins identified for different numbers of glomerular sections from each tissue preparation. For frozen tissue the number of MS2 events and identified proteins was optimal at 100 glomerular sections (figure 1a). For FFPE tissue the number of MS2 events was more variable with optimal values at 75 and 140 glomerular sections. The number of proteins identified was at a plateau between 60 and 130 glomerular sections, but increased at 140 sections (figure 1b). Based on those findings, 100 glomerular sections were selected as the target for use in all subsequent studies.
Figure 1. Number of Glomerular Sections Required for Protein Identification.

Glomerular sections were retrieved from 10 µm human kidney tissue sections of frozen (FR) and formalin-fixed paraffin embedded (FFPE) and extracted using 4% SDS prior to LCMS analysis. To establish optimal numbers of glomerular sections (x-axis) for LCMS analysis, numbers of MS2 events (left y-axis) and identified proteins (right y-axis) were plotted against the number of glomerular sections. 1a. Total number of MS2 events and proteins identified from varying numbers of glomerular sections in FR tissue. 1b. Total number of MS2 events and proteins identified from varying numbers of glomerular sections in FFPE tissue.
Reproducibility of Protein Identification
To determine the reproducibility of protein identification by MS analysis, peptides from all three protein extraction methods of both FFPE and frozen tissue were analyzed twice by MS. Replicate 1 and 2 correspond to proteins identified from each of the two analyses. Comparison of the 1097 proteins in Replicate 1 to the 1082 proteins in Replicate 2 is shown in figure 2. A total of 906 proteins were identified in both replicates, while 191 proteins were found only in replicate 1 and 176 proteins were only identified in replicate 2. Thus, performing duplicate MS analysis of a single peptide mixture from extracted glomerular proteins increased the number of proteins identified by about 20%.
Figure 2. Reproducibility of Protein Identification.
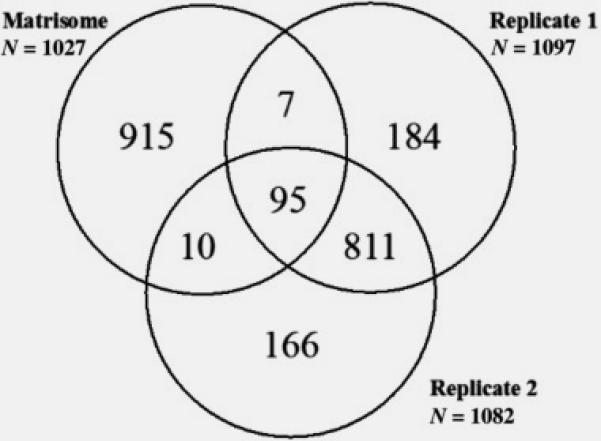
A comparison of protein identification rates within technical duplicate LCMS samples is shown in a Venn diagram. While the total numbers of identified proteins is consistent within a LCMS run, the numbers of unique proteins identified within only Replicate 1 or only Replicate 2 equaled approximately 20% of the total. To define the matrix protein identification rate, replicate 1 and 2 were each compared to the proteome contained in the Matrisome database. Replicate 1 (n= 1097 total proteins), Replicate 2 (n= 1082 total proteins), and the Matrisome database (n= 1027 matrix proteins).
As a goal of this project was ECM protein identification from limited kidney tissue, all proteins identified from replicates 1 and 2 were compared to the 1027 matrix proteins in the Matrisome database (http://matrisomeproject.mit.edu), a highly curated database of known ECM and ECM-associated proteins. A total of 112 matrix proteins were identified, of which 95 proteins were present in both replicates, 10 proteins were present only in replicate 1, and 7 proteins were present only in replicate 2 (figure 2).
Comparison of Extraction methods
To determine an effective method of protein extraction for matrix protein identification, three methods were examined, a) extraction with Protease MAX surfactant + heating (MAX), b) sequential extraction with 0.4% SDS to remove cellular proteins followed by MAX (SDS), and c) sequential extraction with NH4OH/0.5% TritonX-100 to remove cellular proteins followed by MAX (TX). Sequential extraction with either SDS or TX, compared to MAX, resulted in the identification of a larger number of total proteins and of proteins common to the Matrisome in both FFPE and FR tissue (table 1). Matrix proteins obtained from FFPE tissue using MAX (n= 63), SDS (n= 81) and TX (n=89) were compared. Of the matrix proteins identified by MAX, 94% were also identified by SDS and by TX. More than 80% of the matrix proteins identified by sequential extraction were common to TX and SDS. Figure 3a shows that TX extraction identified a greater number of unique matrix proteins (n=14), compared to SDS (n=5) and MAX (n=1). Figure 3b shows the comparison of matrix proteins identified from FR tissue via MAX (n= 66), SDS (n= 80) and TX (n=79). Of the matrix proteins identified by MAX 89% were also identified by SDS and by TX. Of the matrix proteins identified by sequential extraction methods, 86% were common to TX and SDS, 9 proteins were unique to TX, 6 to SDS, and 1 to MAX. Our data indicate that sequential extraction in which cellular proteins are removed, particularly that using Triton X-100, provided optimal identification of matrix proteins.
Table 1.
Comparison of the number of total and matrix proteins identified by MAX, SDS and TX in both FFPE and FR tissue.
| MAX | SDS | TX | |
|---|---|---|---|
| FFPE Total | 574 | 649 | 689 |
| FR Total | 694 | 750 | 874 |
| FFPE Matrix | 63 | 81 | 89 |
| FR Matrix | 66 | 80 | 79 |
Figure 3. Comparison of Extraction methods.

To determine an effective method of protein extraction from FFPE (3a) and FR (3b) tissue for matrix protein identification, three methods common to tissue decellularization approaches were examined include the use of an acid labile detergent (MAX), a neutral pH anionic detergent solution (SDS) and an alkaline non-ionic detergent solution (TX). Data are presented as a Venn diagram to illustrate overlap of protein identifications between the extraction methods. 3a. Numbers of matrix proteins identified from FFPE tissue using MAX (n= 63), SDS (n= 81) and TX (n=89). 3b. Numbers of matrix proteins identified from FR tissue using MAX (n= 66), SDS (n= 80) and TX (n=79).
Effect of Tissue Preparation on Matrix Protein Identification
To determine the effect of tissue processing on matrix protein recovery, the matrix proteins identified in glomerular sections from FFPE tissue and FR tissue were compared for each extraction method. Of the matrix proteins identified by MAX, 55 were common between FFPE (87%) and FR (83%) tissue. Of the matrix proteins identified by sequential extraction with SDS, 66 were common between FFPE (81%) and FR (82%) tissue. Sequential extraction with TX identified 67 proteins common between FFPE (75%) and FR (85%) tissue. Our results suggest that identification of matrix proteins from frozen tissue and FFPE preserved tissue is similar for each of the protein extraction methods.
Distribution of Matrix Proteins between Cellular and Decellularized Fractions in Sequential Extraction Methods
To determine the distribution of matrix proteins identified from cellular and decellularized fractions following sequential extraction with SDS and TX, matrix proteins identified in each fraction were compared. In glomerular sections from FFPE tissue, extraction with SDS resulted in identification of 70 matrix proteins in decellularized fractions and 31 matrix proteins in the cellular fraction, 20 proteins were common to both fractions (figure 4a). Extraction with TX identified 63 matrix proteins in the decellularized fraction and 59 matrix proteins in the cellular fraction with 33 proteins common to both (figure 4b). Both cellular and decellularized fractions contained glomerular structural and glomerular basement membrane proteins (supplementary table 1).
Figure 4. Distribution of Matrix Proteins between Cellular and Decellularized Fractions in Sequential Extraction Methods.

The efficiency of cellular and extracellular proteome isolation was examined by comparing the distribution of matrix proteins identified from cellular and decellularized fractions following sequential extraction with SDS and TX from FFPE and FR tissue. For this comparison the total number of matrix proteins identified in each fraction were compared and shown in Venn diagrams to illustrate overlap of protein identifications between extraction methods, tissue storage and cellular compartment:
4a. Distribution of matrix proteins following sequential extraction with SDS in FFPE tissue.
4b. Distribution of matrix proteins following sequential extraction with TX in FFPE tissue.
4c. Distribution of matrix proteins following sequential extraction with SDS in FR tissue.
4d. Distribution of matrix proteins following sequential extraction with TX in FR tissue.
In glomerular sections from frozen tissue, sequential extraction with SDS identified 65 matrix proteins in the decellularized fraction and 63 matrix proteins in the cellular fraction with 48 proteins common to both (figure 4c). For extraction by TX, 64 matrix proteins were present in the cellular fraction, compared to 55 in the decellularized fraction with 40 matrix proteins in common (figure 4d). This analysis indicates that mass spectrometric analysis of both cellular and decellularized fractions provides the most complete identification of matrix proteins.
Comparison of glomerular matrix protein dataset to that previously published
To determine the validity of using a number of glomerular sections available from kidney biopsies for ECM protein identification, we combined proteins from all three extraction techniques of both FFPE and frozen tissue and compared that dataset to the Matrisome dataset and to a previously published report that identified the largest number of ECM proteins using whole glomeruli isolated from three human donor kidneys unsuitable for transplantation12. Our dataset contained 112 proteins present in the Matrisome project dataset, and we identified an additional 35 proteins previously reported by Lennon et al.12, but not contained in the Matrisome dataset. Thus, 147 glomerular ECM proteins were identified in the current study, of which 91 proteins were previously identified by Lennon et al.12 . The current study identified 54 new glomerular ECM candidate proteins (figure 5). Analysis of these 54 proteins using the Human Protein Atlas Database found that 22 proteins were previously shown to be present in glomeruli alone or in both glomeruli and tubules, 14 proteins were present in tubules only, and 18 proteins were not found in either glomeruli or tubules (table 2).
Figure 5. Increasing the known human glomerular ECM proteome.

The experimental ECM dataset was analyzed using the online databases (Matrisome) and published literature12 to determine the ability to increase the known ECM proteome using numbers of glomerular sections isolated by LCMD modeling the use of clinical renal biopsy material. As shown by Venn diagram using gene names, a large number of ECM-associated proteins not previously described in glomeruli (n= 109) was identified.
Table 2.
Localization of the newly identified ECM associated proteins in the kidney using the Human Protein Atlas Database.
| Gene name | Location |
|---|---|
| A2M | present in glomeruli and tubules |
| A2ML1 | not detected in either tubules or glomeruli |
| ANGPTL6 | not available |
| ANXA1 | present in glomeruli, not tubules |
| ANXA3 | present in glomeruli<tubules |
| ANXA4 | present in tubules, not detected in glomeruli |
| ANXA6 | present in glomeruli<tubules |
| COL5A1 | not detected in either tubules or glomeruli |
| CRELD1 | present in tubules, not detected in glomeruli |
| CRIM1 | present in glomeruli, not tubules |
| CST6 | present in tubules, not detected in glomeruli |
| CSTA | not detected in either tubules or glomeruli |
| CSTB | not detected in either tubules or glomeruli |
| CTGF | present in glomeruli and tubules |
| CTSA | present in tubules, not detected in glomeruli |
| CTSB | present in tubules, not detected in glomeruli |
| CTSZ | present in tubules, not detected in glomeruli |
| DMBT1 | present in tubules, not detected in glomeruli |
| ECM1 | not detected in either tubules or glomeruli |
| FBN2 | not detected in either tubules or glomeruli |
| FGF1 | present in glomeruli>tubules |
| FLG | not detected in either tubules or glomeruli |
| HRG | present in glomeruli<tubules |
| HRNR | present in glomeruli<tubules |
| ITIH5 | present in glomeruli and tubules |
| LGALS7 | present in tubules, not detected in glomeruli |
| LUM | present in tubules, not detected in glomeruli |
| MFAP2 | not detected in either tubules or glomeruli |
| MMRN2 | present in glomeruli and tubules |
| MUC5B | not detected in either tubules or glomeruli |
| NTN4 | present in glomeruli<tubules |
| PAPLN | present in glomeruli and tubules |
| PLG | present in glomeruli and tubules |
| PLXNB2 | present in glomeruli<tubules |
| S100A10 | present in glomeruli and tubules |
| S100A11 | present in tubules, not detected in glomeruli |
| S100A12 | not detected in either tubules or glomeruli |
| S100A14 | present in tubules, not detected in glomeruli |
| S100A7 | not detected in either tubules or glomeruli |
| S100A9 | not detected in either tubules or glomeruli |
| S100P | not detected in either tubules or glomeruli |
| SBSPON | present in glomeruli<tubules |
| SERPINB1 | not detected in either tubules or glomeruli |
| SERPINB12 | present in tubules, not detected in glomeruli |
| SERPINB3 | not detected in either tubules or glomeruli |
| SERPINB6 | present in glomeruli and tubules |
| SERPINB9 | present in glomeruli not in tubules |
| SLPI | present in tubules, not detected in glomeruli |
| SPARC | present in glomeruli>tubules |
| TGM1 | not detected in either tubules or glomeruli |
| TGM3 | present in tubules, not detected in glomeruli |
| THSD4 | present in glomeruli<tubules |
| TNC | present in glomeruli not in tubules |
| VWF | not detected in either tubules or glomeruli |
Lennon at al.12 divided their 144 glomerular ECM proteins into structural (24 proteins), basement membrane (24 proteins), and matrix-associated (96) proteins. We compared our ECM proteins with the proteins in each of those three categories. Our dataset contained 17 of 24 structural matrix proteins (Table 3), 19 of 24 basement membrane (BM) proteins in addition to two new BM proteins (LAMA3 and LAMA4) (Table 4), and 55 of 96 matrix-associated proteins (figure 5).
Table 3.
Comparison of the structural ECM proteins identified in this study to those identified by Lennon et al.12.
| Structural ECM proteins Lennon (n=24) |
Structural ECM proteins current study (n=17) |
|---|---|
| ASPN | |
| BGN | BGN |
| COL12A1 | |
| COL1A1 | COL1A1 |
| COL1A2 | COL1A2 |
| COL3A1 | COL3A1 |
| COL6A1 | COL6A1 |
| COL6A2 | COL6A2 |
| COL6A3 | COL6A3 |
| DCN | |
| DPT | |
| EMILIN1 | EMILIN1 |
| FGA | FGA |
| FGB | FGB |
| FGG | FGG |
| MGP | MGP |
| NPNT | NPNT |
| POSTN | POSTN |
| RPESP | |
| TGFBI | TGFBI |
| TINAGL1 | TINAGL1 |
| VTN | VTN |
| VWA5B2 | |
| VWA8 |
Table 4.
Comparison of the GBM proteins identified in this study to those identified by Lennon et al.12.
| GBM proteins Lennon (n=24) |
GBM proteins current study (n=21) |
|---|---|
| AGRN | AGRN |
| COL15A1 | |
| COL18A1 | COL18A1 |
| COL4A1 | COL4A1 |
| COL4A2 | COL4A2 |
| COL4A3 | COL4A3 |
| COL4A4 | COL4A4 |
| COL4A5 | COL4A5 |
| COL4A6 | |
| FBLN1 | FBLN1 |
| FBN1 | FBN1 |
| FN1 | FN1 |
| FRAS1 | |
| HMCN1 | |
| HSPG2 | HSPG2 |
| LAMA2 | LAMA2 |
| LAMA3 | |
| LAMA4 | |
| LAMA5 | LAMA5 |
| LAMB1 | LAMB1 |
| LAMB2 | LAMB2 |
| LAMC1 | LAMC1 |
| NID1 | NID1 |
| NID2 | NID2 |
| TINAG | |
| VWA1 | VWA1 |
Glomerular ECM protein interaction network
All glomerular ECM proteins identified in the current study were converted to a protein interaction network model using The Search Tool for the Retrieval of Interacting Genes (STRING v10) database with the highest confidence score (0.900)15. Seven clusters of interacting proteins were identified, including basement membrane and structural ECM proteins composed of 13 collagens, 6 laminins, and 8 heparan sulfate proteoglycan GBM proteins (figure 6a). Other clusters included 5 complement components, 5 matrix remodeling enzymes with cathepsin B as the central node, a group of 15 proteins involved in matrix remodeling with plasminogen as a central node, and a group of 10 proteins centered around apolipoprotein A1. The same analysis was performed after combining ECM proteins identified in this study and the report by Lennon et al. (figure 6b). In addition to adding proteins to the networks composed of proteins of the current study, two new networks were identified. The first contained 7 proteins, with matrix metalloproteinase 9 as the central node, that participate in cell-matrix interactions and cell migration. The second contained 6 proteins composed of enzymes, including angiotensinogen, kininogen, cathepsin G, and cathepsin Z.
Figure 6. Glomerular ECM protein interaction network.

Analysis of identified proteomes using network analysis tools can provide valuable information for disease mechanisms. To demonstrate the robust LCMS data set collection using the limited amounts of glomerular ECM material, a schematic overview of the protein-protein interaction network established by modeling the glomerular ECM proteomes using The Search Tool for the Retrieval of Interacting Genes (STRING v10) database with the highest confidence score (0.900). 6a. STRING (v10) ECM protein-protein interaction network model (this study) identified seven clusters of interacting proteins including basement membrane and structural ECM proteins composed of 13 collagens, 6 laminins, and 8 heparan sulfate proteoglycan GBM proteins. 6b. STRING (v10) ECM protein-protein interaction network model (this and Lennon’s study) combined revealed two new networks containing one with matrix metalloproteinase 9 as the central node and a second with cathepsin’s –G and –Z as integral network components.
Discussion
Glomerular ECM is histologically abnormal in a number of diseases, and the ability to delineate ECM composition using patient biopsy specimens could identify diagnostic and prognostic changes and define the molecular events leading to glomerular ECM remodeling. A limitation of all proteomic studies to date is the inability to differentially enrich basement membrane from other forms of extra cellular matrix such as mesangial matrix. This current study capitalizes on the unusual physical properties of ECM that often create challenges for standard protein extraction techniques, such as the insoluble components of ECM which are frequently discarded during sample preparation. Furthermore, the presence of highly abundant cytoplasmic and mitochondrial proteins limits detection of lower abundance ECM proteins. The current study combined enrichment of glomerular ECM by LCMD and sequential protein extraction with highly sensitive mass spectrometry to identify ECM components from a number of glomerular sections compatible with that available from renal biopsies. We identified a majority of the structural and basement membrane glomerular ECM proteins, and the total number of ECM proteins found was comparable to that previously reported using whole glomeruli isolated from three human kidneys12.
A number of studies have shown the feasibility of obtaining glomerular sections for proteomic studies using LCMD16,17. The combination of LCMD and mass spectrometry identified proteins responsible for glomerular amyloid deposits18,19, defined targets of autoantibodies in glomerular immune complexes from membranous nephropathy and lupus nephritis patients20-22, identified a patient with IgD heavy-chain disease23, and determined the components of the complement cascade in patients with C3 glomerulonephritis24.
Both FFPE-preserved and frozen tissue have been used for glomerular proteomic analysis. Use of FFPE tissue for MS-based studies has been discouraged because formaldehyde-induced cross-linking makes proteins relatively insoluble and unsuitable for extraction and subsequent MS analysis25. Our data indicate that FFPE-preserved tissue is adequate for ECM protein identification. Advantages to using FFPE preserved renal biopsy tissue are that larger amounts of tissue are typically available; FFPE better preserves the cellular morphology and tissue architecture; tissue can be stained to better identify abnormal glomeruli; and tissue will remain stable for a longer time. The use of FFPE-preserved kidneys is supported by Nakatani et al.26 who used LCMD isolated glomeruli from FFPE kidneys obtained at autopsy from diabetic patients to show that nephronectin was associated with development of diabetic glomerulosclerosis.
To determine effective protein extraction for ECM protein identification, three methods were compared. Our data showed that sequential extraction with either SDS followed by MAX (SDS) or NH4OH/TritonX-100 followed by MAX (TX) resulted in the identification of a larger number of total proteins and matrix proteins, compared to MAX alone. TX extraction may provide a slight advantage over SDS, as a larger number of unique matrix proteins was identified. The use of sequential extraction takes advantage of the insolubility of ECM to enrich a sample for matrix proteins. Thus, we expected ECM proteins to be in the fraction remaining after removal of cellular proteins. Surprisingly, matrix proteins were present in both soluble and insoluble fractions. We were not able to discern from these proteomic data if the matrix proteins present in the soluble fraction represented nascent, soluble forms of ECM proteins that were yet to be secreted and targeted for crosslinking into the glomerular ECM. However, that finding suggests that procedures that limit the number of proteins in the analyte are important for ECM protein identification. From a practical standpoint, mass spectrometry analysis of both fractions optimally identified ECM components. Additionally, duplicate analysis of the same peptide mixture increased the number of ECM proteins identified by about 20%. Thus, the optimal work-flow for identification of glomerular ECM proteins in our study was to obtain 100 glomerular sections from FFPE tissue by LCMD, perform sequential protein extraction with triton X-100 followed by MAX surfactant, and perform duplicate mass spectrometry analysis of peptides from both soluble and insoluble fractions.
Lennon et al.12 previously identified the largest human glomerular ECM proteome using whole glomeruli isolated by sequential sieving from 3 kidneys retrieved for transplantation. ECM enrichment was performed by sequential decellularization with TX-100 and protein extraction from the insoluble fraction with SDS. MS analysis identified 144 matrix proteins, of which 24 were determined to be structural ECM, 24 were components of basement membrane, and 96 were matrix associated proteins. Comparing our protein list obtained using glomerular sections to the datasets from the Matrisome project and the report of Lennon et al.12, the current study identified 147 matrix proteins. The majority of the structural and basement membrane proteins identified previously were also found in the current study, while a number of new matrix associated proteins and two new GBM proteins (LAMA3 and LAMA4) were identified. These data highlight the need for addition methods development to enable isolation and characterization of unique ECM compartments such as GBM versus mesangial matrix. Combining our protein list with that of Lennon et al.12 established 212 unique proteins as components of normal glomerular ECM. Our study confirms that the composition of glomerular ECM is complex, and, provides methodologies to define ECM abnormalities in various glomerular diseases. The availability of the normal glomerular ECM proteome provides a basis for comparison of ECM in those glomerular diseases.
Methods
Tissue collection
Human kidneys were obtained from deceased donors that were unsuitable for transplantation (courtesy of Kentucky Organ Donor Affiliates), as approved by the University of Louisville Human Studies Committee. Frozen (FR) and formalin-fixed paraffin embedded (FFPE) tissue prepared from the same human kidney was cut into 10 µm sections on Polyethylene terephthalate (PET) membrane frame slides. Tissue was stained with Mayer’s hematoxylin following Leica LMD6500 Laser Microdissection System (LCMD) staining protocol (Figure 7). Glomerular section isolation experiments were conducted separately (a) to determine a minimal number of glomeruli sections for proteomic analysis and (b) to determine the superiority of two-step sample preparation methods that included first a decellularization step prior to a standard protein isolation method against a standard direct solubilization step with an acid-labile detergent. In (a) increasing numbers of glomerular sections were collected from FR and FFPE embedded tissue and stored at −80°C. In (b) 100 glomerular sections were isolated in technical triplicates using LCMD from FFPE and FR tissue. Glomerular sections were collected into tubes containing 20 µL of the storage buffer (10mM HEPES pH7.0 / 0.67mM EDTA / 1x Halt™ Protease & Phosphatase inhibitors (Thermo #78442)) then stored at −80°C.
Figure 7. Tissue Collection using LCMD.

Images (100µm scale bar) demonstrating representative kidney tissue sections (10 µm) on PET membrane slides stained with Mayer’s hematoxylin from FFPE (7a-b) and FR (7c-d) before and after LCMD retrieval and collection (7e) of glomerular sections. 7a) FFPE tissue pre glomerular collection (10X magnification). 7b) FFPE tissue post glomerular collection (20X magnification). 7c) FR tissue pre glomerular collection (10X magnification). 7d) FR tissue post glomerular collection (20X magnification). 7e) Glomerular sections collected in the cap (10X magnification).
Protein extraction
Optimal Glomerular Section Numbers
For determination of optimal number of isolated glomerular sections for proteomic experiments, glomerular proteins were extracted using 0.1M Tris pH 8.5/4% sodium dodecyl sulfate (SDS) with homogenization by 8-10 cycles of pipetting with a freshly rinsed Hamilton syringe followed heating to 99°C for 60 minutes. The supernatant was recovered with aid of a dissection microscope at 30X magnification by manual pipetting. This sample was proteolyzed by digestion according to the filter-aided sample preparation (FASP) protocol. With this method the residual insoluble pellet was rinsed twice with 0.1M Tris-HCl (pH 8.5) and then digested overnight at 37°C with 20 ng sequencing grade modified trypsi n in 100 µL of 1M urea / 0.1M Tris-HCl pH 8.5. This digest was filtered using the YM-10 10,000 Da molecular weight cutoff device and the digests analyzed by a proteomic approach as described below.
Optimization of ECM isolation for proteomic analyses
To determine an optimal approach for isolation of ECM proteins from glomerular sections, three methods including two sequential-extraction approaches involving an initial decellularization step were used for a side-by-side evaluation. These decellularization steps were based modifications of the methods used by Ott et al.27 for heart tissue and Lennon’s work12 for decellularization of whole glomeruli. Method 1. The isolated glomerular sections were solubilized in a single step using an acid-labile surfactant (0.1% Protease MAX surfactant in 0.05M ammonium bicarbonate) with heating for 5 min at 95°C (termed ‘MAX’) for total proteome extraction as published by Satoskar AA et al.16 . Method 2. The isolated glomerular sections were de-cellularized using a 0.4% SDS + HALT protease/phosphatase inhibitor cocktail (ThermoFisher) followed by solubilization of residual “ECM” pellet using MAX. Method 3. The isolated glomerular sections were de-cellularized using a method similar to the cellular “denudation” step of Byron et al.8 with 25mM NH4OH/ 0.5%TritonX-100 (TX) + HALT protease/phosphatase inhibitor cocktail (ThermoFisher) followed by solubilization of residual “ECM” pellet using MAX (figure 8). The isolated cellular and ECM proteins were digested using a FASP protocol as described above. The filtered and digested samples were desalted and concentrated using a reversed phase C18 PROTO™Ultra MicroSpin desalting column (Nest Group, Southborough, MA). The recovered peptides were lyophilized and resuspended in 2% acetonitrile/0.1% formic acid prior to quantification using a Nanodrop 2000 (ThermoFisher Inc) at 205nm.
Figure 8. Optimization of ECM isolation for proteomic analyses.

A schematic workflow for three protein extraction methods comparison. Method (A) is a single step extraction/solubilization of tissue using the acid labile detergent Protease MAX surfactant with heating for 5min at 95ºC (MAX). Method (B) is the two step sequential extraction first with phosphate buffered saline 0.4% SDS to isolate the cellular fraction followed by ECM solubilization by MAX. Method (C) is the two step sequential extraction first with 25 mM NH4OH/0.5% TritonX-100 to isolate the cellular fraction followed by ECM solubilization by MAX.
Proteomic analysis of isolated cellular and ECM samples
Methods for the analysis of cellular and ECM protein samples using liquid chromatography mass spectrometry (LCMS) were conducted as previously described28. Peptide values were estimated using absorbance measurements at 205 nm by NanoDrop (Thermo-Fisher Scientific, Waltham, MA). Peptide samples were separated with a 170 min LC gradient using a Proxeon EASY n-LC (Thermo-Fisher Scientific) UHPLC system and Dionex (Sunnyvale, CA) Acclaim PepMap 100 75µm × 2cm, nanoViper (C18, 3µm, 100Å) trap, and a Dionex Acclaim PepMap RSLC 50µm × 15cm, nanoViper (C18, 2µm, 100Å) separating column. The eluate was introduced into an LTQ-Orbitrap ELITE (Thermo-Fisher Scientific) using a Nanospray Flex source. Data were acquired with an Nth Order Double Play with electron transfer dissociation (ETD) Decision Tree to determine whether CID or ETD activation was used.
Analysis of Proteomic Data
The collected data were analyzed by Proteome Discoverer v1.4.1.114 using Mascot v2.5.1 and SequestHT searches with the 4/16/2014 version of the UniprotKB Homo sapiens reference proteome canonical and isoform sequences. To estimate the false discovery rate, a Target Decoy PSM Validator node was included in the Proteome Discoverer workflow. The resulting .msf files from Proteome Discoverer were loaded into Scaffold Q+S v4.4.1 for comparative proteomics. Scaffold was used to calculate the false discovery rate using the Peptide and Protein Prophet algorithms. The Scaffold delta-mass correction was enable during loading to accommodate instrumental mass measurement drift in Orbitrap data. The results were annotated with human gene ontology information from the Gene Ontology Annotations Database (ftp.ebi.ac.uk).
Protein-protein interaction network analysis was performed using Search Tool for the Retrieval of Interacting Genes/Proteins15, STRING v10, with the highest confidence score (0.900). Validation of protein expression in renal glomerular and tubular cellular or extracellular compartments was performed using three primary databases: the Matrisome database (http://matrisomeproject.mit.edu)2,29-30, the Human Protein Atlas (www.proteinatlas.org)31, and the glomerular database published by Lennon et al.12
Data sharing
Data files for acquired LCMS data (.RAW), for peak lists (.mgf), and compressed search results (.mzIdentML) files were deposited in MassIVE (http://massive.ucsd.edu/) data repository (MassIVE ID: MSV000079914) with the Center for Computational Mass Spectrometry at the University of California, San Diego and shared with the ProteomeXchange (ID: PXD004601) (www.proteomexchange.org).
Supplementary Material
Acknowledgments
The authors acknowledge the expert technical contributions of Daniel Wilkey, research support by the James G McCollough Fund (LH and MLM) and research was presentation in abstract form to the American Society of Nephrology using Kidney Week, 2016 .
Footnotes
Publisher's Disclaimer: This is a PDF file of an unedited manuscript that has been accepted for publication. As a service to our customers we are providing this early version of the manuscript. The manuscript will undergo copyediting, typesetting, and review of the resulting proof before it is published in its final citable form. Please note that during the production process errors may be discovered which could affect the content, and all legal disclaimers that apply to the journal pertain.
Disclosure
The authors have nothing to disclose.
References
- 1.Bonnans C, Chou J, Werb Z. Remodelling the extracellular matrix in development and disease. Nat Rev Mol Cell Biol. 2014;15(12):786–801. doi: 10.1038/nrm3904. doi:10.1038/nrm3904. [DOI] [PMC free article] [PubMed] [Google Scholar]
- 2.Hynes RO, Naba A. Overview of the Matrisome -- An Inventory of Extracellular Matrix Constituents and Functions. Cold Spring Harb Perspect Biol. 2012;4(1):a004903. doi: 10.1101/cshperspect.a004903. doi:10.1101/cshperspect.a004903. [DOI] [PMC free article] [PubMed] [Google Scholar]
- 3.Naba A, Clauser KR, Hoersch S, et al. The Matrisome: In Silico Definition and In Vivo Characterization by Proteomics of Normal and Tumor Extracellular Matrices. Mol Cell Proteomics. 2012;11(4):M111.014647. doi: 10.1074/mcp.M111.014647. doi:10.1074/mcp.M111.014647. [DOI] [PMC free article] [PubMed] [Google Scholar]
- 4.Hynes RO. The extracellular matrix: not just pretty fibrils. Science. 2009;326(5957):1216–9. doi: 10.1126/science.1176009. doi:10.1126/science.1176009. [DOI] [PMC free article] [PubMed] [Google Scholar]
- 5.Mott JD, Werb Z. Regulation of matrix biology by matrix metalloproteinases. Curr Opin Cell Biol. 2004;16(5):558–64. doi: 10.1016/j.ceb.2004.07.010. doi:10.1016/j.ceb.2004.07.010. [DOI] [PMC free article] [PubMed] [Google Scholar]
- 6.Lu P, Takai K, Weaver VM, et al. Extracellular matrix degradation and remodeling in development and disease. Cold Spring Harb Perspect Biol. 2011;3(12):a005058. doi: 10.1101/cshperspect.a005058. pii. doi: 10.1101/cshperspect.a005058. [DOI] [PMC free article] [PubMed] [Google Scholar]
- 7.Naba A, Clauser KR, Ding H, et al. The extracellular matrix: Tools and insights for the "omics" era. Matrix Biol. 2016;49:10–24. doi: 10.1016/j.matbio.2015.06.003. doi: 10.1016/j.matbio.2015.06.003. [DOI] [PMC free article] [PubMed] [Google Scholar]
- 8.Byron A, Randles MJ, Humphries JD, et al. Glomerular Cell Cross-Talk Influences Composition and Assembly of Extracellular Matrix. J Am Soc Nephrol. 2014;25(5):953–66. doi: 10.1681/ASN.2013070795. doi:10.1681/ASN.2013070795. [DOI] [PMC free article] [PubMed] [Google Scholar]
- 9.Borza CM, Pozzi A. The role of cell-extracellular matrix interactions in glomerular injury. Exp Cell Res. 2012;318(9):1001–10. doi: 10.1016/j.yexcr.2012.02.033. doi:10.1016/j.yexcr.2012.02.033. [DOI] [PMC free article] [PubMed] [Google Scholar]
- 10.Scott RP, Quaggin SE. Review series: The cell biology of renal filtration. J Cell Biol. 2015;209(2):199–210. doi: 10.1083/jcb.201410017. doi:10.1083/jcb.201410017. [DOI] [PMC free article] [PubMed] [Google Scholar]
- 11.Xu BJ, Shyr Y, Liang X, et al. Proteomic patterns and prediction of glomerulosclerosis and its mechanisms. J Am Soc Nephrol. 2005;16(10):2967–75. doi: 10.1681/ASN.2005030262. doi:10.1681/ASN.2005030262. [DOI] [PubMed] [Google Scholar]
- 12.Lennon R, Byron A, Humphries JD, et al. Global Analysis Reveals the Complexity of the Human Glomerular Extracellular Matrix. J Am Soc Nephrol. 2014;25(5):939–51. doi: 10.1681/ASN.2013030233. doi:10.1681/ASN.2013030233. [DOI] [PMC free article] [PubMed] [Google Scholar]
- 13.Yoshida Y, Miyazaki K, Kamiie J, et al. Two-dimensional electrophoretic profiling of normal human kidney glomerulus proteome and construction of an extensible markup language (XML)-based database. Proteomics. 2005;5(4):1083–96. doi: 10.1002/pmic.200401075. doi: 10.1002/pmic.200401075. [DOI] [PubMed] [Google Scholar]
- 14.Cui Z, Yoshida Y, Xu B, et al. Profiling and annotation of human kidney glomerulus proteome. Proteome Sci. 2013;11(1):13. doi: 10.1186/1477-5956-11-13. doi: 10.1186/1477-5956-11-13. [DOI] [PMC free article] [PubMed] [Google Scholar]
- 15.Szklarczyk D, Franceschini A, Wyder S, et al. STRING v10: protein-protein interaction networks, integrated over the tree of life. Nucleic Acids Res. 2015;43:D447–52. doi: 10.1093/nar/gku1003. doi: 10.1093/nar/gku1003. [DOI] [PMC free article] [PubMed] [Google Scholar]
- 16.Satoskar AA, Shapiro JP, Bott CN, et al. Characterization of glomerular diseases using proteomic analysis of laser capture microdissected glomeruli. Mod Pathol. 2012;25(5):709–21. doi: 10.1038/modpathol.2011.205. doi: 10.1038/modpathol.2011.205. [DOI] [PMC free article] [PubMed] [Google Scholar]
- 17.Yoshida Y, Nameta M, Kuwano M, et al. Proteomic approach to human kidney glomerulus prepared by laser microdissection from frozen biopsy specimens: exploration of proteome after removal of blood-derived proteins. Proteomics Clin Appl. 2012;6(7-8):412–7. doi: 10.1002/prca.201200016. doi: 10.1002/prca.201200016. [DOI] [PubMed] [Google Scholar]
- 18.Sethi S, Vrana JA, Theis JD, et al. Laser microdissection and mass spectrometry-based proteomics aids the diagnosis and typing of renal amyloidosis. Kidney Int. 2012;82(2):226–34. doi: 10.1038/ki.2012.108. doi: 10.1038/ki.2012.108. [DOI] [PMC free article] [PubMed] [Google Scholar]
- 19.Sethi S, Theis JD, Vrana JA, et al. Laser microdissection and proteomic analysis of amyloidosis, cryoglobulinemic GN, fibrillary GN, and immunotactoid glomerulopathy. Clin J Am Soc Nephrol. 2013;8(6):915–21. doi: 10.2215/CJN.07030712. doi: 10.2215/CJN.07030712. [DOI] [PMC free article] [PubMed] [Google Scholar]
- 20.Bruschi M, Carnevali ML, Murtas C, et al. Direct characterization of target podocyte antigens and auto-antibodies in human membranous glomerulonephritis: Alfa-enolase and borderline antigens. J Proteomics. 2011;74(10):2008–17. doi: 10.1016/j.jprot.2011.05.021. doi: 10.1016/j.jprot.2011.05.021. [DOI] [PubMed] [Google Scholar]
- 21.Bruschi M, Sinico RA, Moroni G, et al. Glomerular autoimmune multicomponents of human lupus nephritis in vivo: alpha-enolase and annexin AI. J Am Soc Nephrol. 2014;25(11):2483–98. doi: 10.1681/ASN.2013090987. doi: 10.1681/ASN.2013090987. [DOI] [PMC free article] [PubMed] [Google Scholar]
- 22.Bruschi M, Galetti M, Sinico RA, et al. Glomerular Autoimmune Multicomponents of Human Lupus Nephritis In Vivo (2): Planted Antigens. J Am Soc Nephrol. 2015;26(8):1905–24. doi: 10.1681/ASN.2014050493. doi: 10.1681/ASN.2014050493. [DOI] [PMC free article] [PubMed] [Google Scholar]
- 23.Royal V, Quint P, Leblanc M, et al. IgD heavy-chain deposition disease: detection by laser microdissection and mass spectrometry. J Am Soc Nephrol. 2015;26(4):784–90. doi: 10.1681/ASN.2014050481. doi: 10.1681/ASN.2014050481. [DOI] [PMC free article] [PubMed] [Google Scholar]
- 24.Sethi S, Fervenza FC, Zhang Y, et al. C3 glomerulonephritis: clinicopathological findings, complement abnormalities, glomerular proteomic profile, treatment, and follow-up. Kidney Int. 2012;82(4):465–73. doi: 10.1038/ki.2012.212. doi: 10.1038/ki.2012.212. [DOI] [PMC free article] [PubMed] [Google Scholar]
- 25.Ahram M, Flaig MJ, Gillespie JW, et al. Evaluation of ethanol-fixed, paraffin-embedded tissues for proteomic applications. Proteomics. 2003;3(4):413–21. doi: 10.1002/pmic.200390056. doi:10.1002/pmic.200390056. [DOI] [PubMed] [Google Scholar]
- 26.Nakatani S, Wei M, Ishimura E, et al. Proteome analysis of laser microdissected glomeruli from formalin-fixed paraffin-embedded kidneys of autopsies of diabetic patients: nephronectin is associated with the development of diabetic glomerulosclerosis. Nephrol Dial Transplant. 2012;27(5):1889–97. doi: 10.1093/ndt/gfr682. doi: 10.1093/ndt/gfr682. [DOI] [PubMed] [Google Scholar]
- 27.Ott HC, Matthiesen TS, Goh SK, et al. Perfusion-decellularized matrix: using nature's platform to engineer a bioartificial heart. Nat Med. 2008;14(2):213–21. doi: 10.1038/nm1684. doi: 10.1038/nm1684. [DOI] [PubMed] [Google Scholar]
- 28.Tomas NM, Beck LH, Jr, Meyer-Schwesinger C, et al. Thrombospondin Type-1 Domain-Containing 7A in Idiopathic Membranous Nephropathy. N Engl J Med. 2014;371(24):2277–87. doi: 10.1056/NEJMoa1409354. doi: 10.1056/NEJMoa1409354. [DOI] [PMC free article] [PubMed] [Google Scholar]
- 29.Naba A, Clauser KR, Hoersch S, Liu H, Carr SA, Hynes RO. The matrisome: in silico definition and in vivo characterization by proteomics of normal and tumor extracellular matrices. Mol. Cell. Prot. 2011 doi: 10.1074/mcp.M111.014647. doi:10.1074/mcp.M111.014647. PMID:22159717. [DOI] [PMC free article] [PubMed] [Google Scholar]
- 30.Naba A, Hoersch S, Hynes RO. Towards definition of an ECM parts list: An advance on GO categories. Matrix Biology. 2012 Sep;31(7-8):371–372. doi: 10.1016/j.matbio.2012.11.008. doi: 10.1016/j.matbio.2012.11.008. [DOI] [PMC free article] [PubMed] [Google Scholar]
- 31.Uhlen M, Oksvold P, Fagerberg L, Lundberg E, Jonasson K, Forsberg M, Zwahlen M, Kampf C, Wester K, Hober S, Wernerus H, Björling L, Ponten F. Towards a knowledge-based Human Protein Atlas. Nat Biotechnol. 2010;28:1248–1250. doi: 10.1038/nbt1210-1248. [DOI] [PubMed] [Google Scholar]
Associated Data
This section collects any data citations, data availability statements, or supplementary materials included in this article.