Abstract
Intravenous (IV) infusion is used for administration of a large proportion of biologic therapeutics, including most monoclonal antibody (mAb) products. In this study, we determined the sub-visible particle levels in IV solutions and after the solutions were processed with an IV administration setup that mimicked the typical clinical method of administration. IV saline in bags manufactured by both Hospira and Baxter contained 1,600–8,000 microparticles/mL and 4–73×106 nanoparticles/mL in solution. When intravenous immunoglobulin (IVIG) was diluted into the IV saline, 3,700–23,000 microparticles/mL and 18–240×106 nanoparticles/mL were detected. During processing of the solution through the IV system, in-line filters removed most microparticles. However, there were still 1–21×106 nanoparticles/mL in IV saline and 7–83×106 nanoparticles/mL in IVIG diluted in saline. Finally, in samples processed through in-line filters, we found relatively large microparticles (20–60 μm) that were composed of protein or polycarbonate. These particles resulted from shedding of polycarbonate and sloughing off of protein films downstream from the filter membrane. Overall, the results document that even with in-line filters in place, high levels of subvisible particles are delivered to patients and there is a need for improved, more effective filters and IV solutions with lower particle levels.
INTRODUCTION
Therapeutic protein products are commonly administered parenterally, which include intramuscular, subcutaneous or intravenous (IV) routes of administration. As of 2015, 30 of the 47 monoclonal antibodies (mAbs) on the market were formulated for delivery by IV infusion.1 Administering therapeutic proteins intravenously can lead to hypersensitivity/infusion reactions in patients, as well as immunogenicity.2,3 Hypersensitivity/infusion reactions usually occur within 72 hours of administration with symptoms ranging in severity from mild headaches, flushing and itching, to tightness in throat, dizziness and even anaphylactic shock.4 For intravenous immunoglobulin (IVIG), which contains IgG molecules from pooled plasma of human donors and is the model protein for this study, incidences of infusion reactions vary from 1 to 81% of patients or infusion cycles.5 In most cases, these reactions are frequent among patients during initial treatment and decrease over subsequent infusion cycles.6,7 Immunogenic reactions caused by therapeutic proteins may compromise drug product efficacy because of the production of neutralizing antibodies against the therapeutic protein. More than 20% of the patients experience loss of efficacy during treatment with different mAb products including infliximab, daclizumab, adalimumab, abciximab and efalizumab.8
Protein aggregates and particles resulting from physicochemical instability of drug products represent important factors in eliciting adverse infusion reactions and/or immune responses.2,9–12 In an IV infusion system, numerous factors can lead to protein aggregation. Foremost, a diluent incompatible with a therapeutic protein product could cause protein aggregation. Packaging inserts for some mAbs including abciximab, alemtuzumab and rituximab recommend using either 0.9% saline or 5% dextrose as a diluent. But for mAbs such as panitumumab, pertuzumab and trastuzumab, saline is the only recommended diluent, and for trastuzumab it is specifically noted that dextrose should not be used as a diluent. Demuele et al characterized trastuzumab diluted into saline or dextrose, and found much higher aggregate formation in the 5% dextrose solution.13
Furthermore, because of the high level of dilution occurring when IV solutions are prepared, protein stability provided by the product formulation is greatly reduced, increasing the likelihood of protein aggregation. For example, Kumru et al found that upon dilution into IV saline, an IgG4 mAb formed soluble aggregates and subvisible particles, which were measured by microflow imaging (MFI) and nanoparticle tracking analysis (NTA).14 Other studies have reported no changes in protein stability over at least 24 hours of incubation after dilution in saline for cetuximab, panitumumab, trastuzumab, pertuzumab and infliximab.15–17 However, in these cases either light obscuration or an enzyme-linked immunosorbent assay was used to determine the presence of aggregates or changes in protein concentration, respectively. Such techniques are typically not sensitive enough to detect levels of damage that may account for less than 0.1% of the total protein concentration, but can still be associated with formation of significant numbers of protein particles.18,19
During processing through an IV infusion system, protein drug products are exposed to a number of surfaces – IV bags, IV tubes, in-line filter units etc. IV bags are usually made of polyvinyl chloride (PVC) or polyolefin (PO). The IV infusion sets are composed of PVC tubing and silicone tubing in the section on which the pump operates. The connectors are made of polycarbonate. The housing chamber for most filters and the framework on which the filter membrane rests are also made of polycarbonate; and there is typically a tube downstream from the filter membrane made of PVC that connects to the needle. Protein molecules readily adsorb onto such solid surfaces at the liquid-solid interface. For example, factor VIII diluted in saline and stored for 48 hours in an IV bag made of PVC resulted in reduction in protein activity, which was attributed to adsorption of the protein molecules onto the bag surface.20 With all of the solid-liquid interfaces mentioned above, along with the air-water interface in the drip chamber and the IV bag, adsorption of protein molecules can result in the formation of surface films. The sloughing off and/or mechanical rupture of such films leads to subvisible particles in solution.21,22 Protein particle formation in IV bags due to protein adsorption to interfaces was also suggested by Kumru, et al., and they observed a reduction in protein particles in the presence of polysorbate 20, an effect attributed to inhibition of protein adsorption to the bag walls and to the air-water interface.14
We hypothesized that dilution of formulation excipients and exposure to various interfaces in the infusion system will cause protein aggregation in the form of micro- and nanoparticles. In the current study, we started by characterizing IV saline for its micro- and nanoparticle concentration. IV saline bags of two sample volumes (100 mL and 250 mL) from two manufacturers (Hospira and Baxter) were examined for particle concentration. In-line filters manufactured by Baxter (pore size - 0.2 μm and 1.2 μm) and CareFusion (pore size - 1.2 μm) were also tested for their efficiency in filtering out these particles. Thereafter, we characterized micro- and nanoparticles formed by a model therapeutic protein, IVIG, upon dilution into IV saline and during processing through a conventional infusion system. The IV system was composed of IV saline bag, IV tube, infusion pump and filter units that are used routinely for clinical administration of therapeutic protein products. Finally, an automated Raman microscope was used to identify some of the microparticles observed in solutions of IVIG that had been processed through the infusion system.
MATERIALS AND METHODS
Materials
The IV administration arrangement employed an Alaris 8100 pump module and an Alaris 8015 pump controller. IV tubes (CareFusion, serial # 2426-0500), in-line filters (CareFusion: 1.2 μm pore size, serial # 20128E, Baxter: 1.2 μm pore size, serial # 2C1103, and 0.2 μm pore size, serial # 2C8671), and IV saline bags (Hospira, Lake Forest, IL, 100 mL serial # NDC 0409-7984-23 and 250 mL serial # NDC 0409-7983-02), (Baxter, 100 mL serial # NDC 0338-0049-48 and 250 mL serial # NDC 0338-0049-02) were purchased from various medical equipment suppliers and distributors. Gammagard ® (100 mg/mL IVIG, Lot# LE12N107AB, Expiry: May 2016) manufactured by Baxter Healthcare Corporation (Westlake Village CA,) was used as a model protein. The IV tube was made of polyvinyl chloride and was 126″ long. Polycarbonate components of the tube system consisted of two male lure lock fittings and three y-connectors. The section of the IV tube on which the IV pump operated was made of silicone.
Methods
Processing of samples through IV system
In the lab, we mimicked the infusion system and the protocol used by the Outpatient Infusion Center at the University of Colorado Hospital (Fig. 1). First, 10 mL of saline was removed from the injection port of the IV bag using a siliconized plastic BD syringe. IVIG was then diluted in this saline and introduced into the IV bag for a final protein concentration of 0.4 mg/mL. Using a non-siliconized syringe, 10 mL of the IVIG-saline solution was withdrawn from the bag for particle concentration analysis in the initial IVIG-saline sample. The tube was primed using the roller clamp to control the flow rate, ensuring no air bubbles were generated during this step. The primed IV tube was then connected to the infusion pump and the flow was set to 140 mL per hour. The solution was then pumped through the tube without an in-line filter in place. Thereafter, three different in-line filters (a 1.2 μm CareFusion filter, a 1.2 μm Baxter filter and a 0.2 μm Baxter filter) were sequentially attached to the IV tube to collect filtered IVIG-saline samples. Five measurements were conducted on the initial sample collected from the injection port of the IV bag to determine the micro- and nanoparticle concentrations. For samples processed through the infusion system, particle concentrations were determined after analyzing five aliquots for each of the samples - IVIG processed through the IV tube with – a) no filter; b) 1.2 μm CareFusion (CF) filter; c) 1.2 μm Baxter (BX) filter; or d) 0.2 μm Baxter filter.
Figure 1.
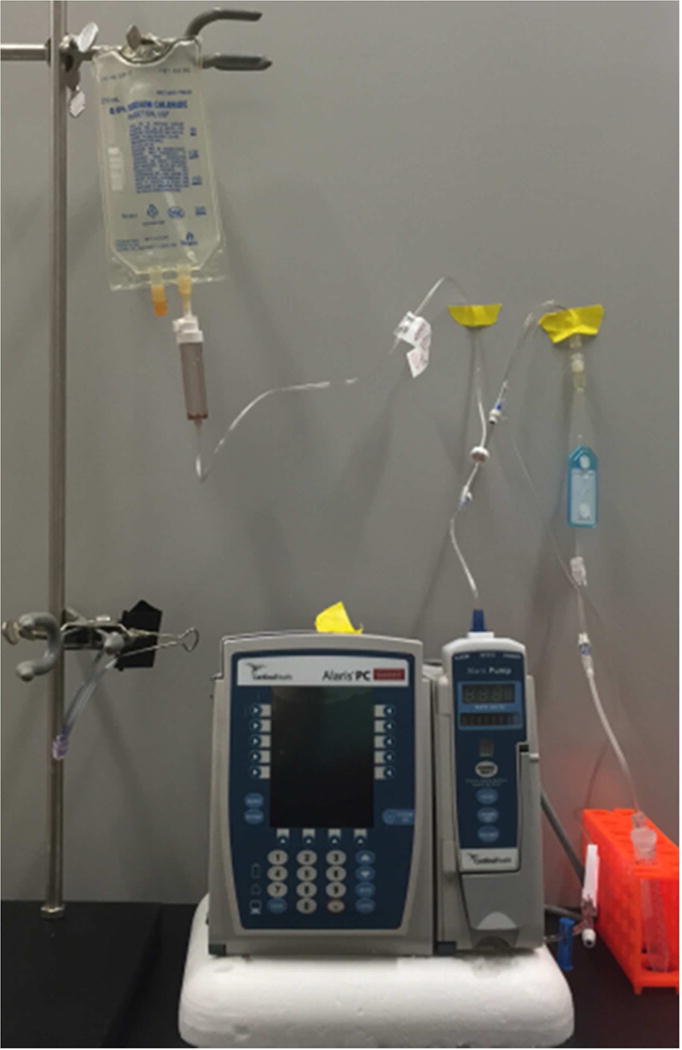
Setup in the lab replicating a typical IV infusion system used at the Outpatient Infusion Center at the University of Colorado Hospital
For characterization of IV saline without protein, a non-siliconized syringe was used to remove saline from the IV bag for initial particle counts. Then the same procedure described for IVIG was followed to obtain solutions processed through the IV system without and with in-line filters.
Particle characterization
A Protein Simple (Ottawa, ON, Canada) 4200 MFI system with a 100 μm flow cell was used to characterize particles ≥ 1 μm in size. A minimum sample volume of 0.5 mL was required, of which 0.1 mL was used as purge volume, 0.05 mL was used for background optimization and 0.35 mL was used for particle analysis.
A benchtop B3 series FlowCAM (FC) (Fluid Imaging Technologies) instrument equipped with a 100 μm multi-use flow cell was used to characterize particles ≥ 2 μm in size. The instrument used a 10X magnification lens and was controlled by the visual spreadsheet software version 3.1.10. A minimum sample volume of 500 μL was introduced in the sample chamber of which 300 μL was analyzed at a flow rate of 0.08 mL/min.
Submicron particles (≥ 60 nm) were characterized using a Nanosight Model NS 300 (Malvern Instrument Ltd., Amesbury, UK) equipped with a 488 nm laser, CMOS camera and an integrated syringe pump. NTA 2.3 (software build 033) was used for analysis. The sample chamber was manually primed with the sample using a 1 mL silicone oil-free plastic syringe (National Scientific Company, TN, USA), and then the syringe was connected to the syringe pump. Sample analysis was done at a flow rate of 10 and camera setting of 12. Video analysis was done at a detection threshold of 12.
IVIG particle concentration as a function of IV bag volume processed through IV system
IVIG (100 mg) diluted in a 250 mL saline IV bag was processed through the IV system with an in-line filter in place. Three individual IV bags were analyzed for each of the three in-line filters (a 1.2 μm CareFusion filter, a 1.2 μm Baxter filter or a 0.2 μm Baxter filter). Samples were collected as 5 sequential aliquots of 50 mL each, and particle concentrations were analyzed in each aliquot; i.e., as a function of sample volume processed through the IV system. Particle concentrations presented for IVIG-saline solution in Fig. 6 are from MFI analysis and the particle images presented in Fig. 7 are from FlowCAM analysis.
Figure 6.
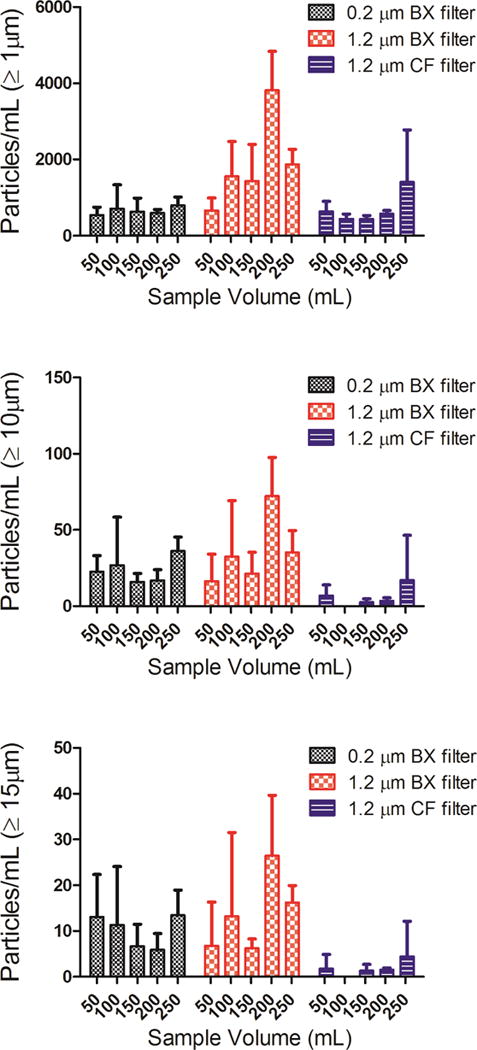
Particle concentrations as a function of volume of IVIG-saline solution processed through the IV tube with an in-line filter connected to the IV tube. Total particle concentrations ≥ 1 μm (a); ≥ 10 μm (b); and ≥ 15 μm (c) from MFI analysis. Three different in-line filters were tested: a 0.2 μm pore size manufactured by Baxter (BX); a 1.2 μm pore size manufactured by Baxter (BX); and a 1.2 μm pore size manufactured by CareFusion (CF). Error bars indicate SD for 3 independent measurements of particles in the same sample.
Figure 7.
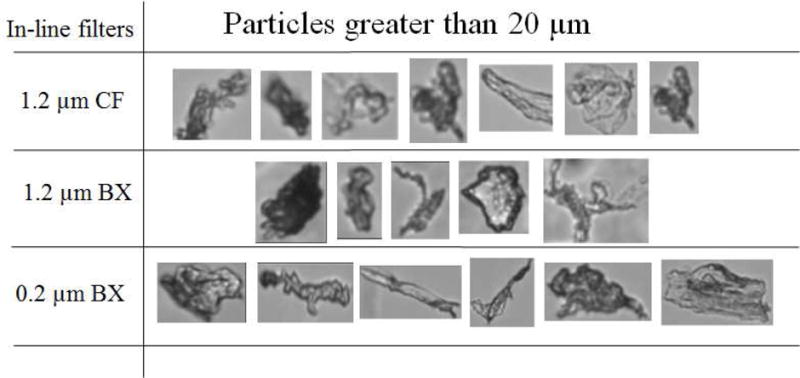
Particle images captured during FlowCAM analysis of IVIG-saline solution processed through the IV tubes with in-line filters from Baxter (BX) or Care Fusion (CF).
Particle identification using G3-ID
Particles from saline or IVIG-saline solution processed through the IV system with a 0.2 μm in-line filter were collected on custom fabricated quartz filter membrane (pore size 10–12 μm). The collected particles were characterized using a Malvern Morphologi G3-ID automated Raman spectroscopy microscope. The instrument was equipped with a diode laser (785 nm) (Malvern Instruments, Ltd, UK), a RamanRxn 1 spectrometer (Kaiser Optical Systems, Inc, USA) and a CFI 60 bright field/dark field microscope (Nikon Corporation, Japan).
Before sample filtration, the filter membrane was cleaned and scanned for any particulate content. Thereafter a total of 5 mL of sample in 500 μL aliquots was passed through the filter membrane. The membrane was then rinsed with 10 mL filtered water and allowed to dry under vacuum for 20 minutes before analysis on the Morphologi G3-ID. Particles were identified, by comparing the Raman spectra obtained from Morphologi G3-ID to those in the BioRad -KnowItAll Raman spectral library.
Protein adsorption to the infusion system during IV infusion
IVIg at a concentration of 1 mg/mL was labeled with Alexa Fluor® 488 C5 Maleimide in 50 mM sodium phosphate buffer at pH 7.0. IVIG solution was incubated overnight with 50 μM dye at room temperature away from direct light. This was followed by three buffer exchanges with 0.2 M glycine pH 4.2 to remove excess free dye. Labeled IVIG was incubated with IV bag or the tube downstream from the filter membrane for ~ 4 hours. Thereafter, these surfaces were rinsed with water to remove any excess protein that did not adsorb onto the surfaces. Images for protein adsorption to the infusion system were captured using a Nikon Digital eclipse C1, (Nikon Inc., Melville, NY) microscope with a 488 nm green excitation fluorescent filter.
Particle desorption during saline flush after IVIG-Saline solution was processed through the infusion system
IVIG labeled with Alexa-fluor 488 was spiked into IV solution of IVIG in a 250 mL Hospira IV bag at a ratio of 1:160 labeled to unlabeled protein concentration wherein the unlabeled protein concentration was 0.4 mg/mL. This solution was then pumped through the infusion system with a 0.2 μm in-line filter in place. After 250 mL of IVIG solution was pumped through the system, the tube downstream from the filter membrane was cut off, and the IV tube, the filter membrane and the tube downstream from the filter membrane were rinsed individually with 5 mL of saline solution. Images of particles desorbed from these infusion system components were captured using a Nikon Eclipse microscope model TE 300 (Nikon Inc, Melville, NY) equipped with a super high pressure Hg source and a 488 nm green excitation fluorescent filter.
RESULTS
Particle concentrations in IV Saline
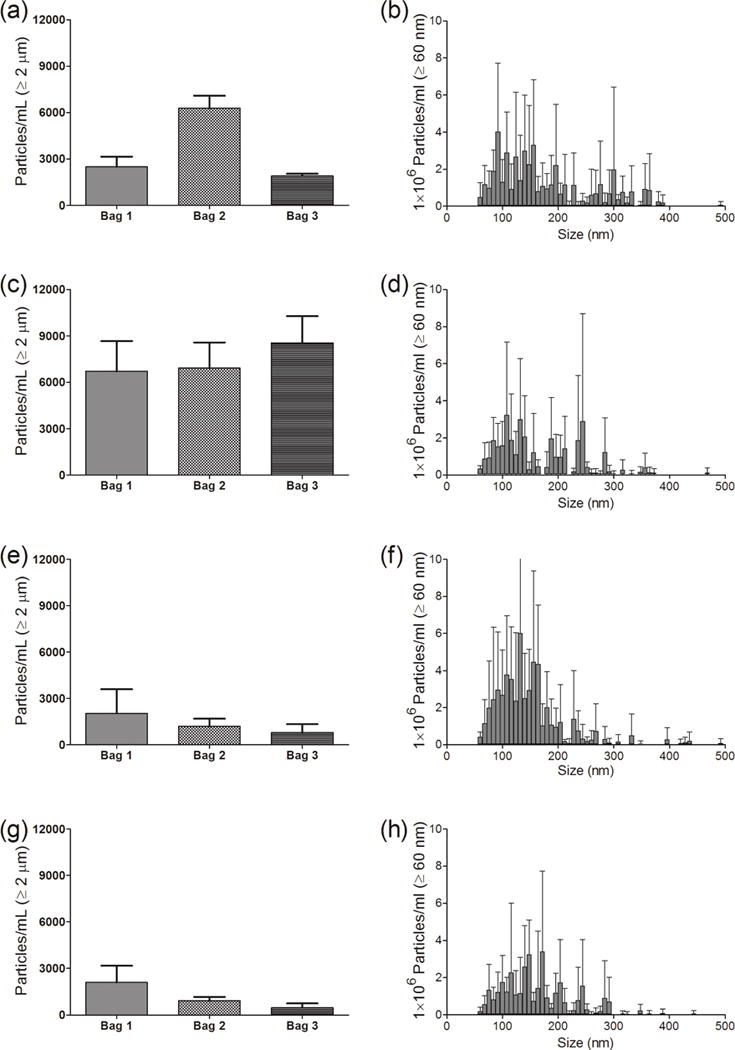
Saline from IV bags manufactured by Hospira and Baxter (250 mL and 100 mL volumes) were characterized for micro- and nanoparticle levels. Fig. 2 shows detailed results obtained from three bags of 250 mL IV saline manufactured by Hospira. In the initial saline sample from these IV bags there were several thousand microparticles ≥ 1μm in size (Fig. 2a). The microparticle counts increased slightly when saline was processed through the IV tube without an in-line filter (Fig. 2c). As expected there were substantial decreases in microparticle concentrations when in-line filters were employed (Fig. 2e, g). Nanoparticle concentrations presented in the right-hand panels of Fig. 2 were representative particle distributions between 60–500 nm from one bag of 250 mL Hospira saline. Interestingly, there was no significant difference in the nanoparticle size distribution between the initial sample and saline sample pumped through the IV system without an in-line filter (Fig. 2b, d). There was only a slight decrease in the nanoparticle concentration when the 1.2 μm Baxter filter was used (Fig. 2f). Use of a 0.2 μm Baxter filter also resulted in a decrease in the number of nanoparticles, with the majority of particles remaining having sizes smaller than 200 nm (Fig. 2h).
Figure 2.
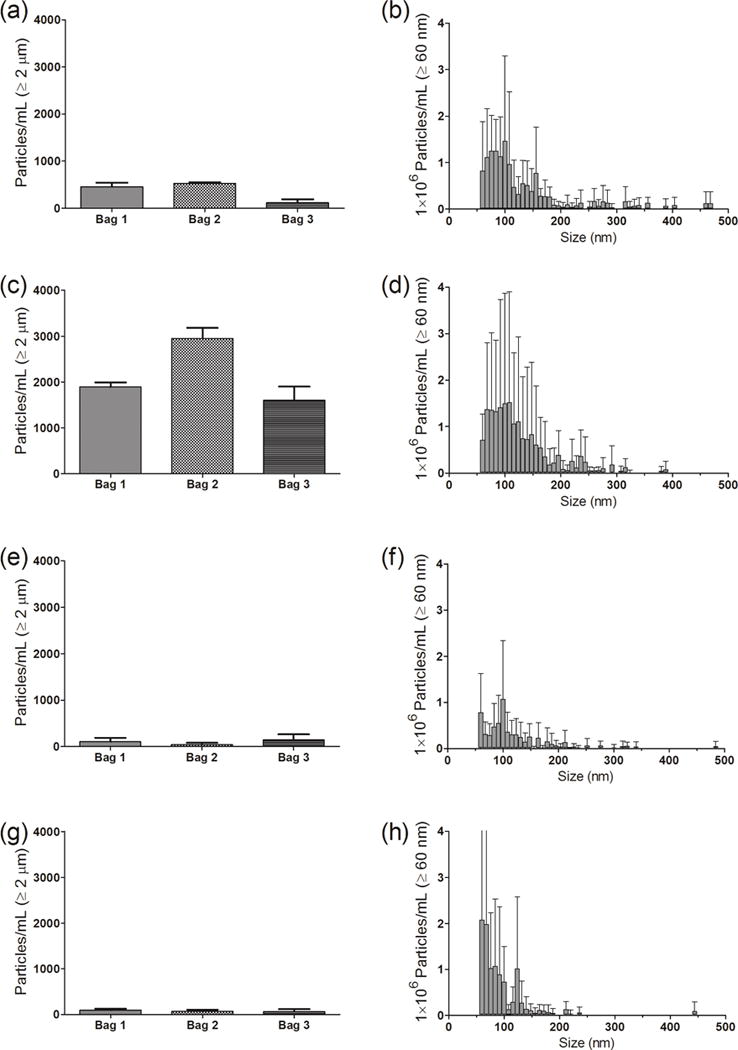
Particle concentrations in saline from an IV bag, and after the saline solution was processed through the infusion set, with or without an in-line filter connected to the IV tube. (Left panel) - Particles ≥ 1 μm from MFI analysis for three individual 250 mL IV saline bags manufactured by Hospira and (right panel) - particle distribution between 60–500 nm for one representative IV bag from NTA analysis. Results are shown for: initial sample collected from the injection port of the IV bag (a and b); sample processed through the infusion set connected without a filter (c and d); sample processed with a 1.2 μm Baxter in-line filter (e and f); and sample processed with a 0.2 μm Baxter in-line filter (g and h). Error bars indicate SD for 5 independent measurements of particles in the same sample.
The same assessments were conducted for particle concentrations in 100 mL IV saline bags manufactured by Hospira, and in 250 mL and 100 mL IV saline bags manufactured by Baxter (Fig. 3). For each of these IV bags, the initial saline sample contained hundreds to several thousand microparticles per mL, as measured by MFI (Fig. 3a) and by FC (Fig. 3b). When the IV solution was pumped through the IV system without an in-line filter, microparticle concentrations were similar to those in the initial saline solutions. The use of the three different in-line filters resulted in substantial reductions in the microparticle concentrations (Fig. 3a, b). Nanoparticle concentrations of about 4–75×106 particles per mL were observed in the initial saline samples from the three different IV bags (Fig. 3c). The particle concentrations were comparable between the initial saline sample and the saline sample processed with the IV system with no filter, but decreased to 1–21×106 particles per mL when any of the three in-line filters were employed (Fig. 3c). Overall, the micro- and nanoparticle concentrations were comparable in IV saline from different bags from the two manufacturers and also between the 100 and 250 mL bag volumes.
Figure 3.
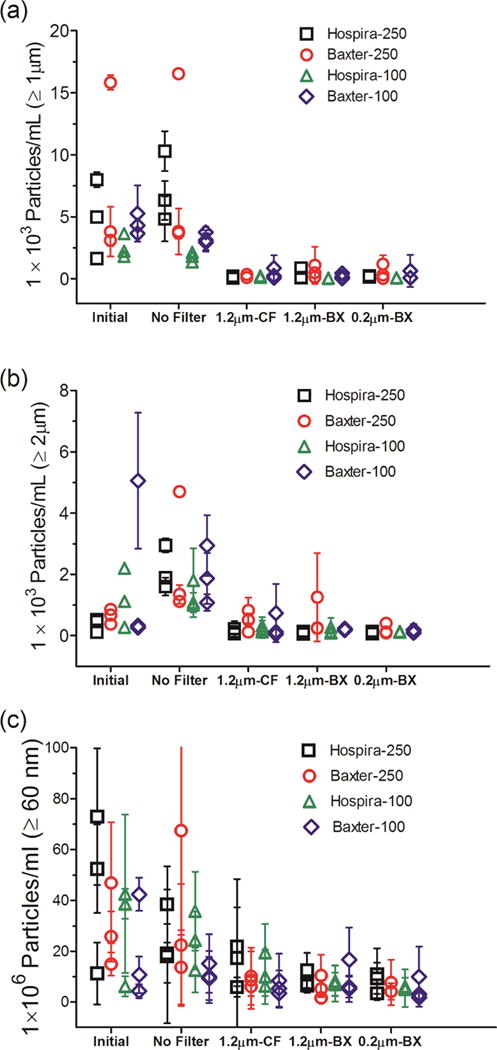
Particle concentrations in IV saline bags and after the saline solution was processed through the infusion set, with or without an in-line filter connected to the IV tube. Three IV bags manufactured by Hospira and Baxter in 250 mL and 100 mL volume each were tested. Total particle concentrations are shown for: ≥ 1 μm from MFI analysis (a); ≥ 2 μm from FC analysis (b); and ≥ 60 nm from NTA analysis (c). Three different in-line filters were tested with the IV tubes; 1.2 μm pore size manufactured by CareFusion (CF); 1.2 μm pore size manufactured by Baxter (BX); and a 0.2 μm pore size manufactured by Baxter. Each datum point shows mean of particle counts obtained for a sample processed from one IV bag. Error bars indicate SD for 5 independent measurements of particles in the same sample.
Particle concentrations in solutions of IVIG in IV saline
For characterizing the micro- and nanoparticle concentrations, solutions of IVIG were prepared by dilution of the formulation into saline IV bags (250 mL and 100 mL) manufactured by Hospira or Baxter. Detailed results are presented in Fig. 4 for particle contents in IVIG diluted into saline in IV bags (250 mL) manufactured by Hospira. There was bag-to-bag variability in the initial IVIG sample particle counts, with 8000 to 16,000 particles per mL ≥ 1 μm measured by MFI (Fig. 4a). As observed with IV saline alone, processing the IVIG solutions through the IV system without an in-line filter produced particle counts that were slightly higher compared to the initial IVIG-saline sample (Fig. 4c), and with in-line filters in place, the microparticle counts were greatly reduced (Fig 4e, g). Nanoparticle concentrations in the solution of IVIG in IV saline were not altered by processing through the IV system without a filter (Fig. 4b, d), and also did not change considerably when the in-line filters were employed during pumping through IV system (Fig. 4f and 4h)
Figure 4.
Particle concentrations in IVIG diluted in IV saline bag, and after it was processed through the infusion set, with or without an in-line filter connected to the IV tube. (Left panel) -particles ≥ 1 μm from MFI analysis for IVIG samples from three individual 250 mL IV saline bags manufactured by Hospira and (right panel) - particle distribution between 60–500 nm for one representative IV bag from NTA analysis. Results are shown for: initial sample collected from the injection port of the IV bag (a and b); sample processed through the infusion set connected without a filter (c and d); sample processed with a 1.2 μm Baxter in-line filter (e and f); and sample processed with a 0.2 μm Baxter in-line filter (g and h). Error bars indicate SD for 5 independent measurements of particles in the same sample.
Micro- and nanoparticle concentrations were also analyzed for IVIG diluted into saline in 100 mL IV saline bags manufactured by Hospira and in 250 mL and 100 mL IV saline bags manufactured by Baxter (Fig. 5). There were 3,700–23,000 particles per mL ≥ 1 μm analyzed by MFI (Fig. 5a) and 1,130–12,500 particles per mL ≥ 2 μm analyzed by FC (Fig. 5b). Although the microparticle concentrations in the initial IVIG samples from these IV bags varied considerably, they were generally higher than those observed in saline alone (Fig. 3a and 3b). In the IVIG solutions processed through the IV system without the in-line filters, the total microparticle concentrations ranged from 3,600–15,000 particles per mL ≥ 1 μm (Fig. 5a) and from 2,660–18,900 particles ≥ 2 μm (Fig. 5b). Each of the three in-line filters connected to the IV tube reduced the microparticles to 200–4000 particles per mL (Fig. 5a and 5b). The nanoparticle concentrations in IVIG prepared in saline varied considerably between the different bags, with 18–240×106 particles per mL measured in the initial samples (Fig. 5c), and levels remained high and variable in samples pumped through the IV system without a filter (Fig. 5c). However unlike the reduction in microparticle concentrations with the use of in-line filters, the nanoparticle concentrations in the IVIG-saline solution remained relatively high (7–83×106 per mL) in the samples processed through the IV system with in-line filters in place (Fig. 5c). Thus, even the smaller pore size filter tested (0.2 μm) was not effective at reducing nanoparticle concentrations in solutions of IVIG in IV saline that were pumped through the IV system.
Figure 5.
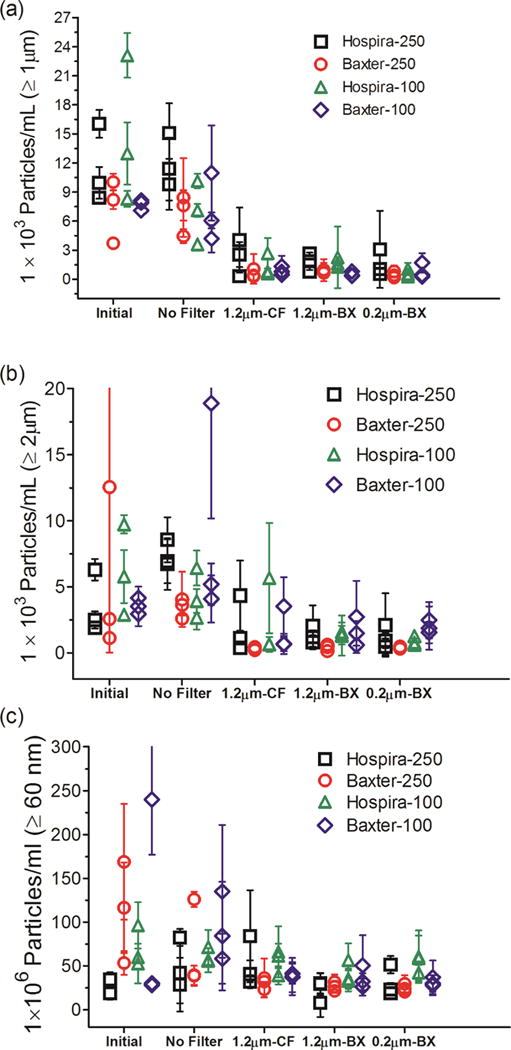
Particle concentrations in IVIG diluted in IV saline bag and after it was processed through the infusion set, with or without an in-line filter connected to the IV tube. IVIG diluted into three IV bags manufactured by Hospira and Baxter in 250 mL and 100 mL volume each were tested. Total particle concentrations are shown for: ≥ 1 μm from MFI analysis (a); ≥ 2 μm from FC analysis (b); and ≥ 60 nm from NTA analysis (c). Three different in-line filters were tested with the IV tubes; 1.2 μm pore size manufactured by CareFusion (CF); 1.2 μm pore size manufactured by Baxter (BX); and a 0.2 μm pore size manufactured by Baxter (BX). Each datum point shows mean of particle counts obtained for a sample processed from one IV bag. Error bars indicate SD for 5 independent measurements of particles in the same sample.
Particle concentration as a function of sample volume processed through the IV system
To investigate whether the particle levels in IVIG processed through the IV system with in-line filters would vary during the time course of infusion of an entire bag of 250 mL, we determined particle concentrations as a function of volume processed. Microparticle concentrations were analyzed by MFI for 5 aliquots of 50 mL each. These aliquots were obtained sequentially as the 250 mL IVIG saline solution was pumped. Overall, with all three filters tested there were no trends in the levels of microparticles as a function of volume of solution processed through the IV system. (Fig. 6). Interestingly, however, there were a considerable number of particles ≥ 10 μm (Fig. 6b) and ≥ 15 μm (Fig. 6c) in the IVIG-saline solutions. Representative images for these particles ≥ 20 μm and as large as 60 μm obtained with FC analysis are presented in Fig. 7.
Identification of particles in the IV infusion system using the Morphologi G3-ID
To identify the chemical characteristic and potential sources for microparticles, Raman microscopy was used to acquire images and Raman spectra for selected particles. Particles in the IV solution of IVIG processed through the IV infusion set connected to the 0.2 μm in-line filter were collected onto a quartz filter membrane for identification by a Morphologi G3-ID automated Raman microscope. This technique enabled the imaging and identification of proteinaceous particles (Fig. 8a, b), based on the characteristic bands in the Raman spectrum for phenylalanine, tyrosine and beta-sheet structure. Also detected were non-proteinaceous particles composed of polycarbonate (Fig. 8c, d), which were identified by a Raman spectrum that match that of polycarbonate in a reference spectral library. The polycarbonate particles were probably shed from the IV line connectors and from the housing for the in-line filter. Also, particles composed of PVC were identified (data not shown), which most likely were shed from the IV line downstream from the filter.
Figure 8.
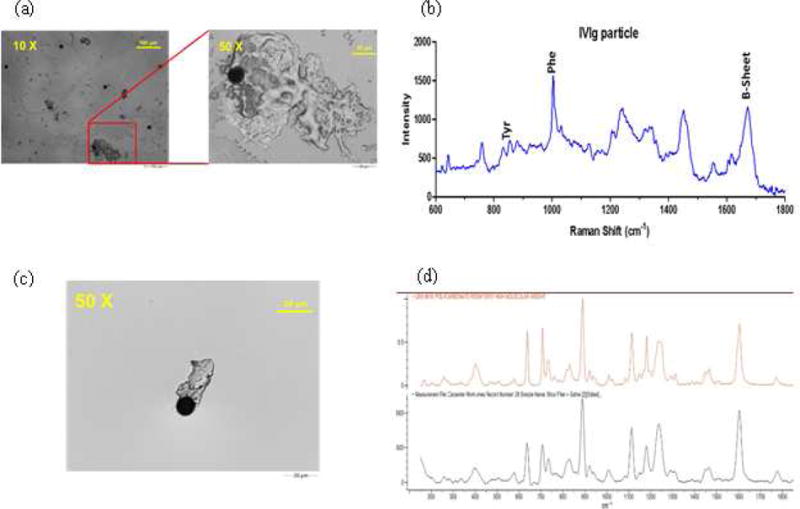
Representative images and Raman spectrum obtained by Morphologi G3-ID upon analysis of IVIG processed through the IV tube connected to a 0.2μm Baxter in-line filter. Image of a protein particle (a); Raman spectrum for the protein particle (b); image for polycarbonate particle (c); and Raman spectrum for polycarbonate (d). Black spectrum is for the sample particle and orange is the reference spectrum from the Raman spectral library.
Protein adsorption to the infusion system and desorption during saline flush
We hypothesized that one source of protein particles could be protein that had adsorbed to the liquid-solid interfaces (e.g., downstream side of the filter membrane, filter housing and tubing walls), that formed a film which was then sloughed off. In particular, formation of particles by this mechanism in areas downstream from the upper surface of the filter membrane could account for the substantial number of microparticles observed; even when an in-line filter with a 0.2 μm pore size was used. In initial studies, we incubated fluorescently-labeled IVIG with the entire infusion system and observed protein adsorption to the walls of the IV bag and the IV tubing. Representative images from the latter are shown in Fig. 9a. We next spiked fluorescently labeled IVIG into a solution of the protein in a 250 mL bag of IV saline, and the entire bag volume was processed through the IV system with a 0.2 μm in-line filter in place. After the infusion procedure, the tube downstream from the filter membrane was cut off and the filter membrane, the tube downstream from the filter membrane and the IV tube were flushed with protein-free IV saline. It should be noted that a similar saline flush is often used in the clinic to prevent wastage of the drug product that may still be in the IV tubes. In our study, after saline flush, we observed numerous particles with detectable fluorescent signal in the size range of ca. > 10 μm that sloughed off from the IV tubes (Fig. 9b), filter membrane (Fig. 9c); and the tube downstream from the filter membrane (Fig. 9d). These results support our hypothesis and show that even with an in-line filter in place, relatively large protein microparticles can form downstream from the filter membrane and be delivered to patients, in addition to the high level of nanoparticles that are not removed by the filter.
Figure 9.
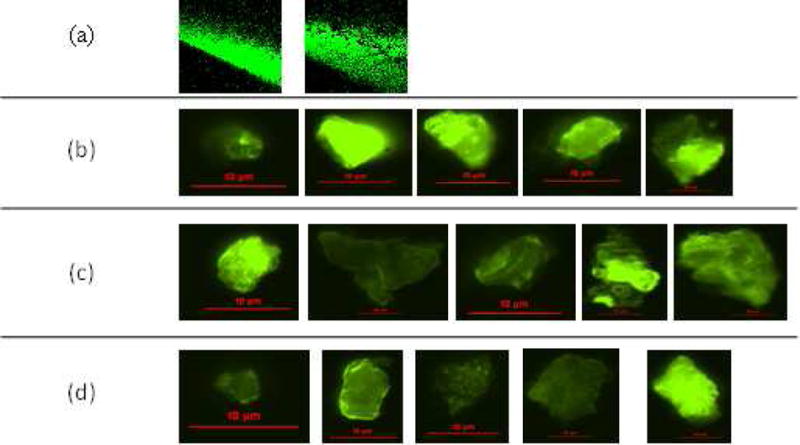
Representative images of: fluorescently labeled IVIG adsorbing to the surface of an IV tube (a); particle images from saline used to flush the IV tube (b); filter membrane (c); and tube downstream from the filter membrane (d). An IVIG-saline solution spiked with fluorescently labeled IVIG molecules was processed through the IV system with a 0.2μm Baxter in-line filter.
DISCUSSION
We observed high numbers of subvisible particles – particularly in the submicron size range – in both IV saline and solutions of IVIG in IV saline, which were processed through an IV infusion system. Importantly, even when in-line filters were employed during the IV infusion procedure there were high levels of particles in the processed solution. Therefore, with IV administration of therapeutic proteins, high levels of subvisible particles are delivered to patients. Presently regulatory authorities, such as the US Food and Drug Administration (FDA), recognize such particles as critical product quality attributes that may pose a risk to patient safety. Numerous studies – including human clinical investigations, in animal models and with in vitro assays with human cells - have shown a link between subvisible particles and unwanted immunogenicity of therapeutic protein products.9,10,23–26
A debate in the literature centers on whether there is absolute proof that particles at this concentration cause adverse immunogenicity in patients.27,28 However, regulatory agencies advocate precaution when dealing with factors that could pose a risk to patient health, but where this link has not been definitively and generally established. For example, a Commentary authored by FDA regulators states that “a strong scientific basis for a product attribute having a potential outcome of harm should warrant that the attribute be presumed to be critical, even if a completely defined link to clinical performance has not been demonstrated”. Subvisible particles are presently in this regulatory domain. Hence their formation and presence in therapeutic protein products needs be monitored rigorously at all stages of a product’s life history, from product manufacture through delivery to the patient. The Commentary further states, in reference to subvisible particles, “assessment of such an attribute needs to evolve with increased scientific knowledge and technical capabilities and thereafter actions should be undertaken to lessen the probability of occurrences and severity of harm pertaining to that product quality attribute”.29
This statement translates to the expectation that methods used for quantifying and characterizing subvisible particles should be based on the technical advances in the field. Further, all sources of subvisible particles should be identified and control strategies should be developed to minimize their presence. Given these expectations and the results of the present study, it is imperative that the quality of IV delivered therapeutic protein products be assessed quantitatively with state-of-the art instrumentation. Furthermore, such studies should include the complete clinical infusion protocol and systems employed in clinical practice. Such work is needed for each product on the market and should be executed with recommended IV solutions, lines, pumps and in-line filters.
Recently, however, quality assessments based on particles in IV solutions have focused mostly on visible particles. Observations of visible particles have resulted in recalls of several lots of IV saline in the last few years and therefore a shortage in supply of IV saline manufactured by both Hospira and Baxter.30 Our study suggests that IV saline is also a major contributor of subvisible particles. Development of successful therapeutic products requires minimizing aggregates or particles. Because of the high levels of subvisible particles in IV saline, even if the protein formulation itself in the product vial was particle-free to begin with, a high level of particles might be delivered into patients during an IV infusion.
This problem is especially of concern for drug products that are delivered via IV infusion without an in-line filter. Based on our data for the particle concentrations in IVIG in IV saline solution processed though the infusion system without an in-line filter, in a 250 mL infusion there would be billions of nano- and millions of microparticles delivered to the patient. For more than 50% of the mAb products currently marketed in the U.S., package inserts do not recommend the use of an in-line filter.1 Similarly, a recent review by Werner et al. noted that more than 80% of the approved therapeutics mentioned in the Rote List ® (list of medicinal products marketed in Germany) have no recommendations for filtration during preparation or administration.31
However, we observed that even when an in-line filter was employed during the IV infusion procedure, there were high numbers of nanoparticles present in the processed solutions of IV saline and IVIG. As expected, the total counts of microparticles were greatly decreased by the in-line filters, but there were still substantial levels microparticles ≥10 μm. We hypothesized that these larger sized particles may be contributed by the components downstream from the filter membrane. The framework on which the membrane for the in-line filters rests and the filter housing both are made of polycarbonate. We found evidence with Raman microscopy that some of the particles recovered distal to the filter were polycarbonate, which most likely represent washed off components downstream from the membrane surface. Also, the polycarbonate components and the polyvinyl IV tubing are relatively hydrophobic surfaces, and protein molecules readily adsorb onto such surfaces. Microparticles, therefore, shed from these surfaces would most likely be coated with protein molecules. Furthermore, our studies with fluorescently labeled IVIG molecules demonstrated that the protein readily adsorbed to the tubing and other parts of the IV system, resulting in visible films of adsorbed protein. As solution is run through the system, parts of this film may slough off resulting in relatively large numbers of micron-sized particles. Because this phenomenon could also occur downstream from the filter membrane, particles generated herein would be present in the IV solution administered to patients. Overall, current in-line filter systems are not effective at preventing infusion of large quantities of particles into patients during IV administration.
Approaches to mitigate delivery of particles to patients during IV infusion should include development of manufacturing methods to lower the particle levels in IV solutions. More importantly, it is critical that there is also development of in-line filters that effectively reduce the levels of both nano- and microparticles. As part of these efforts, it is also important that problems caused by the filters themselves are also addressed. As found in the current study, some earlier investigators have also reported undesirable effects of in-line IV filters such as protein adsorption to the filter components and accelerated particle formation due to foreign particles shedding off from the filter membranes.32 Thus, extensive work is needed in developing/designing in-line filters that are compatible with protein products and are effective in removing particles, while not contributing to the generation of particles themselves.
Acknowledgments
The authors would like to thank Beth Moran, RN and Mary Cousins, RN for expert advice about the clinical practices for preparation and IV infusion of therapeutic proteins and for their help in replicating the IV infusion system in the lab. We gratefully acknowledge support from NIH Grant 5RO1 EB006006.
Footnotes
Publisher's Disclaimer: This is a PDF file of an unedited manuscript that has been accepted for publication. As a service to our customers we are providing this early version of the manuscript. The manuscript will undergo copyediting, typesetting, and review of the resulting proof before it is published in its final citable form. Please note that during the production process errors may be discovered which could affect the content, and all legal disclaimers that apply to the journal pertain.
References
- 1.Online package inserts for individual drug.
- 2.Yalkowsky SHKJF, Ward GH. Formulation-Related Problems Associated with Intravenous Drug Delivery. Journal of Pharmaceutical Sciences. 1998;87(7):787–796. doi: 10.1021/js980051i. [DOI] [PubMed] [Google Scholar]
- 3.Turco SJ. Sterile Dosage Forms- their preparation and clinical application, 4 ed. Lea and Febiger. 1994:28–38. [Google Scholar]
- 4.Berger M. Adverse effects of IgG therapy. Journal of Allergy and Clinical Immunology: In Practice. 2013;1(6):558–566. doi: 10.1016/j.jaip.2013.09.012. [DOI] [PubMed] [Google Scholar]
- 5.Bichuetti-Silva DC, Furlan FP, Nobre FA, Pereira CTM, Gonçalves TRT, Gouveia-Pereira M, Rota R, Tavares L, Mazzucchelli JTL, Costa-Carvalho BT. Immediate infusion-related adverse reactions to intravenous immunoglobulin in a prospective cohort of 1765 infusions. International Immunopharmacology. 2014;23(2):442–446. doi: 10.1016/j.intimp.2014.09.015. [DOI] [PubMed] [Google Scholar]
- 6.Kang SP, Saif MW. Infusion-related and hypersensitivity reactions of monoclonal antibodies used to treat colorectal cancer- identification, prevention and management. The Journal of Supportive Oncology. 2007;5(9):451–457. [PubMed] [Google Scholar]
- 7.Lenz HJ. Management and Preparedness for Infusion and Hypersensitivity Reactions. The Oncologist. 2007;12(5):601–609. doi: 10.1634/theoncologist.12-5-601. [DOI] [PubMed] [Google Scholar]
- 8.Frost H. Antibody-mediated side effects of recombinant proteins. Toxicology. 2005;209(2):155–160. doi: 10.1016/j.tox.2004.12.028. [DOI] [PubMed] [Google Scholar]
- 9.Rombach-Riegraf V, Karle AC, Wolf B, Sordé L, Koepke S, Gottlieb S, Krieg J, Djidja M-C, Baban A, Spindeldreher S, Koulov AV, Kiessling A. Aggregation of Human Recombinant Monoclonal Antibodies Influences the Capacity of Dendritic Cells to Stimulate Adaptive T-Cell Responses In Vitro. PLoS ONE. 2014;9(1):e86322. doi: 10.1371/journal.pone.0086322. [DOI] [PMC free article] [PubMed] [Google Scholar]
- 10.Ahmadi M, Bryson CJ, Cloake EA, Welch K, Filipe V, Romeijn S, Hawe A, Jiskoot W, Baker MP, Fogg MH. Small Amounts of Sub-Visible Aggregates Enhance the Immunogenic Potential of Monoclonal Antibody Therapeutics. Pharmaceutical Research. 2014;32(4):1383–1394. doi: 10.1007/s11095-014-1541-x. [DOI] [PubMed] [Google Scholar]
- 11.Joubert MK, Hokom M, Eakin C, Zhou L, Deshpande M, Baker MP, Goletz TJ, Kerwin BA, Chirmule N, Narhi LO, Jawa V. Highly Aggregated Antibody Therapeutics Can Enhance the in Vitro Innate and Late-stage T-cell Immune Responses. Journal of Biological Chemistry. 2012;287(30):25266–25279. doi: 10.1074/jbc.M111.330902. [DOI] [PMC free article] [PubMed] [Google Scholar]
- 12.Hermeling S, Schellekens H, Maas C, Gebbink MFBG, Crommelin DJA, Jiskoot W. Antibody response to aggregated human interferon alpha2b in wild-type and transgenic immune tolerant mice depends on type and level of aggregation. Journal of Pharmaceutical Sciences. 2006;95(5):1084–1096. doi: 10.1002/jps.20599. [DOI] [PubMed] [Google Scholar]
- 13.Demeule B, Palais C, Machaidze G, Gurny R, Arvinte T. New methods allowing the detection of protein aggregates. mAbs. 2009;1(2):142–150. doi: 10.4161/mabs.1.2.7632. [DOI] [PMC free article] [PubMed] [Google Scholar]
- 14.Kumru OS, Liu J, Ji JA, Cheng W, Wang YJ, Wang T, Joshi SB, Middaugh CR, Volkin DB. Compatibility, physical stability, and characterization of an IgG4 monoclonal antibody after dilution into different intravenous administration bags. Journal of Pharmaceutical Sciences. 2012;101(10):3636–3650. doi: 10.1002/jps.23224. [DOI] [PubMed] [Google Scholar]
- 15.Ikeda R, Vermeulen LC, Lau E, Jiang Z, Saha S, Reichelderfer M, Kolesar JM. Stability of infliximab in polyvinyl chloride bags. American Journal of Health-System Pharmacy. 2012;69(17):1509–1512. doi: 10.2146/ajhp100116. [DOI] [PMC free article] [PubMed] [Google Scholar]
- 16.Kwong Glover ZW, Gennaro L, Yadav S, Demeule B, Wong PY, Sreedhara A. Compatibility and stability of pertuzumab and trastuzumab admixtures in i.v. infusion bags for coadministration. Journal of Pharmaceutical Sciences. 2013;102(3):794–812. doi: 10.1002/jps.23403. [DOI] [PubMed] [Google Scholar]
- 17.Ikesue H. Stability of cetuximab and panitumumab in glass vials and polyvinyl chloride bags. American Journal of Health-System Pharmacy. 2010;67:223–227. doi: 10.2146/ajhp090031. [DOI] [PubMed] [Google Scholar]
- 18.Werk T, Volkin DB, Mahler H-C. Effect of solution properties on the counting and sizing of subvisible particle standards as measured by light obscuration and digital imaging methods. European Journal of Pharmaceutical Sciences. 2014;53:95–108. doi: 10.1016/j.ejps.2013.12.014. [DOI] [PubMed] [Google Scholar]
- 19.Barnard JG, Singh S, Randolph TW, Carpenter JF. Subvisible particle counting provides a sensitive method of detecting and quantifying aggregation of monoclonal antibody caused by freeze-thawing: Insights into the roles of particles in the protein aggregation pathway. Journal of Pharmaceutical Sciences. 2011;100(2):492–503. doi: 10.1002/jps.22305. [DOI] [PubMed] [Google Scholar]
- 20.Mcleod AGWIR, Zheng S, Hayward CPM. Loss of factor VIII activity during storage in PVC containers due to adsorption. Haemophilia. 2000;6:89–92. doi: 10.1046/j.1365-2516.2000.00382.x. [DOI] [PubMed] [Google Scholar]
- 21.Mehta SB, Lewus R, Bee JS, Randolph TW, Carpenter JF. Gelation of a Monoclonal Antibody at the Silicone Oil–Water Interface and Subsequent Rupture of the Interfacial Gel Results in Aggregation and Particle Formation. Journal of Pharmaceutical Sciences. 2015;104(4):1282–1290. doi: 10.1002/jps.24358. [DOI] [PubMed] [Google Scholar]
- 22.Rudiuk S, Cohen-Tannoudji L, Huille S, Tribet C. Importance of the dynamics of adsorption and of a transient interfacial stress on the formation of aggregates of IgG antibodies. Soft Matter. 2012;8(9):2651. [Google Scholar]
- 23.Christie M, Torres RM, Kedl RM, Randolph TW, Carpenter JF. Recombinant Murine Growth Hormone Particles are More Immunogenic with Intravenous than Subcutaneous Administration. Journal of Pharmaceutical Sciences. 2014;103(1):128–139. doi: 10.1002/jps.23794. [DOI] [PMC free article] [PubMed] [Google Scholar]
- 24.Pisal DS, Kosloski MP, Middaugh CR, Bankert RB, Balu-Iyer SV. Native-like aggregates of factor VIII are immunogenic in von Willebrand factor deficient and hemophilia a mice. Journal of Pharmaceutical Sciences. 2012;101(6):2055–2065. doi: 10.1002/jps.23091. [DOI] [PMC free article] [PubMed] [Google Scholar]
- 25.Shomali MTS, Freitag AJ, Engert J, Winter G, Siedler M, KaymakCalan Z, Carpenter JF, Randolph TW. Dose levels in particulate containing formulations impact anti-drug antibody responses to murine monoclonal antibody in mice. Journal of Pharmaceutical Sciences. 2015;104:1610–1621. doi: 10.1002/jps.24413. [DOI] [PubMed] [Google Scholar]
- 26.Fradkin AH, Carpenter JF, Randolph TW. Immunogenicity of aggregates of recombinant human growth hormone in mouse models. Journal of Pharmaceutical Sciences. 2009;98(9):3247–3264. doi: 10.1002/jps.21834. [DOI] [PubMed] [Google Scholar]
- 27.Singh SK, Afonina N, Awwad M, Bechtold-Peters K, Blue JT, Chou D, Cromwell M, Krause HJ, Mahler HC, Meyer BK, Narhi L, Nesta DP, Spitznagel T. An industry perspective on the monitoring of subvisible particles as a quality attribute for protein therapeutics. Journal of Pharmaceutical Sciences. 2010;99(8):3302–3321. doi: 10.1002/jps.22097. [DOI] [PubMed] [Google Scholar]
- 28.Joubert MK, Hokom M, Eakin C, Zhou L, Deshpande M, Baker MP, Goletz TJ, Kerwin BA, Chirmule N, Narhi LO, Jawa V. Highly aggregated antibody therapeutics can enhance the in vitro innate and late-stage T-cell immune responses. J Biol Chem. 2012;287(30):25266–25279. doi: 10.1074/jbc.M111.330902. [DOI] [PMC free article] [PubMed] [Google Scholar]
- 29.Rosenberg AS, Verthelyi D, Cherney BW. Managing uncertainty: A perspective on risk pertaining to product quality attributes as they bear on immunogenicity of therapeutic proteins. Journal of Pharmaceutical Sciences. 2012;101(10):3560–3567. doi: 10.1002/jps.23244. [DOI] [PubMed] [Google Scholar]
- 30.U.S. Food and Drug Administration. Recalls, Market Withdrawals, & Safety Alerts Search. 2015. [Google Scholar]
- 31.Werner BPaWG. Particle contamination of parenteralia and in-line filtration of proteinaceous drugs. International journal of pharmaceutics. 2015 doi: 10.1016/j.ijpharm.2015.10.082. [DOI] [PubMed] [Google Scholar]
- 32.Liu L, Randolph TW, Carpenter JF. Particles shed from syringe filters and their effects on agitation-induced protein aggregation. Journal of Pharmaceutical Sciences. 2012;101(8):2952–2959. doi: 10.1002/jps.23225. [DOI] [PubMed] [Google Scholar]


