

Abstract
With unique 2D structures and intriguing physicochemical properties, various types of transition metal dichalcogenides (TMDCs) have attracted much attention in many fields including nanomedicine. Hence, it is of great importance to carefully study the in vivo biodistribution, excretion, and toxicology profiles of different TMDCs, and hopefully to identify the most promising type of TMDCs with low toxicity and fast excretion for further biomedical applications. Herein, the in vivo behaviors of three representative TMDCs including molybdenum dichalcogenides (MoS2), tungsten dichalcogenides (WS2), and titanium dichalcogenides (TiS2) nanosheets are systematically investigated. Without showing significant in vitro cytotoxicity, all the three types of polyethylene glycol (PEG) functionalized TMDCs show dominate accumulation in reticuloendothelial systems (RES) such as liver and spleen after intravenous injection. In marked contrast to WS2‐PEG and TiS2‐PEG, which show high levels in the organs for months, MoS2‐PEG can be degraded and then excreted almost completely within one month. Further degradation experiments indicate that the distinctive in vivo excretion behaviors of TDMCs can be attributed to their different chemical properties. This work suggests that MoS2, among various TMDCs, may be particularly interesting for further biomedical applications owning to its low toxicity, capability of biodegradation, and rapid excretion.
Keywords: biodistribution, degradation, excretion, TMDCs, toxicology
1. Introduction
In the past few years, 2D nanomaterials have received tremendous attention and been applied in various fields due to their fantastic physical and chemical properties.1, 2, 3, 4, 5, 6, 7, 8 As an analogue of 2D graphene, transition metal dichalcogenides (TMDCs), generally described as the formula MX2, in which M is the transition metal from groups 4–10 of the periodic table and X is a chalcogen (S, Se, or Te), have attracted great interests due to their rich electronic, optical, mechanical, and chemical properties.4, 9, 10, 11, 12, 13 In particular, different combinations of transition metals and chalcogens, as well as their various arrangements in the 2D crystals, would lead to a substantial range of properties, making TMDC materials interesting for applications in biological systems. For example, many biosensing platforms have been fabricated based on TMDCs for detection of biological molecules.14, 15 The high near infrared (NIR) absorbance of selected 2D TMDCs, such as molybdenum dichalcogenides (MoS2), tungsten dichalcogenides (WS2), and titanium dichalcogenides (TiS2), have made them ideal agents for photothermal therapy.16, 17, 18, 19 The extraordinary surface‐area‐to‐mass ratio of single layered 2D TMDCs affords them high drug loading capacity useful for drug delivery and combination cancer therapy.20, 21 TMDCs and their doped or composite nanostructures have also shown great promises as novel contrast agents for multimodal biomedical imaging.22, 23, 24, 25 Additionally, TMDCs with interesting mechanical properties have been explored in the area of tissue engineering.26 Considering the great potential of TMDCs in biomedical applications, it is therefore critically important to systematically evaluate their long‐term in vivo behaviors.
In the past few years, there have been a number of reports studying the toxicity of TMDCs nanomaterials in vitro and in vivo.27, 28, 29, 30, 31 At the in vitro level, it was found that the cytotoxicity of MoS2, WS2, and WSe2 nanosheets appeared to be low to different cell lines.15, 18, 32, 33 On the other hand, in our previous reports about the use of polyethylene glycol (PEG) functionalized TMDCs for in vivo imaging and therapy applications, we have uncovered that PEGylated MoS2 and WS2 showed no appreciable acute toxicity to the treated mice at our tested dose.16, 20, 23, 34 Similar findings have also been reported by several other groups regarding the in vivo toxicity of TMDCs with biocompatible surface coatings.21, 30, 35 However, the detailed in vivo long‐term degradation and excretion behaviors of various TMDCs remain to be investigated to our best knowledge. In addition, it would be very interesting and important to find out which type of TMDCs has the fastest excretion and least long‐term retention, and thus could be the most promising one for further in vivo biomedical applications.
In this work, we have synthesized three representative TMDCs (MoS2, WS2, and TiS2) by a high‐temperature solution‐phase method and then broke them into small nanosheets under ultra‐sonication. After functionalization with PEG, these three types of PEGylated TMDCs nanosheets showed great physiological stability and quite low in vitro cytotoxicity. Healthy mice were intravenously (i.v.) injected with MS2‐PEG (M = Mo, W, Ti) and then sacrificed at different time points with major organs collected. All the three types of MS2‐PEG nanosheets showed dominant accumulation in reticuloendothelial systems (RES) such as liver and spleen. Interestingly, while high levels of W and Ti were detected in RES organs of mice post injection of WS2‐PEG and TiS2‐PEG, respectively, even after 30 d, we found that MoS2‐PEG could be excreted from the body almost completely within 30 d by urine and feces, likely owing to the oxidization of MoIVS2 into water‐soluble MoVI‐oxide species (e.g., MoO4 2−). The blood analysis and histological examination of those mice showed no obvious in vivo toxicity of all three types of PEGylated TMDCs at our tested dose, even for WS2‐PEG and TiS2‐PEG with long‐term retention in mouse RES organs. Our work suggests that MoS2 could be a promising 2D nanomaterial for biomedical applications due to its biodegradability and relatively fast excretion.
2. Results and Discussion
2.1. Synthesis and Surface Modification of MoS2, WS2, and TiS2 Nanosheets
TMDCs (MoS2, WS2, and TiS2) nanoflakes were synthesized by a high‐temperature solution‐phase method, TEM images (Figure S1, Supporting Information) have showed the morphologies of MoS2, WS2, and TiS2 nanoflakes. Then the synthesized MoS2, WS2, and TiS2 were dissolved in 1‐methyl‐2‐pyrrolidinone (NMP) and broken into small and single‐layer nanosheets under ultrasonication36 (Figure 1 a). In brief, the metal precursors (MoCl5, WCl6, and TiCl4) were first reacted with oleylamine (OM) to obtain M‐OM complexes (M = Mo, W, and Ti). Upon injection of the sulfur solution by dissolving sulfur powder in OM, the solution color immediately turned into black or deep brown, suggesting the rapid formation of TMDC nanoflakes. Transmission electron microscope (TEM) image (Figure S1, Supporting Information) indicated that the synthesized TMDCs exhibited flake‐like structures. Under ultrasonication in NMP solution, all TMDCs nanoflakes were broken into smaller nanosheets, which became soluble in water. The phase analysis of the as‐prepared nanosheets was also determined by power X‐ray diffraction (XRD) (Figure S2, Supporting Information). All peaks in these spectra matched well with the reported results.16, 17, 20
Figure 1.
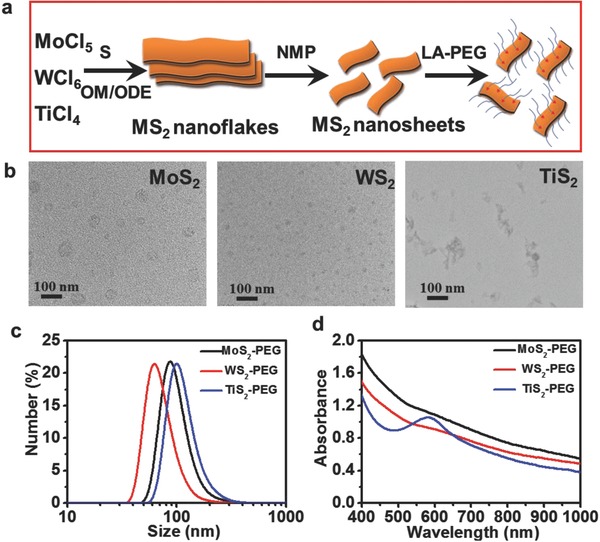
Synthesis and characterization of PEGylated MS2 (M = Mo, W, Ti) nanosheets. a) A scheme of MS2 TMDC nanosheets synthesis process. b) TEM images of PEGylated MoS2, WS2, and TiS2 nanosheeets. c) DLS size distribution of PEGylated MoS2, WS2, and TiS2 nanosheets in water. d) UV–vis‐NIR absorbance spectra of PEGylated MosS2, WS2, and TiS2 nanosheets with the concentration of 0.02 mg mL−1.
After ultrasonication in NMP, the as‐synthesized MoS2/WS2/TiS2 nanosheets became water‐soluble, we have tested the dynamic light scattering (DLS) size distribution of these three nanosheets in water (Figure S3, Supporting Information). Since the as‐made MoS2/WS2/TiS2 presented good water‐solubility but bad stability in physiological solutions in the presence of salts. We then chose lipoic acid conjugated 5 kDa PEG (LA‐PEG5k) to modify MoS2/WS2/TiS2 nanosheets through M‐S (M = Mo, W, Ti) bond. Thermogravimetric analysis showed the weight percentages of MoS2, WS2, and TiS2 in the PEGylated samples were determined to be 25.99%, 59.72%, and 46.92% (Figure S4, Supporting Information), respectively. After PEGylation, the hydrodynamic diameters of MoS2‐PEG, WS2‐PEG, and TiS2‐PEG were determined by DLS to be ≈91, ≈72, and ≈102 nm (Figure 1c), respectively. We also have collected the statistics of TEM measured sizes about PEGylated MoS2, WS2, and TiS2 (Figure S5, Supporting Information). Through the TEM images we could find that the diameters of PEGylated MoS2/WS2/TiS2 were smaller compared with MoS2/WS2/TiS2 nanosheets, which could be attributed to the functionalization process. MS2 were synthesized by a high‐temperature solution‐phase method and then broken in NMP under ultrasonication to obtain small nanosheets. After that, the small nanosheets were functionalized by LA‐PEG under ultrasonication in the water phase. The modification process would further broke the nanosheets, which lead smaller size compared with MS2 under TEM.
All PEGylated TMDC nanosheets were rather stable in various physiological solutions including phosphate buffered saline (PBS), RPMI‐1640 medium, and fetal bovine serum (Figure S6, Supporting Information). UV–vis‐NIR spectra of PEGylated TMDC nanosheets all showed strong wide‐band NIR absorbance (Figure 1d), with the weight extinction coefficients of MoS2‐PEG, WS2‐PEG, and TiS2‐PEG measured to be 26.36, 23.42, and 22.04 Lg−1 cm−1, respectively, at 808 nm.
2.2. In Vitro Cytotoxicity Study for PEGylated TMDCs
We then carried out a number of different assays to study the in vitro cytotoxicity of various MS2‐PEG (M = Mo, W, and Ti) samples. First, the standard 3‐(4,5‐dimethylthiazol‐2‐yl)‐2, 5‐diphenyltetrazolium bromide (MTT) assay was performed on mouse macrophage Raw 264.7, human renal epithelial cell 293T and mouse breast cancer 4T1 cell lines (Figure S7, Supporting Information). After incubation with different concentrations of PEGylated MoS2, WS2, and TiS2 for 24 h, we did not find any serious cytotoxicity for these three kinds of MS2‐PEG nanosheets to both two cell lines even at high concentrations (e.g., 200 μg mL−1, in terms of MS2 weight concentrations) (Figure 2 a,b). Next, the lactate dehydrogenase (LDH) leakage assay was performed to test the integrity of cell membrane after cells were exposed to PEGylated TMDCs for 24 h (Figure 2c).37 It was found that the all these three MS2‐PEG (M = Mo, W, and Ti) showed little damage to cells even at high concentrations. When cells are under stimulation by foreign damage signals, the oxidative stress inside cells may be increased to activate the cellular defense system.38 Herein, we used a dihydroethidine (DHE) probe to detect the intracellular reactive oxygen species (ROS, e.g., peroxide and superoxide) in cells after incubation with MS2‐PEG (Figure 2d). Compared with the control group, the experimental groups also showed no noticeable increase of intracellular ROS generation after treatment by MS2‐PEG. All these data put together indicated that our PEGylated MoS2, WS2, and TiS2 nanosheets exhibited no appreciable in vitro cytotoxicity within our tested dose range.
Figure 2.
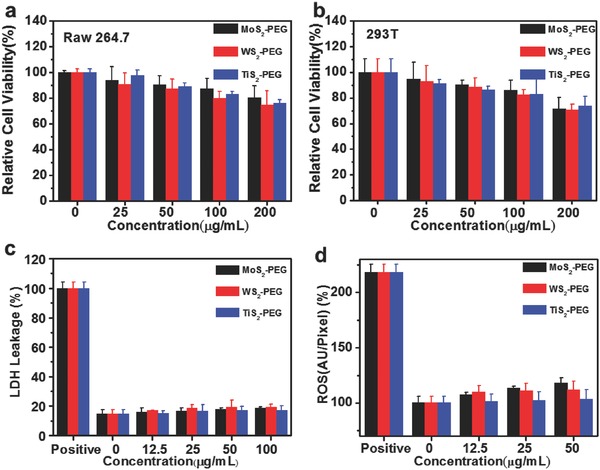
Cytotoxicity of PEGylated MS2 (M = Mo, W, Ti). a,b) Relative cell viability of Raw 264.7 cell line (a) and 293T cell line (b) after incubation with PEGylated MoS2, WS2, and TiS2 at different MS2 weight concentrations for 24 h. c,d) Relative LDH release level (c) and relative ROS values (d) of 4T1 cell line after incubation with PEGylated MoS2, WS2, and TiS2 nanosheets at different concentrations for 24 h, respectively.
2.3. In Vivo Biodistribution and Clearance Behaviors of PEGylated TMDCs
The biodistribution and clearance behaviors of nanomaterials are highly important for their potential use in biomedicine. However, to our best knowledge, systematic studies to investigate the long‐term in vivo behaviors of various TMDCs in parallel are still missing to date. In this work, healthy Balb/c mice were i.v. injected with PEGylated MoS2, WS2, and TiS2 (10 mg kg−1, in terms of TMDC weight concentrations). Their major organs including heart (H), liver (L), spleen (Sp), lung (Lu), kidney (K), stomach (St), intestine (I), skin (Sk), muscle (M), and bone (B) were collected at different time points post injection and then split into two halves, one for biodistribution study and the other for histology examination. For biodistribution measurement, the organs were weighted and digested by aqua regia. The contents of Mo, W, and Ti were measured by inductively coupled plasma‐atomic emission spectrometry (ICP‐AES) (Figure 3 a–c). It was found that all three types of PEGylated TMDCs accumulated mostly in RES organs such as liver and spleen at 1 d post injection (p.i), as the results of phagocytose by the Kupffer cells and spleen macrophages in these two organs. At later time points, however, we found that the metabolic rate of MoS2‐PEG was much faster than that of WS2‐PEG and TiS2‐PEG. After 30 d, the detected Mo levels decreased sharply to 0.54 ± 0.069 % ID g−1 in the liver (from 67.74 ±10.26% ID g−1 at day 1) and 0.017 ± 0.015% ID g−1 in the spleen (from 77.70 ±14.91% ID g−1 at day 1), with most of Mo excreted from the body (Figure 3a). Different from MoS2‐PEG, the other two types of TMDC nanosheets showed much slower excretion, with rather high levels of W and Ti levels detected in the liver and spleen after 30 d (Figure 3b,c). Figure 3d showed the Mo, W, and Ti levels in the liver at various time points. It was found that MoS2‐PEG showed remarkably faster excretion from this organ compared to the other two types of PEGylated TMDCs. Unexpectedly, the W content in the liver increased slightly over time in mice injected with WS2‐PEG, likely owing to the gradual translocation of WS2 into liver from spleen, in which the W content significantly dropped, as well as the rather slow excretion of WS2 from the liver.
Figure 3.
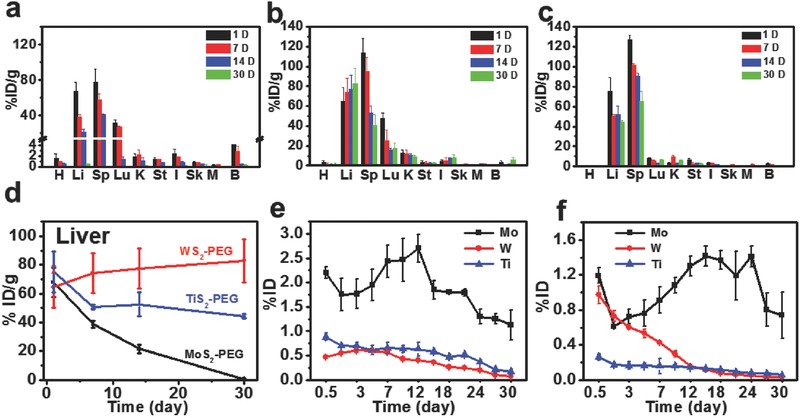
In vivo biodistribution and excretion of PEGylated MS2 (M = Mo, W, Ti). a–c) Biodistribution of MoS2‐PEG (a), WS2‐PEG (b), and TiS2‐PEG (c) in different organs after i.v injection (H: heart; L: liver; Sp: spleen; Lu: lung; K: kidney; St: stomach; I: intestine: Sk: skin; M: muscle; and B: bone). d) The clearance effect of liver after i.v injection of PEGylated MoS2, WS2, and TiS2 at different time points. e,f) Urinary excretion (e) and fecal excretion (f) of PEGylated MoS2, WS2, and TiS2 at different time points. Error bars in the above data were based on standard deviations of four mice per group.
In order to further investigate the clearance pathway, Balb/c mice after i.v injection with PEGylated TMDCs were housed in metabolic cages to collect their urine and feces, which were then digested by aqua regia to measure metal ion contents using ICP‐AES. Interestingly, high concentrations of Mo were detected in both urine and feces from MoS2‐PEG injected mice, while quite low levels of W and Ti were found in the urine and feces of mice injected with the other two types of PEGylated TMDCs (Figure 3e,f). Those results further confirmed that MoS2‐PEG, unlike the other two types of TMDCs, could be excreted effectively via both renal and fecal pathways.
A serial of experiments were next carried out to find out the mechanism of different metabolism behaviors for these three TMDCs. Since the phosphate buffer saline (PBS) is the most frequently used physiological buffer, we have chosen PBS buffer for the in vitro degradation experiments. PEGylated MoS2, WS2, and TiS2 were dissolved in PBS at room temperature for three months. Compared to WS2‐PEG which only showed slightly decreased UV–vis‐NIR absorbance after storage for three months, the optical absorbance of both MoS2‐PEG and TiS2‐PEG samples decreased remarkably (Figure 4 a–c). Notably, while a transparent colorless solution was left for MoS2‐PEG after incubation for three months, white precipitate was observed in the TiS2‐PEG sample (inset of Figure 4a–c). We then used X‐ray photoelectron spectroscopy (XPS) to analyze different TMDC samples dissolved in PBS for three month. It could be found that most of Mo element in MoS2 nanosheets was oxidized to the high valence state (MoVI) (Figure 4d), suggesting the oxidization of MoIVS2 with dark brown color into colorless water‐soluble MoVI‐oxide species (e.g. MoO4 2−). Different from MoS2, only a part of high valence state of W (WVI) was observed for the WS2‐PEG sample after three month storage in PBS (Figure 4e), suggesting the formation of WIVS2/WVIO3 compounds after such incomplete oxidation. Such a difference between MoS2‐PEG and WS2‐PEG could probably be due to the better chemical stability of WIV and stronger chemical band of W‐S in WS2 compared to the counterparts in MoS2. 39 As for the TiS2‐PEG sample, the insoluble white precipitate seen in the bottom of Ependor tube was found to be TiO2 based on both XPS (Figure 4f) and XRD data (Figure S8, Supporting Information). TEM images of these three samples also showed that while no large nanoparticles were found in the degradation product of MoS2‐PEG, lots of aggregates were formed for another two samples (WS2‐PEG and TiS2‐PEG, Figure 4g–i).
Figure 4.
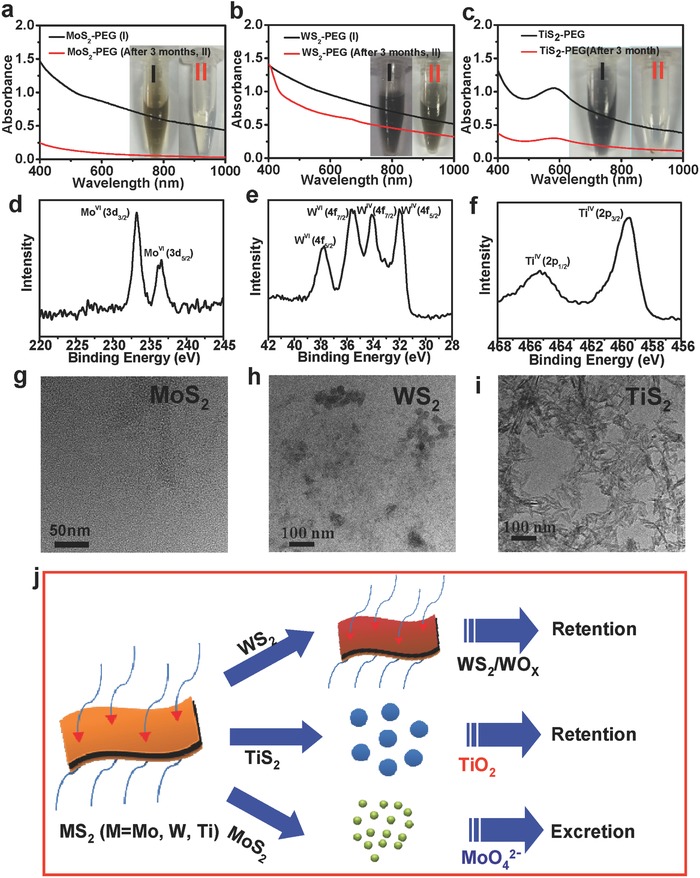
Mechanism of the clearance of the MS2‐PEG nanosheets (M = Mo, W, and Ti). a–c) UV–vis‐NIR spectra of MS2‐PEG (I) before and after three months (II) standing in PBS at the concentration of 0.02 mg mL−1, (a) MoS2‐PEG, (b) WS2‐PEG, and (c) TiS2‐PEG. Inset: Photos of the MS2‐PEG (M = Mo, W, and Ti) samples before (I) and after three months (II) standing in PBS solution. d–f) XPS spectra of the MoVI+ (d), WVI+ and WIV+ after oxidation (e), and TiIV of TiO2 nanoparticles from TiS2‐PEG after three months standing in PBS (f). g–i) TEM images of the PEGylated MoS2 (g), WS2 (h), and TiS2 (i) nanosheets after three months standing. j) A scheme showing the different pathways of the clearance of MS2‐PEG nanosheets (M = Mo, W, and Ti).
Based on the above observations, we conclude that the different in vivo excretion behaviors of three types of TMDCs should be due to their distinctive chemical properties (Figure 4j). WS2 shows relatively high stability in the physiological environment, and can hardly be degraded. Therefore WS2‐PEG after i.v. injection would retain in RES organs for a long time without rapid excretion. TiS2 is not stable and could be gradually oxidized into water‐insoluble TiO2 aggregates, which however also could not be easily excreted from the mouse body. In marked contrast, MoS2 within the physiological environment could be oxidized and transformed into water‐soluble MoVI‐oxide species (e.g., MoO4 2−), which are then readily excreted from the mouse body via both renal and fecal pathways.
2.4. In Vivo Toxicology Study of PEGylated MoS2, WS2, and TiS2
At last, we carefully looked into whether PEGylated TMDCs would exert any toxic effect to mice, by both hematology assay and histology examination. For the same female Balb/c mice used for biodistribution studies, their blood was collected at 1, 7, 30, 60 d post i.v injection of MS2‐PEG (M = Mo, W, and Ti). Various serum biochemical parameters including alkaline phosphatase (ALP), alanine aminotransferase (ALT), aspartate aminotransferase (AST), and urea nitrogen (BUN) were measured (Figure 5 a–d). After 1 d treatment with MoS2‐PEG, all the serum biochemical parameters were close to control group except AST, which increased at 1 d p.i. but dropped 7 d later. The biochemical parameters for the WS2‐PEG treated group showed no obvious difference compared with untreated mice. As for the TiS2‐PEG treatment group, the ALT and ALP activities in plasma were increased compared to the control group. However, all these parameters decreased into the control levels later, demonstrating no irreversible injury to the liver of mice induced by TiS2‐PEG. Notably, all those variations were still within the reference ranges for healthy Balb/c mice.
Figure 5.
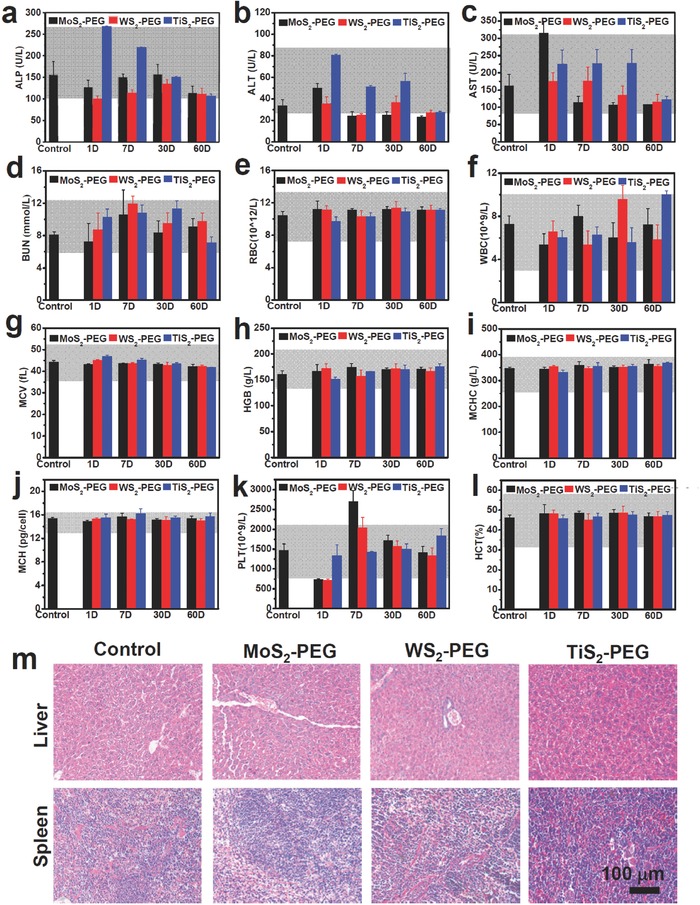
Blood biochemistry and hematology data of Balb/c mice treated with MS2‐PEG nanosheets (M = Mo, W, and Ti). The data were collected at different time point after i.v injection, error bars were based on standard deviations of four mice per group. a) Alkaline phosphatase (ALP), b) alanine aminotransferase (ALT), c) aspartate aminotransferase (AST), and d) urea nitrogen (BUN) levels in the blood at different time point. e) Red blood cells (RBC), f) white blood cells (WBC), g) mean corpuscular volume (MCV), h) hemoglobin (HGB), i) mean corpuscular hemoglobin concentration (MCHC), j) mean corpuscular hemoglobin (MCH), k) platelet (PLT), and l) hematocrit (HCT) levels in the blood at different time point. Gray areas in the figures show the normal reference ranges of hematology data of male Balb/c mice. m) H&E staining images of liver and spleen from mice treated with MS2‐PEG nanosheets (M = Mo, W, and Ti). The organs were collected from the mice sacrificed at 30 d post injection. The control group was obtained from the untreated mice.
For the blood routine examination, red blood cells (RBC), white blood cells (WBC), hemoglobin (HGB), mean corpuscular volume (MCV), mean corpuscular hemoglobin concentration (MCHC), hematocrit (HCT), mean corpuscular hemoglobin (MCH), and platelet (PLT) counts were measured (Figure 5e–l). All the parameters tested in the treated groups during the monitoring period were within the reference normal ranges,40 except some variations in platelet counts. The decrease in the platelet count 1 d after treatment may be due to the absorption of TMDCs nanosheets on blood cells, similar to the behavior of some other nanomaterials previously reported.41, 42 Later on, the platelet count increased rapidly to the normal range.
While the first halves of organs were used for biodistribution studies, the other halves of major organs from mice injected with different PEGylated TMDCs were sliced for hematoxylin and eosin (H&E) staining and histological examination. No obvious sign of abnormality, such as inflammation, was noticed in all examined major organs, including liver and spleen with domination accumulation of those nanomaterials (Figure 5m). Our results suggest that all of the three PEGylated TMDCs nanosheets have no significant toxicity to mice within 30 d. In particularly, considering the almost complete clearance of MoS2‐PEG within 30 d, it is reasonably to predict that MoS2‐PEG would not cause further long‐term toxicity to the treated animals in a reasonable dose range.
3. Conclusions
In summary, we have systemically studied the in vivo biodistribution, excretion, and toxicology profiles of three respective types of TMDCs with surface PEGylation. The biodistribution results indicated abundant accumulation of those nanosheets in RES organs after i.v injection. Notably, after 30 d, MoS2‐PEG could be excreted almost completely, while large amounts of injected W or Ti were still retained in the mouse RES organs for those injected with WS2‐PEG or TiS2‐PEG, respectively. Further degradation experiments uncovered that MoS2 could be oxidized into water‐soluble MoVI‐oxide species (e.g., MoO4 2−) to allow its rapid clearance from the body. In contrast, WS2 with much higher chemical stability was more difficult to be oxidized and thus showed much longer in vivo retention, while TiS2 could be oxidized to into water‐insoluble TiO2 aggregates that were also hard to be excreted. Moreover, further histological and blood analysis showed no obvious long‐term toxicity of these three types of TMDC nanosheets at our tested dose. This work is the first time to carefully compare the in vivo biodistribution, degradation, and excretion behaviors of different TMDCs side‐by‐side. Our results suggest that MoS2, among various TMDC nanomaterials, may be particularly promising for further biomedical applications owning to its biodegradability and relatively rapid excretion.
4. Experiment Section
Materials: All the chemical reagents, unless specified, were purchased and used without further purification. Tungsten (VI) chloride (WCl6), molybdenum (V) chloride (MoCl5), titanium tetrachloride (TiCl4), oleylamine (OM), 1‐octadecene (ODE), and NMP were purchased from Sigma‐Aldrich. Sulfur powder (S) was obtained from Sinopharm Chemical Reagent Co., Ltd. (China). Lipoic acid was purchased from Sigma‐Aldrich and mPEG‐NH2 (MW = 5K) were obtained from Biomatrik Co., Ltd (Jiaxing, China). Deionized water used in our experiments was obtained by using a Milli‐Q water system.
Synthesis of MoS2, WS2, and TiS2 Nanosheets Synthesis: First, MoS2, WS2, and TiS2 nanoflakes were synthesized according the previous report with slight modification.19, 36 1 mmol MoCl5/WCl6 TiCl4/was dissolved in 15 mL oleylamine (OM) and 10 mL 1‐octadecene (ODE) in a three‐necked flask under magnetic stirring, then heated to 150 °C with the protection of nitrogen atmosphere and kept for 20 min to remove the low‐boiling‐point impurities. Then the temperature was increased to 300 °C slowly. 2.5 mmol sulfur powder dissolved in 4 mL OM was injected to the reaction solution rapidly. The solution temperature was kept at 300 °C for another 30 min and then cooled down to the room temperature. The product was dissolved in cyclohexane and washed with ethyl alcohol/cyclohexane (V:V = 1:1) for three times. After that, as‐synthesized MoS2, WS2, and TiS2 nanoflakes were dissolved in NMP solution, and sonicated for 5 h using a water‐bath ultra‐sonicator. The nanosheets were precipitated by centrifugation with ethyl alcohol and then dissolved in DI water.
Functionalization of MoS2, WS2, and TiS2 Nanosheets: LA‐PEG was synthesized following a literature procedure.43 20 mg LA‐PEG was added to 10 mL aqueous solution of MoS2, WS2, or TiS2 (1 mg mL−1) under magnetic stirring at room temperature overnight. Then the solution was centrifuged 4000 rpm for 20 min by Amicon filters (Millipore) (MWCO = 10 kDa) and washed with DI water to remove excess polymer, obtaining PEGylated MoS2, WS2, and TiS2.
Characterization: The TEM images were taken by a FEI Tecnai F20 TEM. XRD measurement was performed by a PANalytical X‐ray diffractometer at Cuka radiation (λ = 0.15406 nm). UV–vis‐NIR spectra of PEGylated MoS2, WS2, and TiS2 were acquired by a PerkinElmer Lambda 750 UV–vis‐NIR spectrophotometer. The sizes of PEGylated MoS2, WS2, and TiS2 were measured by dynamic light scattering (MALVERN ZEN3690). The absolute Mo/W/Ti contents as well as MS2 weight concentrations in different MS2‐PEG samples were measured by ICP‐AES (Vista Mpx 700‐ES).
In Vitro Cytotoxicity Assay: The mouse macrophage RAW 264.7 cells, murine breast cancer 4T1 cells, and human renal epithelial cell 293T were chosen to evaluate the cytotoxicity of PEGylated MoS2, WS2, and TiS2 nanosheets. Both cells were originally obtained from American Type Culture Collection (ATCC) and cultured at 37 °C within 5% CO2 in RPMI‐1640 cell medium supplemented with 10% fetal bovine serum (FBS). For the MTT assay, the cells were seeded in 96‐well plates and incubated with PEGylated MoS2, WS2, and TiS2 at different concentrations. 24 h later, the cells were washed with fresh medium and preceded to the standard MTT assay or LDH assay following vendors' protocols. For ROS detection, cells after treatment with PEGylated MoS2, WS2, and TiS2 for 24 h were incubated with dihydroethidine (DHE) probe for 40 min. Then cells were collected, washed with PBS twice, and preceded to flow cytometry analysis (FACSCalibur, BD).
Biodistribution Study: Female Balb/c mice (20 g ± 2 g) were bought from Nanjing Peng Sheng Biological Technology Co. Ltd and used under protocols approved by Soochow University Laboratory Animal Center. Balb/c mice were i.v injected with PEGylated MoS2, WS2, and TiS2 (200 μL per mouse, 1 mg mL−1, dosage = 10 mg kg−1, in terms of MS2 weight concentrations). Control group were i.v injected with 200 μl PBS. Four mice were used per group. The mice were sacrificed with major organs including heart, liver, spleen, lung, kidney, stomach, intestine, skin, muscle, bone collected at day 1, day 7, day 14, day 30, and day 60 p.i. Those organs were added with 10 mL aqua regia (HCl:HNO3:HClO4 = 3:1:1) and heated to 200 °C for 2 h. After being cooled down to room temperature, each sample was diluted to 10 mL by DI water and passed through a 0.22 μm filter to remove any undigested tissue. The amount of Mo, W, and Ti were measured by ICP‐AES (Vista Mpx 700‐ES).
Excretion Study: Female Balb/c mice were i.v injected with PEGylated MoS2, WS2, and TiS2 (dosage = 10 mg kg−1) with four mice per group. Each mouse was placed in metabolism cage. Their urine and feces were collected at regular time points. The metabolism cages were washed after each round of collection. The collected urine and feces were digested with aqua regia for ICP‐AES measurement of Mo, W, and Ti contents (Vista Mpx 700‐ES).
Toxicology Study: Female Balb/c mice were i.v injected with PEGylated MoS2, WS2, and TiS2 (dosage = 10 mg kg−1, in terms of MS2 weight concentrations) with four mice per group. At 1, 7, and 30 d p.i., blood from those mice were drawn through their orbital venous plexus. For the blood chemistry analysis, alkaline phosphatase (ALP), alanine aminotransferase (ALT), aspartate aminotransferase (AST), and urea nitrogen (BUN) were measured. For the complete blood panel test, red blood cells, white blood cells, hemoglobin, mean corpuscular volume, mean corpuscular hemoglobin concentration, mean corpuscular hemoglobin, hematocrit, and platelet count were measured. All the assays were tested in Shanghai Research Center for Biomodel Organism. For histology study, heart, liver, spleen, lung, kidney collected from those mice were fixed in 10% neutral buffered formalin, processed routinely into paraffin, sectioned into 8 μm thickness slices, and then stained with hematoxylin & eosin (H&E). The slices were observed with a digital microscope (Leica QWin).
Supporting information
As a service to our authors and readers, this journal provides supporting information supplied by the authors. Such materials are peer reviewed and may be re‐organized for online delivery, but are not copy‐edited or typeset. Technical support issues arising from supporting information (other than missing files) should be addressed to the authors.
Supplementary
Acknowledgements
This work was supported by the National Natural Science Foundation of China (51302180 and 51572180), the National “973” Program of China (2012CB932601), a Project Funded by the Priority Academic Program Development of Jiangsu Higher Education Institutions, and the Post‐doctoral science foundation of China (2013M531400 and 2014T70542). L.C. also acknowledges the Collaborative Innovation Center of Suzhou Nano Science and Technology (Nano‐CIC) for the fellowship of “Young Scientists Overseas Exchanges and Cooperation Program”.
Professor Z. Liu's email address was updated after online publication of this manuscript, on January 20, 2017.
Hao J., Song G., Liu T., Yi X., Yang K., Cheng L., Liu Z., Adv. Sci. 2017, 4, 1600160.
Contributor Information
Liang Cheng, Email: lcheng2@suda.edu.cn.
Zhuang Liu, Email: zliu@suda.edu.cn.
References
- 1. Radisavljevic B., Radenovic A., Brivio J., Giacometti V., Kis A., Nat. Nanotechnol. 2011, 6, 147. [DOI] [PubMed] [Google Scholar]
- 2. Guo Y., Xu K., Wu C., Zhao J., Xie Y., Chem. Soc. Rev. 2015, 44, 637. [DOI] [PubMed] [Google Scholar]
- 3. Yang K., Feng L., Shi X., Liu Z., Chem. Soc. Rev. 2013, 42, 530. [DOI] [PubMed] [Google Scholar]
- 4. Chhowalla M., Shin H. S., Eda G., Li L.‐J., Loh K. P., Zhang H., Nat. Chem. 2013, 5, 263. [DOI] [PubMed] [Google Scholar]
- 5. Xie J., Lee S., Chen X., Adv. Drug Delivery Rev. 2010, 62, 1064. [DOI] [PMC free article] [PubMed] [Google Scholar]
- 6. Liu Z., Tabakman S., Welsher K., Dai H., Nano Res. 2009, 2, 85. [DOI] [PMC free article] [PubMed] [Google Scholar]
- 7. Kostarelos K., Lacerda L., Pastorin G., Wu W., Sebastien W., Luangsivilay J., Godefroy S., Pantarotto D., Briand J.‐P., Muller S., Prato M., Bianco A., Nat. Nanotechonol. 2007, 2, 108. [DOI] [PubMed] [Google Scholar]
- 8. Song G., Wang Q., Wang Y., Lv G., Li C., Zou R., Chen Z., Qin Z., Huo K., Hu R., Hu J., Adv. Funct. Mater. 2013, 23, 4281. [Google Scholar]
- 9. Wang Q. H., Zadeh K.‐K., Kis A., Coleman J. N., Strano M. S., Nat. Nanotechnol. 2012, 7, 699. [DOI] [PubMed] [Google Scholar]
- 10. Ji Q., Zhang Y., Zhang Y., Liu Z., Chem. Soc. Rev. 2015, 44, 2587. [DOI] [PubMed] [Google Scholar]
- 11. Lv R., Terrones H., Elías A. L., Perea‐López N., Gutiérrez H. R., Cruz‐Silva E., Rajukumar L. P., Dresselhaus M. S., Terrones M., Nano Today 2015, 10, 559. [Google Scholar]
- 12. Cheng L., Wang C., Feng L., Yang K., Liu Z., Chem. Rev. 2014, 114, 10869. [DOI] [PubMed] [Google Scholar]
- 13. Zhang L., Liu C., Wong A., Resasco J., Yang P., Nano Res. 2015, 8, 281. [Google Scholar]
- 14. Zhu C., Zeng Z., Li H., Li F., Fan C. H., Zhang J., Am. Chem. Soc. 2013, 135, 5998. [DOI] [PubMed] [Google Scholar]
- 15. Kalantar‐zadeh K., Ou J. Z., Daeneke T., Strano M. S., Pumera M., Gras S. L., Adv. Funct. Mater. 2015, 25, 5086. [Google Scholar]
- 16. Cheng L., Liu J., Gu X., Gong H., Shi X., Liu T., Wang C., Wang X., Liu G., Xing H., Adv. Mater. 2014, 26, 1886. [DOI] [PubMed] [Google Scholar]
- 17. Qian X., Shen S., Liu T., Cheng L., Liu Z., Nanoscale 2015, 7, 6380. [DOI] [PubMed] [Google Scholar]
- 18. Chou S. S., Kaehr B., Kim J., Foley B. M., De M., Hopkins P. E., Huang J., Brinker C. J., Dravid V. P., Angew. Chem. Int. Ed. 2013, 125, 4254. [DOI] [PMC free article] [PubMed] [Google Scholar]
- 19. Cheng L., Yuan C., Shen S., Yi X., Gong H., Yang K., Liu Z., ACS Nano 2015, 9, 11090. [DOI] [PubMed] [Google Scholar]
- 20. Liu T., Wang C., Gu X., Gong H., Cheng L., Shi X., Feng L., Sun B., Liu Z., Adv. Mater. 2014, 26, 3433. [DOI] [PubMed] [Google Scholar]
- 21. Yin W., Yan L., Yu J., Tian G., Zhou L., Zheng X., Zhang X., Yong Y., Li J., Gu Z., ACS Nano 2014, 8, 6922. [DOI] [PubMed] [Google Scholar]
- 22. Liu T., Shi S., Liang C., Shen S., Cheng L., Wang C., Song X., Goel S., Barnhart T. E., Cai W., ACS Nano 2015, 9, 950. [DOI] [PMC free article] [PubMed] [Google Scholar]
- 23. Yang G., Gong H., Liu T., Sun X., Cheng L., Liu Z., Biomaterials 2015, 60, 62. [DOI] [PubMed] [Google Scholar]
- 24. Wang S., Li X., Chen Y., Cai X., Yao H., Gao W., Zheng Y., An X., Shi J., Chen H., Adv. Mater. 2015, 27, 2775. [DOI] [PubMed] [Google Scholar]
- 25. Yu J., Yin W., Zheng X., Tian G., Zhang X., Bao T., Dong X., Wang Z., Gu Z., Ma X., Theranostics 2015, 5, 931. [DOI] [PMC free article] [PubMed] [Google Scholar]
- 26. Wu W., Wang L., Li Y., Zhang F., Lin L., Niu S., Chenet D., Zhang X., Hao Y., Heinz T. F., Hone J., Wang Z. L., Nature 2014, 514, 470. [DOI] [PubMed] [Google Scholar]
- 27. Chng E. L. K., Sofer Z., Pumera M., Nanoscale 2014, 6, 14412. [DOI] [PubMed] [Google Scholar]
- 28. Chen Y., Tan C., Zhang H., Wang L., Chem. Soc. Rev. 2015, 44, 2681. [DOI] [PubMed] [Google Scholar]
- 29. Yong Y., Cheng X., Bao T., Zu M., Yan L., Yin W., Ge C., Wang D., Gu Z., Zhao Y., ACS Nano 2015, 9, 12451. [DOI] [PubMed] [Google Scholar]
- 30. Wang S., Li K., Chen Y., Chen H., Ma M., Feng J., Zhao Q., Shi J., Biomaterials 2015, 39, 206. [DOI] [PubMed] [Google Scholar]
- 31. Gu W., Yan Y., Cao X., Zhang C., Ding C., Xian Y., J. Mater. Chem. B 2016, 4, 27. [DOI] [PubMed] [Google Scholar]
- 32. Teo W. Z., Chng E. L. K., Sofer Z., Pumera M., Chem.‐ Eur. J. 2014, 20, 9627. [DOI] [PubMed] [Google Scholar]
- 33. Ju H., Jia L., Ding L., Tian J., Bao L., Hu Y., Yu J.‐S., Nanoscale 2015, 7, 15953. [DOI] [PubMed] [Google Scholar]
- 34. Liu T., Wang C., Cui W., Gong H., Liang C., Shi X., Li Z., Sun B., Liu Z., Nanoscale 2015, 7, 9945. [DOI] [PubMed] [Google Scholar]
- 35. Xu S., Li D., Wu P., Adv. Funct. Mater. 2015, 25, 1127. [Google Scholar]
- 36. Cheng L., Huang W., Gong Q., Liu C., Liu Z., Li Y., Dai H., Angew. Chem. Int. Ed. 2014, 53, 7860. [DOI] [PubMed] [Google Scholar]
- 37. Strober W., Current Protocols in Immunology, John Wiley & Sons, Inc, Hoboken, NJ, USA: 2001, p. 21. [Google Scholar]
- 38. Apel K., Hirt H., Annu. Rev. Plant Biol. 2004, 55, 373. [DOI] [PubMed] [Google Scholar]
- 39. Hille R., Trends Biochem. Sci. 2002, 27, 360. [DOI] [PubMed] [Google Scholar]
- 40.Balb‐C mouse data sheet, http://www.criver.com/products‐services/basic‐research/find‐a‐model/balb‐c‐mouse, accessed: March 2012.
- 41. Dobrovolskaia M. A., Aggarwal P., Hall J. B., McNeil S. E., Mol. Pharm. 2008, 5, 487. [DOI] [PMC free article] [PubMed] [Google Scholar]
- 42. Zhang X.‐D., Chen J., Min Y., Park G. B., Shen X., Song S.‐S., Sun Y.‐M., Wang H., Long W., Xie J., Gao K., Zhang L., Fan S., Fan F., Jeong U., Adv. Funct. Mater. 2014, 24, 1718. [Google Scholar]
- 43. Cheng L., Yang K., Li Y., Chen J., Wang C., Shao M., Lee S.‐T., Liu Z., Angew. Chem. Int. Ed. 2011, 50, 7385. [DOI] [PubMed] [Google Scholar]
Associated Data
This section collects any data citations, data availability statements, or supplementary materials included in this article.
Supplementary Materials
As a service to our authors and readers, this journal provides supporting information supplied by the authors. Such materials are peer reviewed and may be re‐organized for online delivery, but are not copy‐edited or typeset. Technical support issues arising from supporting information (other than missing files) should be addressed to the authors.
Supplementary