

Abstract
The binding of sequence-specific RNA-interacting proteins, such as the bacteriophage MS2 or PP7 coat proteins, to their corresponding target sequences has been extremely useful and widely used to visualize single mRNAs in vivo. However, introduction of MS2 stem–loops into yeast mRNAs has recently been shown to lead to the accumulation of RNA fragments, suggesting that the loops impair mRNA decay. This result was questioned, because fragment occurrence was mainly assessed using ensemble methods, and their cellular localization and its implications had not been addressed on a single transcript level. Here, we demonstrate that the introduction of either MS2 stem–loops (MS2SL) or PP7 stem–loops (PP7SL) can affect the processing and subcellular localization of mRNA. We use single-molecule fluorescence in situ hybridization (smFISH) to determine the localization of three independent mRNAs tagged with the stem–loop labeling systems in glucose-rich and glucose starvation conditions. Transcripts containing MS2SL or PP7SL display aberrant localization in both the nucleus and the cytoplasm. These defects are most prominent in glucose starvation conditions, with nuclear mRNA processing being altered and stem–loop fragments abnormally enriching in processing bodies (PBs). The mislocalization of SL-containing RNAs is independent of the presence of the MS2 or PP7 coat protein (MCP or PCP).
Keywords: PP7–PCP system, MS2–MCP system, single-molecule fluorescence in situ hybridization, mRNA processing, P bodies, mRNA decay
INTRODUCTION
The introduction of stem–loop labeling systems has provided a very powerful tool to study transcript localization and processing at the single RNA level in single cells (Bertrand et al. 1998; Beach et al. 1999; Brodsky and Silver 2000; Takizawa and Vale 2000; Gu et al. 2004; Teixeira et al. 2005; Andoh et al. 2006; Haim et al. 2007; Kilchert and Spang 2011; Larson et al. 2011; Hocine et al. 2013; Zid and O'Shea 2014; Smith et al. 2015). Recently, publications from the Parker and Gerst laboratories raised important points about the degradability of mRNAs labeled with MS2 stem–loops at their 3′ end, showing the occurrence of stable 3′-end fragments in yeast with various methods such as Northern blotting, qPCR, and RNA sequencing of mRNA pulldowns (RaPID) (Garcia and Parker 2015, 2016; Haimovich et al. 2016). Because the authors came to different conclusions about the extent to which this affects the interpretation of previously published results, various important control experiments were suggested to determine the extent and the effects of potential 3′-end fragment formation. One suggested control is smFISH, which reveals cellular mRNA localization, and more specifically allows a comparison between different regions within an mRNA, for example, between transcript-specific and stem–loop-specific sequences.
Here, we use this method to investigate the effects on cellular localization and 3′-end fragment formation of three different mRNAs that are tagged with either MS2 or PP7 stem–loops. We provide several lines of evidence that the insertion of either MS2 or PP7 sites into different mRNAs affect their nuclear and/or cytoplasmic processing. First, using smFISH we find that in glucose-depleted conditions untagged mRNAs are distributed throughout the cell, whereas 24xMS2SL- or 24xPP7SL-tagged mRNAs accumulate in larger foci that often colocalize with the P-Body marker Dcp2. Within these foci, SL-specific smFISH probes suggest a specific enrichment of 3′-end SL-containing fragments over the body of the mRNAs. Second, in glucose-rich conditions, only minor differences in cytoplasmic RNA localization between tagged and untagged transcripts can be observed by smFISH. Third, the presence of SLs can also affect nuclear mRNA processing and specific mRNAs displayed an enrichment in nuclear foci presumably at their site of transcription. Overall, these observations argue that SL-marked transcripts can be affected in their cellular processing and localization, which needs to be considered when using SL aptamers for visualizing the localization of RNA.
RESULTS
PGK1 mRNA tagging with MS2 stem–loops alters cellular localization in glucose starvation
Various reporter mRNAs were previously used to study transcript localization in single cells, including the abundant PGK1 mRNA (coding for the essential 3-phosphoglycerate kinase; with an estimated 200 transcripts per cell) (Brodsky and Silver 2000; Teixeira et al. 2005; Siwiak and Zielenkiewicz 2010). Stem–loop-labeled PGK1 mRNA has been reported to enrich in cytoplasmic granules called processing bodies (PBs) in glucose-starvation conditions (Brengues et al. 2005; Teixeira et al. 2005; Simpson et al. 2014). However, MS2 stem–loop-labeled PGK1 mRNA was recently shown to accumulate 3′-end fragments containing the stem–loops (Garcia and Parker 2015, 2016). We therefore wanted to investigate full-length mRNA localization and 3′-end fragment formation on a single transcript level using smFISH (Fig. 1A). For this, PGK1 was labeled at its endogenous locus with 24xMS2SL integrated after the PGK1 stop codon in strains expressing the PB marker Dcp2 tagged with GFP (for a complete strain list, see Supplemental Table S1). To induce PB formation, cells were shifted to culturing media containing no glucose for 30 min, and mRNA localization was compared to glucose-rich culturing conditions.
FIGURE 1.

(A) Schematic representation of single-molecule fluorescence in situ hybridization (smFISH) to visualize mRNAs. To probe for the body of the mRNA, 48 sequence-specific fluorescently labeled DNA oligos (red) were used, which bind along the length of the transcript. Similarly, to probe for the repetitive stem–loop sequences, five sequence-specific fluorescently labeled DNA oligos were used (see Supplemental Table S3 for sequences). (B) Labeling of PGK1 mRNA at the 3′ end with 24xMS2SL (Addgene plasmid 45162) alters its cellular localization, with 3′-end fragments of MS2SL enriching in PBs. Strains expressing DCP2-GFP and either PGK1 or PGK1-24xMS2SL were grown at 25°C to OD600 0.6–0.8 in synthetic complete media containing 2% glucose, then shifted to synthetic complete media without glucose for 30 min, and fixed for 15 min with 4% paraformaldehyde. Samples were processed for single-molecule fluorescence in situ hybridization (smFISH) as described in Heinrich et al. (2013), with the exception of spheroplasting yeast cells for 20 min using 1% 20T zymolyase. Mixtures of DNA probes coupled to CAL Fluor Red 590 (Stellaris Biosearch Technologies, synthesized by BioCat) were used for smFISH, targeting either the PGK1 (i) or MS2SL (ii) moieties. Microscopy was performed using an inverted epi-fluoresence microscope (Nikon Ti) equipped with a Spectra X LED light source and a Hamamatsu Flash 4.0 sCMOS camera using a 100× Plan-Apo objective NA 1.4 and NIS Elements software. Images were processed using FIJI software. Depicted is a maximum projection of the central 10 planes of a 3D image. For images depicting glucose-rich conditions, white boxes mark an exemplary image region where the green channel (Dcp2-GFP) is differentially scaled to enhance signal intensity. White arrows show example cells with large mRNA foci colocalizing with the nucleus. Scale bar, 5 µm. (C) Quantification of colocalization of PBs with mRNA in glucose starvation conditions shown in Figure 1B. Percentage depicts number of PBs colocalizing with mRNAs compared to total number of PBs. n = 3 biological replicates with each >800 counted PBs; bars depict SD. Quantification of colocalization was performed on all planes of a 3D stack image using the Colocalization Threshold tool in Fiji. (D) Quantification of colocalization of nuclear DNA with mRNA foci in glucose-rich and glucose starvation conditions shown in Figure 1B. Percentage depicts nuclear DNA (judged by DAPI signal) colocalizing with mRNAs compared to total number of nuclear DNA. n = 3 biological replicates with each >300 counted nuclei; bars depict SD. Quantification of colocalization was performed on all planes of a 3D stack image using the Colocalization Threshold tool in Fiji.
For smFISH we used probes that bind to the gene-specific moiety of the PGK1 transcript or probes that exclusively bind the MS2SL. In glucose-rich conditions, cells expressing PGK1-24xMS2SL accumulate small Dcp2-GFP foci that colocalize with mRNA (Fig. 1B, white boxes). This is in contrast to wild-type cells, which have a homogenous cellular Dcp2-GFP signal. This suggests that the presence of MS2 stem–loops affects Dcp2 localization, potentially because decay of the abundant PGK1 transcript is reduced. However, the defects are rather mild and would easily remain unnoticed, particularly when only the tagged transcript is analyzed, without comparing it to the untagged endogenous control.
When cells are shifted into media without glucose, the difference in cellular localization between untagged and tagged PGK1 transcripts becomes more apparent. Untagged PGK1 mRNAs remain dispersed in the cytoplasm, with only 7% of Dcp2-GFP PBs colocalizing with PGK1 mRNAs. However, when PGK1 mRNAs are tagged with 24xMS2SL, large cytoplasmic foci form that show increased colocalization with PBs (Fig. 1B, quantification in Fig. 1C). Interestingly, using gene-specific probes, ∼30% of PBs colocalize with PGK1-24xMS2SL mRNAs. In contrast, we detect almost 100% colocalization of PBs with PGK1-24xMS2SL mRNA using MS2SL-specific probes, suggesting that the majority of the SL-marked transcripts we observe in PBs are 3′-end fragments.
We then examined if the presence of the MS2 coat protein changes 3′-end fragment formation. The Parker group recently showed that 3′-end fragments are detected only when the coat protein is present in cells (Garcia and Parker 2015, 2016), while Haimovich et al. (2016) report 3′-end fragment occurrence even without coat protein expression in strains with stem–loop-labeled mRNAs. To test the effect of MCP on 3′-end fragment formation, we additionally expressed plasmid-encoded MCP in PGK1-24xMS2SL strains. (Fig. 1B,C). We could not observe any qualitative change in mRNA localization and 3′-end fragment occurrence upon MCP expression, suggesting that SL enrichment occurs independently of the presence of the coat protein. However, based on our smFISH data, we cannot exclude that there are quantitative differences in the abundance or type of 3′-end fragments.
In addition to cytoplasmic processing defects, which lead to aberrant mRNA localization, we also observe changes in nuclear mRNA processing when transcripts were marked with MS2SL. We observe strong mRNA enrichment at a single spot in the nucleus, as judged by the overlapping DAPI signal (Fig. 1B [arrows]; Supplemental Fig. 1A, quantification in Fig. 1D). Addition of MS2SL has a dual effect on PGK1 transcripts: It increases both the total number of mRNA foci-positive nuclei as well as the number of mRNAs per focus. For example, in glucose starvation conditions, 45% of cells expressing untagged PGK1 mRNA show an mRNA spot in the nucleus. In contrast, >85% (PGK1-specific probe) or 60% (MS2SL-specific probe) of cells expressing MS2SL-marked PGK1 mRNAs have mRNA foci-positive nuclei (Fig. 1D). In addition, quantification of maximum brightness at this nuclear focus reveals that the focus for untagged PGK1 displays an up to six times higher signal compared to a single transcript. However, for PGK1-24xMS2SL the signal can be up to 15 times brighter than an individual mRNA (Supplemental Fig. S1C).
Such nuclear foci have been observed before (Abruzzi et al. 2006) and presumably mark the site of transcription indicating altered transcript processing of 24xMS2SL-containing mRNAs in the nucleus.
We conclude that addition of 24xMS2SL to the PGK1 mRNA can affect its cellular localization and processing both in the nucleus and cytoplasm, albeit to different extents in different culturing conditions.
smFISH reveals nuclear and cytoplasmic mRNA processing defects for the PP7–PCP system
Next, we analyzed whether the PP7–PCP system, which is orthologous to MS2–MCP (Larson et al. 2011; Hocine et al. 2013; Urbanek et al. 2014), also results in cellular mRNA processing defects by performing smFISH experiments with PGK1-24xPP7SL. As observed for the MS2SLs also PP7SLs induce the formation of nuclear foci (Fig. 2A,C). The maximum brightness values for PGK1-24xPP7SL are comparable to the values measured for PGK1-24xMS2SL. The PP7SL nuclear foci are up to 15 times brighter than an individual mRNA, whereas the focus for untagged PGK1 displays an only up to six times higher signal compared to a single transcript (Supplemental Fig. S2A). Interestingly, PP7SL and MS2SL show differences in nuclear stem–loop processing. Nuclear enrichment for PP7SL-labeled transcripts can be seen predominantly with the 5′ probes but much less with the PP7SL-specific probes (<20% foci-positive nuclei) (Fig. 2C). In contrast, we can detect 60%–70% MS2SL foci-positive nuclei with MS2SL-specific probes (Fig. 1D), suggesting different nuclear processing effects of the two SL systems.
FIGURE 2.

(A) Tagging of PGK1 mRNA at 3′ end with 24xPP7SL alters its cellular localization and causes 3′-end fragments of PP7SL to enrich in PBs. smFISH, imaging and image processing was performed as in Figure 1B using strains expressing DCP2-GFP and either PGK1 or PGK1-24xPP7SL. Fluorescent DNA probes target either the PGK1 (i) or PP7SL (ii) moieties (Supplemental Table S3). White arrows show example cells with large mRNA foci colocalizing with the nucleus. Scale bar, 5 µm. (B) Quantification of colocalization of PBs with mRNA in glucose starvation conditions shown in Figure 2A. Percentage depicts number of PBs colocalizing with mRNAs compared to total number of PBs. n = 3 biological replicates with each >800 counted PBs; bars depict SD. Quantification of colocalization was performed on all planes of a 3D stack image using the Colocalization Threshold tool in Fiji. (C) Quantification of colocalization of nuclear DNA with mRNA foci in glucose-rich and glucose starvation conditions shown in Figure 2A. Percentage depicts nuclear DNA (judged by DAPI signal) colocalizing with mRNAs compared to total number of nuclear DNA. n = 3 biological replicates with each >300 counted nuclei; bars depict SD. Quantification of colocalization was performed on all planes of a 3D stack image using the Colocalization Threshold tool in Fiji. (D,E) Presence of stem–loops causes transcript fragmentation. Cells expressing DCP2-GFP and either PGK1-24xPP7SL or PGK1-24xMS2SL together with or without their respective coat proteins were grown at 25°C to OD600 0.6 to 0.8 in synthetic complete media containing 2% glucose, then shifted to synthetic complete media with or without glucose for 30 min and harvested for total RNA extraction using hot phenol. Ten micrograms of total RNA was separated on a 0.7% formaldehyde agarose gel and transferred to a nylon N+ membrane as described in Farnung et al. (2012). The stem–loops and the 18S RNA are visualized with radioactively end-labeled, sequence-specific oligos (see Supplemental Table S4 for sequences).
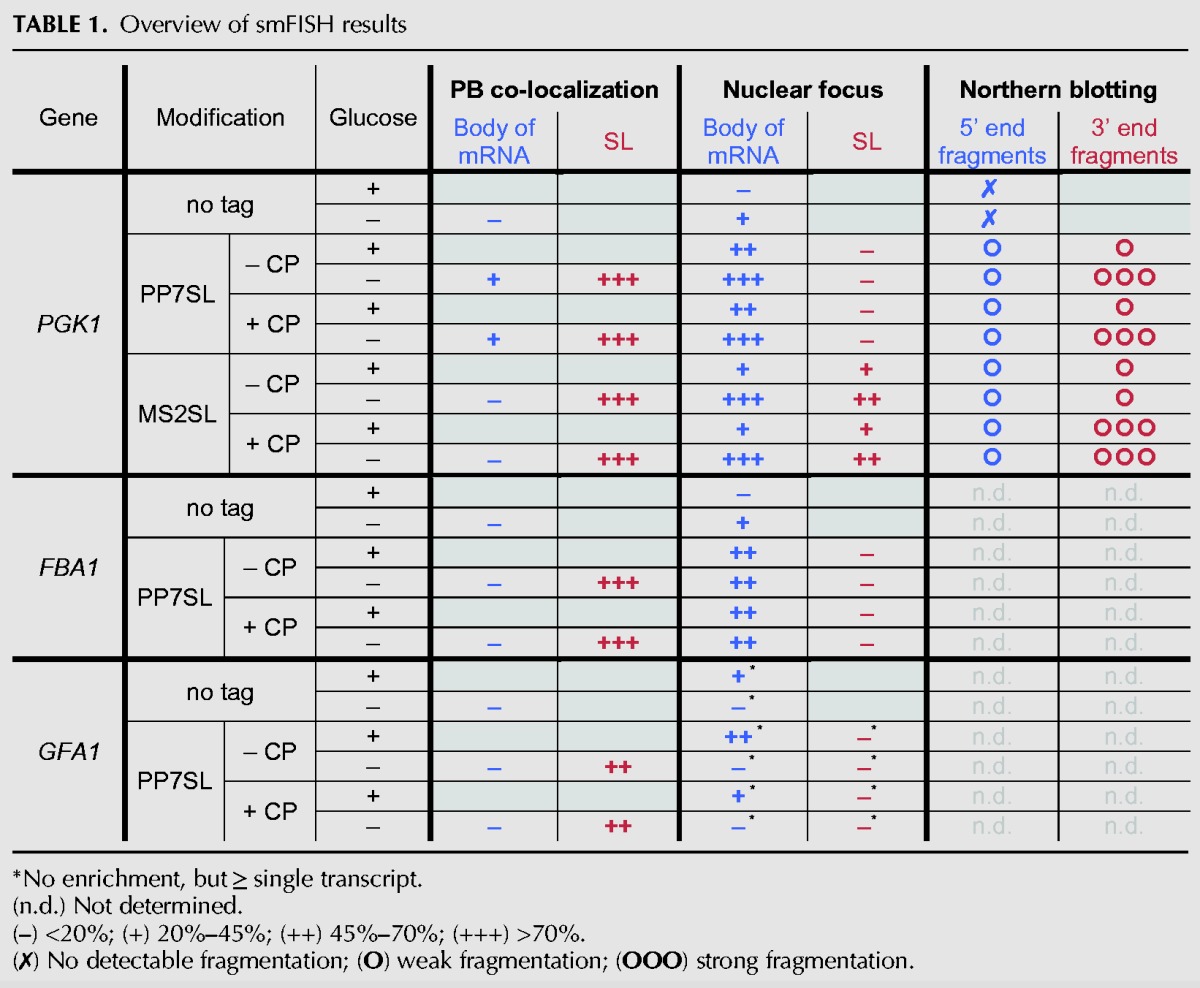
In the cytoplasm, almost all PBs colocalize with PGK1-24xPP7SL mRNA foci detected by PP7SL-specific probes in glucose starvation conditions, phenocopying the effect seen for PGK1-24xMS2SL (Fig. 2A,B). Interestingly, while a substantial amount of single PGK1-24xMS2SL mRNAs can still be detected with both PGK1- and MS2SL-probes outside of PBs (Fig. 1B, –glucose panel) very few cytoplasmic PGK1-24xPP7SL mRNAs can be found outside PBs in glucose starvation conditions with either the PGK1- or the PP7SL probes (Fig. 2A, –glucose panel, and Supplemental Fig. S2A). This further suggests that MS2SL and PP7SL, despite causing overall very similar cellular processing phenotypes, are not completely interchangeable. This is also supported by Northern blot experiments performed on cells expressing PGK1 transcripts that contain either PP7SLs or MS2SLs. Multiple-length 3′-end mRNA fragments are detected for both types of transcripts when probed with SL-specific oligos (Fig. 2D,E), while 5′-end mRNA fragments are hardly present (Supplemental Fig. S2B,C). In agreement with Garcia and Parker (2015, 2016) there is an increase in fragment occurrence for MS2SL when the MS2 coat protein is coexpressed (Fig. 2E). However, mRNA fragmentation of PP7SL-containing transcripts is independent of the presence or absence of the PP7 coat protein and is strongly increased in glucose starvation conditions (for an overview of the results, see Table 1).
TABLE 1.
Overview of smFISH results
Similar to PGK1, tagging FBA1 and GFA1 mRNA with PP7SL alters their cellular processing
So far, our results demonstrate that both MS2SL and PP7SL systems can alter cellular processing of the mRNA encoding Pgk1. To test whether SL labeling affects other messages as well, we next tagged mRNAs of the essential genes FBA1 (coding for fructose 1,6-bisphosphate aldolase) and GFA1 (coding for glutamine-fructose-6-phosphate amidotransferase) with 24xPP7SL. FBA1 is among the most abundant mRNAs (on average 80–400 transcripts per cell), whereas GFA1 is moderately expressed (on average 4–14 transcripts per cell) (Molina-Navarro et al. 2008; Siwiak and Zielenkiewicz 2010; Smith et al. 2015).
We first visualized endogenous untagged mRNAs and their localization to PBs in strains expressing Dcp2-GFP using smFISH with gene-specific probes (Fig. 3A,B; Supplemental Fig. 3A,B, and quantification in Fig. 3C). Similar to PGK1 mRNAs, both FBA1 and GFA1 mRNAs are not enriched in PBs in glucose-starved cells, suggesting that these mRNAs are not stored in PBs, and that mRNA storage in PBs is not a general feature of mRNA processing during glucose starvation.
FIGURE 3.

(A) Tagging of FBA1 mRNA at 3′ end with 24xPP7SL alters its cellular localization, with 3′-end fragments of PP7SL enriching in PBs. smFISH, imaging, and image processing is performed as in Figure 1B using strains expressing DCP2-GFP and either FBA1 or FBA1-24xPP7SL. Fluorescent DNA probes target either the FBA1 (i) or PP7SL (ii) moieties (Supplemental Table S3). White arrows show example cells with large mRNA foci colocalizing with the nucleus. Scale bar, 5 µm. (B) Tagging of GFA1 mRNA at its 3′ end with 24xPP7SL alters its cellular localization, with 3′-end fragments of PP7SL enriching in PBs. smFISH, imaging, and image processing is performed as in Figure 1B using strains expressing DCP2-GFP and either GFA1 or GFA1-24xPP7SL. Fluorescent DNA probes target either the GFA1 (i) or PP7SL (ii) moieties (Supplemental Table S3). White arrows show example cells with large mRNA foci colocalizing with the nucleus. Scale bar, 5 µm. (C,D) Quantification of colocalization of PBs with mRNA in glucose starvation conditions shown in Figure 3A,B, respectively. Percentage depicts number of PBs colocalizing with mRNAs compared to total number of PBs. n = 3 biological replicates with each >800 counted PBs; bars depict SD. Quantification of colocalization is performed on all planes of a 3D stack image using the Colocalization Threshold tool in Fiji. (E,F) Quantification of colocalization of nuclear DNA with mRNA foci in glucose-rich and glucose starvation conditions shown in Figure 3A,B, respectively. Percentage depicts nuclear DNA (judged by DAPI signal) colocalizing with mRNAs compared to total number of nuclear DNA. n = 3 biological replicates with each >300 counted nuclei; bars depict SD. Quantification of colocalization is performed on all planes of a 3D stack image using the Colocalization Threshold tool in Fiji. Note that since GFA1 is a low abundant mRNA, we hardly observe any nuclear signal that was brighter than the signal of an individual transcript. We therefore adjusted our quantification to a lower threshold compared to our PGK1 or FBA1 nuclear foci analysis to account for all mRNA/DAPI colocalization events.
We then investigated the effect of 24xPP7SL on the cellular localization of FBA1 and GFA1 mRNAs. Again, we used probes that either bind to the gene-specific moiety of the FBA1 or GFA1 transcripts or PP7SL-specific probes. Similar to SL-labeled PGK1 mRNAs, the majority of SL-labeled FBA1 or GFA1 mRNAs do not enrich in PBs when we probe for the gene-specific mRNA moiety (mRNA-positive PBs <20% for both SL-tagged mRNAs; Fig. 3A,B, and quantification in Fig. 3C). In contrast, we observe a strong increase in PB colocalization with mRNAs using the PP7SL-specific probe (∼90% for FBA1-24xPP7SL and ∼50%–60% for GFA1-24xPP7SL). Again this suggests that the majority of PB-localized mRNAs contain only 3′-end SL fragments, consistent with a PP7SL-dependent impairment of cytoplasmic mRNA decay.
In addition, FBA1 transcripts tagged with PP7SL also display nuclear processing defects, as we observe accumulation of mRNA signal in a single nuclear focus when we probe with the FBA1-specific probe (Fig. 3A [arrows], quantification in Fig. 3E). Unlike the SL-tagged PGK1 transcripts, nuclear FBA1-24xPP7SL mRNA foci are observed in both glucose-rich and glucose-starved conditions, with 50% of SL-expressing cells having mRNA foci-positive nuclei, compared to 15% (+glucose) or 30% (−glucose) of cells expressing untagged FBA1 (Fig. 3E). Quantification of maximum brightness revealed that, similar to the nuclear PGK1 focus, the number of mRNA foci-positive nuclei increases in the presence of PP7SLs, and at the same time more mRNAs per focus can be detected. The signal of a single nuclear mRNA focus can be up to 12 times brighter compared to the signal of an individual mRNA when PP7SL sites are added to the FBA1 gene. In contrast, the nuclear focus of untagged FBA1 displays only an up to five times higher signal compared to a single transcript (Supplemental Fig. S3C).
For the low abundance GFA1 transcript, we could not detect any nuclear foci that were brighter than individual transcripts with and without stem–loop sequences. We also did not observe any differences in the total number of mRNA-positive nuclei comparing different GFA1 constructs exposed to the same culture condition (Fig. 3F). Whether this is a reflection of the low transcription frequency of GFA1 or whether this suggests that different mRNAs have different tolerance to stem–loops for their nuclear processing is unclear.
Conclusions
Our results demonstrate that mRNA labeling with bacteriophage stem–loops can affect mRNA processing in the nucleus and the cytoplasm. We tested localization properties of three SL-labeled mRNAs, and all three display similar aberrant enrichment in P-bodies suggesting that MS2 and PP7 stem–loop labeling in general affects the degradation of mRNAs (Table 1). In addition, two out of three SL-labeled mRNAs display increased focus formation in the nucleus, pointing toward nuclear processing defects for at least a subset of mRNAs. This needs to be considered when RNA localization is examined using this approach. However, we cannot exclude that for some mRNAs the stem–loop-labeling system does not affect transcript processing, and furthermore, we show that the effects vary between different growth conditions. It should also be noted that we focused here on experiments in budding yeast and that other organisms might process these stem–loops differently.
Haimovich et al. (2016) have argued that previous studies using the MS2–MCP system did not observe an accumulation of 3′-end fragments. Some of these experiments were performed in glucose-rich conditions (Andoh et al. 2006; Kilchert and Spang 2011), where we only observe mild localization defects as well (Fig. 1B; Supplemental Fig. S2A,B). In addition, previous reports often did not include comparisons between the tagged mRNA and its untagged wild-type version, which makes it difficult to draw conclusions from the localization results of the tagged mRNA only (Hocine et al. 2013; Kraut-Cohen et al. 2013; Haimovich et al. 2016).
Potential solutions to reduce 3′-end fragment accumulation include the reduction of the number of stem–loops used for transcript labeling. However, if the number of SLs is reduced below a critical threshold this will prevent live cell imaging experiments, which rely on a good signal-to-noise ratio of labeled mRNA over cellular background. The use of alternative labeling strategies could also reduce or abolish 3′-end fragment formation. Garcia and Parker (2015) suggested that the U1A stem–loop labeling system could be such an alternative, as they show that cells expressing PGK1 tagged with 16xU1A stem–loops are devoid of 3′-end fragments in the presence of the U1A protein. However, it should be noted that the PGK1 mRNA labeled with 16xU1A stem–loops was previously reported to colocalize with PBs in glucose-starvation conditions (Teixeira et al. 2005), whereas in our hands the unlabeled PGK1 transcript is not enriched in PBs.
In summary, smFISH is a powerful tool to map the cellular localization of individual mRNA regions, and we recommend that any given mRNA-SL construct needs to be carefully analyzed for the appearance of aberrant fragments to avoid misinterpretation of mRNA localization data. However, we also emphasize that, with the appropriate controls, the stem–loop labeling system remains a powerful tool to visualize the dynamics of important mRNA processing steps such as nuclear export, translation, or RNA decay in living cells.
SUPPLEMENTAL MATERIAL
Supplemental material is available for this article.
Supplementary Material
ACKNOWLEDGMENTS
This work was supported by the Swiss National Science Foundation (SNF 159731 to K.W. and SNF 31003A_160338 to C.M.A.). S.H. was supported by a European Molecular Biology Organization (EMBO) Long-Term Fellowship (ALTF 290-2014, EMBOCOFUND2012, GA-2012-600394). C.L.S. was supported by an ETH Zurich Postdoctoral Fellowship (FEL-31 15-1).
Footnotes
Article is online at http://www.rnajournal.org/cgi/doi/10.1261/rna.057786.116.
REFERENCES
- Abruzzi KC, Belostotsky DA, Chekanova JA, Dower K, Rosbash M. 2006. 3′-End formation signals modulate the association of genes with the nuclear periphery as well as mRNP dot formation. EMBO J 25: 4253–4262. [DOI] [PMC free article] [PubMed] [Google Scholar]
- Andoh T, Oshiro Y, Hayashi S, Takeo H, Tani T. 2006. Visual screening for localized RNAs in yeast revealed novel RNAs at the bud-tip. Biochem Biophys Res Commun 351: 999–1004. [DOI] [PubMed] [Google Scholar]
- Beach DL, Salmon ED, Bloom K. 1999. Localization and anchoring of mRNA in budding yeast. Curr Biol 9: 569–578. [DOI] [PubMed] [Google Scholar]
- Bertrand E, Chartrand P, Schaefer M, Shenoy SM, Singer RH, Long RM. 1998. Localization of ASH1 mRNA particles in living yeast. Mol Cell 2: 437–445. [DOI] [PubMed] [Google Scholar]
- Brengues M, Teixeira D, Parker R. 2005. Movement of eukaryotic mRNAs between polysomes and cytoplasmic processing bodies. Science 310: 486–489. [DOI] [PMC free article] [PubMed] [Google Scholar]
- Brodsky AS, Silver PA. 2000. Pre-mRNA processing factors are required for nuclear export. RNA 6: 1737–1749. [DOI] [PMC free article] [PubMed] [Google Scholar]
- Farnung BO, Brun CM, Arora R, Lorenzi LE, Azzalin CM. 2012. Telomerase efficiently elongates highly transcribing telomeres in human cancer cells. PLoS One 7: e35714. [DOI] [PMC free article] [PubMed] [Google Scholar]
- Garcia JF, Parker R. 2015. MS2 coat proteins bound to yeast mRNAs block 5′ to 3′ degradation and trap mRNA decay products: implications for the localization of mRNAs by MS2-MCP system. RNA 21: 1393–1395. [DOI] [PMC free article] [PubMed] [Google Scholar]
- Garcia JF, Parker R. 2016. Ubiquitous accumulation of 3′ mRNA decay fragments in Saccharomyces cerevisiae mRNAs with chromosomally integrated MS2 arrays. RNA 22: 657–659. [DOI] [PMC free article] [PubMed] [Google Scholar]
- Gu W, Deng Y, Zenklusen D, Singer RH. 2004. A new yeast PUF family protein, Puf6p, represses ASH1 mRNA translation and is required for its localization. Genes Dev 18: 1452–1465. [DOI] [PMC free article] [PubMed] [Google Scholar]
- Haim L, Zipor G, Aronov S, Gerst JE. 2007. A genomic integration method to visualize localization of endogenous mRNAs in living yeast. Nat Methods 4: 409–412. [DOI] [PubMed] [Google Scholar]
- Haimovich G, Zabezhinsky D, Haas B, Slobodin B, Purushothaman P, Fan L, Levin JZ, Nusbaum C, Gerst JE. 2016. Use of the MS2 aptamer and coat protein for RNA localization in yeast: a response to “MS2 coat proteins bound to yeast mRNAs block 5′ to 3′ degradation and trap mRNA decay products: implications for the localization of mRNAs by MS2-MCP system”. RNA 22: 660–666. [DOI] [PMC free article] [PubMed] [Google Scholar]
- Heinrich S, Geissen EM, Kamenz J, Trautmann S, Widmer C, Drewe P, Knop M, Radde N, Hasenauer J, Hauf S. 2013. Determinants of robustness in spindle assembly checkpoint signalling. Nat Cell Biol 15: 1328–1339. [DOI] [PubMed] [Google Scholar]
- Hocine S, Raymond P, Zenklusen D, Chao JA, Singer RH. 2013. Single-molecule analysis of gene expression using two-color RNA labeling in live yeast. Nat Methods 10: 119–121. [DOI] [PMC free article] [PubMed] [Google Scholar]
- Kilchert C, Spang A. 2011. Cotranslational transport of ABP140 mRNA to the distal pole of S. cerevisiae: cotranslational transport of ABP140 mRNA. EMBO J 30: 3567–3580. [DOI] [PMC free article] [PubMed] [Google Scholar]
- Kraut-Cohen J, Afanasieva E, Haim-Vilmovsky L, Slobodin B, Yosef I, Bibi E, Gerst JE. 2013. Translation- and SRP-independent mRNA targeting to the endoplasmic reticulum in the yeast Saccharomyces cerevisiae. Mol Biol Cell 24: 3069–3084. [DOI] [PMC free article] [PubMed] [Google Scholar]
- Larson DR, Zenklusen D, Wu B, Chao JA, Singer RH. 2011. Real-time observation of transcription initiation and elongation on an endogenous yeast gene. Science 332: 475–478. [DOI] [PMC free article] [PubMed] [Google Scholar]
- Molina-Navarro MM, Castells-Roca L, Bellí G, García-Martínez J, Marín-Navarro J, Moreno J, Pérez-Ortín JE, Herrero E. 2008. Comprehensive transcriptional analysis of the oxidative response in yeast. J Biol Chem 283: 17908–17918. [DOI] [PubMed] [Google Scholar]
- Simpson CE, Lui J, Kershaw CJ, Sims PF, Ashe MP. 2014. mRNA localization to P-bodies in yeast is bi-phasic with many mRNAs captured in a late Bfr1p-dependent wave. J Cell Sci 127: 1254–1262. [DOI] [PMC free article] [PubMed] [Google Scholar]
- Siwiak M, Zielenkiewicz P. 2010. A comprehensive, quantitative, and genome-wide model of translation. PLoS Comput Biol 6: e1000865. [DOI] [PMC free article] [PubMed] [Google Scholar]
- Smith C, Lari A, Derrer CP, Ouwehand A, Rossouw A, Huisman M, Dange T, Hopman M, Joseph A, Zenklusen D, et al. 2015. In vivo single-particle imaging of nuclear mRNA export in budding yeast demonstrates an essential role for Mex67p. J Cell Biol 211: 1121–1130. [DOI] [PMC free article] [PubMed] [Google Scholar]
- Takizawa PA, Vale RD. 2000. The myosin motor, Myo4p, binds Ash1 mRNA via the adapter protein, She3p. Proc Natl Acad Sci 97: 5273–5278. [DOI] [PMC free article] [PubMed] [Google Scholar]
- Teixeira D, Sheth U, Valencia-Sanchez MA, Brengues M, Parker R. 2005. Processing bodies require RNA for assembly and contain nontranslating mRNAs. RNA 11: 371–382. [DOI] [PMC free article] [PubMed] [Google Scholar]
- Urbanek MO, Galka-Marciniak P, Olejniczak M, Krzyzosiak WJ. 2014. RNA imaging in living cells—methods and applications. RNA Biol 11: 1083–1095. [DOI] [PMC free article] [PubMed] [Google Scholar]
- Zid BM, O'Shea EK. 2014. Promoter sequences direct cytoplasmic localization and translation of mRNAs during starvation in yeast. Nature 514: 117–121. [DOI] [PMC free article] [PubMed] [Google Scholar]
Associated Data
This section collects any data citations, data availability statements, or supplementary materials included in this article.