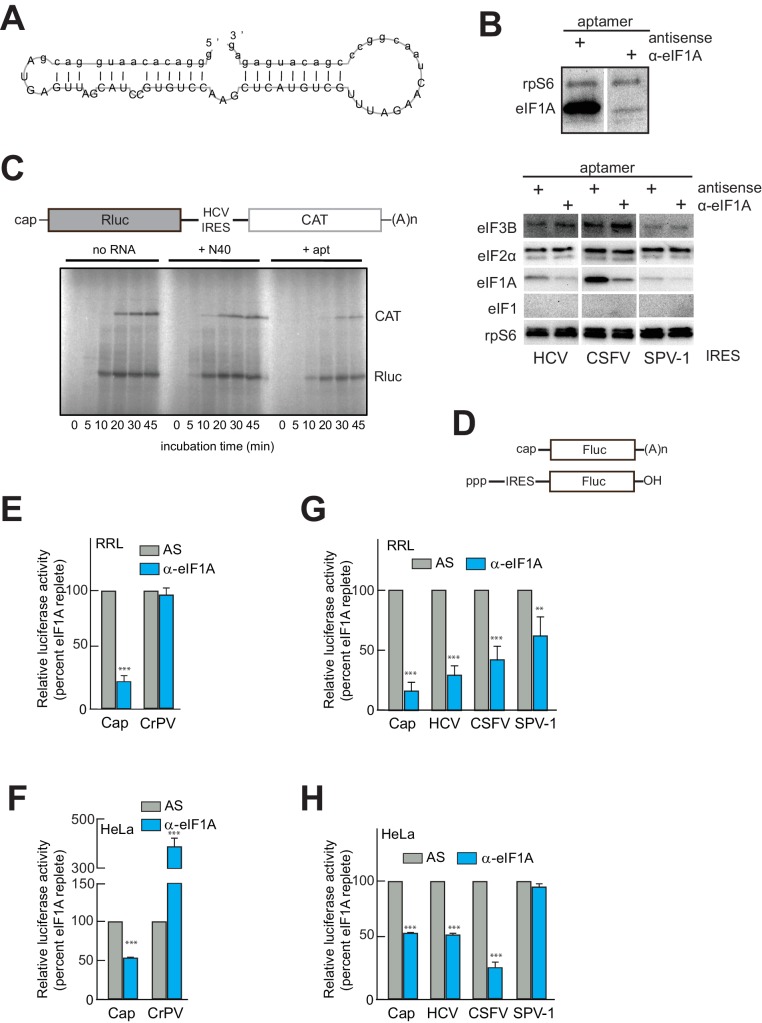
Figure 2. An RNA aptamer targeting eIF1A for inactivation negatively affects both cap- and IRES-driven translation in lysate.
(A) Sequence and predicted secondary structure of the α-eIF1A aptamer used in this study. (B) Top: Results of pull-down experiment with the HCV IRES (similar to Figure 1), showing substantial depletion of eIF1A with aptamer treatment compared to negative control antisense (AS) aptamer RNA. Bottom: Pull-down experiments with several IRES RNAs, with blotting to detect eIFs that should not be removed or depleted by the aptamer. (C) 35S-Met labeling of translation products in RRL using a dual-reporter mRNA template. The aptamer treatment reduces protein levels over time from IRES-driven (CAT) and cap-driven (Rluc) messages. The effect of apatamer (+ apt) addition is shown compared to the addition of no RNA or a randomized 40 nucleotide RNA (+ N40). (D) Diagram of monocistronic reporters used in the experiments of panels (E–H). (E) Results of translation assays in RRL using reporter RNAs. The level of each RNA in untreated lysate is set at 100% and the effect of aptamer treatment is reported as a percentage of that for each RNA. Capped (Cap) RNA is the positive control and the CrPV IRES is the negative control for a requirement for eIF1A. (F) Identical to panel (E) but assayed in HeLa cell extract. (G) Translation assays in RRL using reporter RNAs with the HCV, CSFV, and SPV-1 IRESs. Cap is included as a control. (H) Identical to panel (G) but assayed in HeLa cell extract. In panels (E–H), error bars represent averages ±SEM of ≥3 independent experiments. Statistical significance shown by: *p<0.05, **p<0.01, ***p<0.001.


