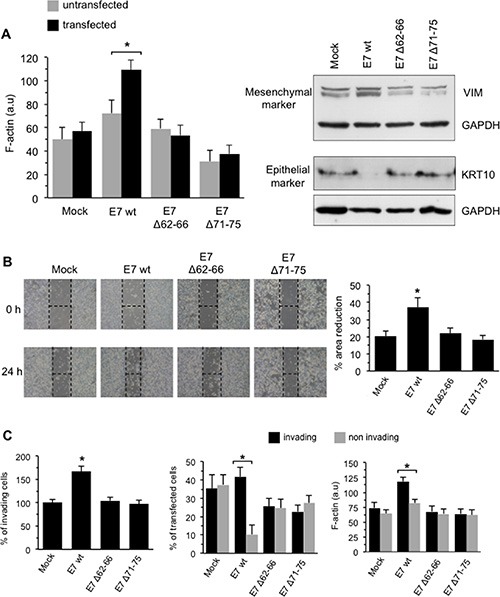
Figure 5. Effects of transduced E7 in HPV-16-null C-33A CC cells.

(A) Left panel. Flow cytometry evaluation of F-actin intracellular content (expressed by the median fluorescence intensity in FL4 channel) in transfected (FL1/FL4 double positive cells, black columns) or non-transfected (FL4 single positive cells, grey columns) cells. Results are reported as mean ± SD among three independent experiments. Right panel. Western blot analysis of vimentin (VIM) and keratin 10 (KRT10) in C33-A transfected cells. Loading control was evaluated using anti-α-tubulin MAb. (B) Right panel. Migration test performed by scratch assay on C-33A transfected with mock construct, with E7 (E7 wt) or one of its deletion mutants E7Δ62-66 and E7Δ71-75. Representative phase contrast microscopy images of three independent experiments are shown. Left panel. Quantification of the area reduction at 24 h represented as the percentage of wounded area at time 0. Results represent the mean ± SD of three independent experiments. (*) Indicates p < 0.01 vs. E7wt-transfected cells. (C) Left panel. Invasion test on C-33A cells transfected with E7 oncoprotein (E7 wt) or one of its deletion mutants E7Δ62-66 and E7Δ71-75 performed in vitro by using transwell culture inserts (8.0-μm pore size) coated with Matrigel. Data are reported as mean ± SD of the percentage of invading cells obtained in three independent experiments. Central panel. Flow cytometry differential analysis of invading (bottom Matrigel-coated filter) or non-invading (upper Matrigel-coated filter) cells to quantify the percentage of transfected (FL1 positive) cells. Right panel. Flow cytometry evaluation of F-actin intracellular content (expressed by the median fluorescence intensity) in invading or non-invading cells. Results are reported as mean ± SD obtained from three independent experiments. Analyses reported in (C) were restricted to transfected (FL1 positive) cells only. (*) Indicates: p < 0.01 vs. E7 wt-transfected cells in (B) and (C), left panel; P < 0.01 vs. the indicated sample in (A) and (C), central an right panels.
