
Figure 5. Kaplan-Meier survival analysis of the 89-gene signature in grades.
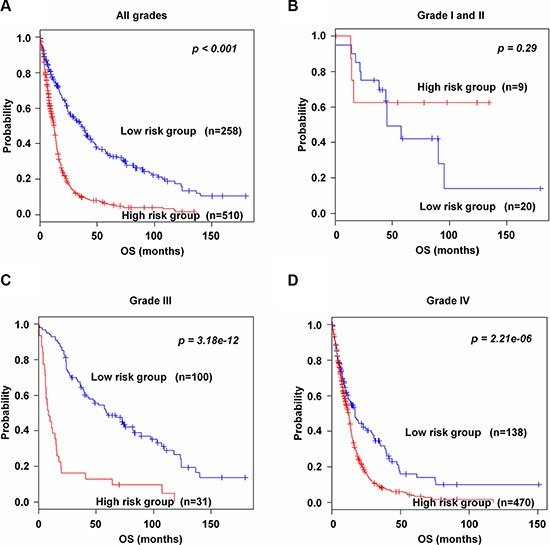
(A) Patients in all grades in the combined training and validation data sets. (B) Patients in grades I and II in the combined training and validation data sets. (C–D) Patients in grades III and IV in the combined training and validation data sets. Each group was classified into high and low risk groups. The p values were computed by the log-rank test.