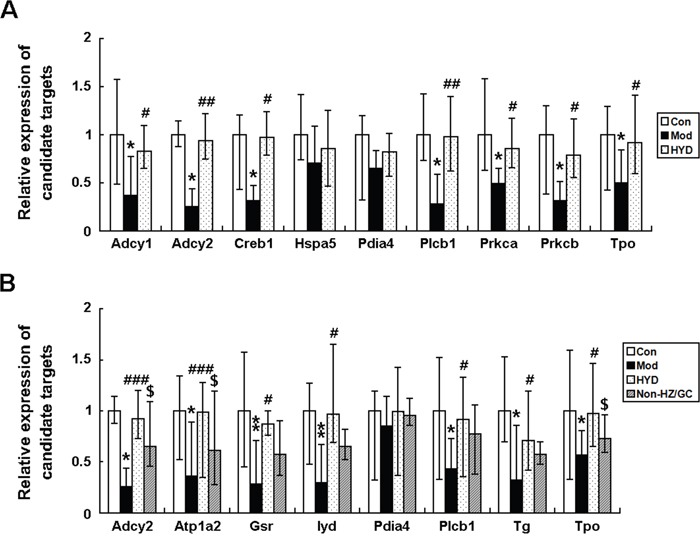
Figure 6. Effect of HYD and the herb pair HZ-GC on mRNA expression levels of the corresponding candidate targets according to real-time PCR analysis.

Data are represented as the mean ± S.E. ‘*’, ‘**’, and ‘***’, P<0.05, P<0.01, and P<0.001, respectively, comparison with the normal control group. '#' and '##', P<0.05 and P<0.01, respectively, comparison with the model group. '$' and '$$', P<0.05 and P<0.01, respectively, comparison with the HYD group.
