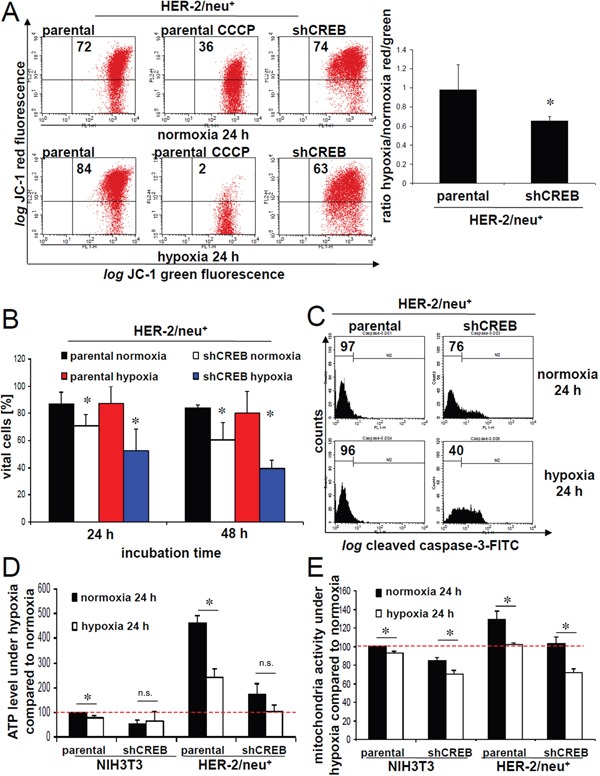
Figure 7. Decreased mitochondrial membrane potential and cell vitality upon CREB silencing.

A. The mitochondrial membrane potential was determined in normoxic or hypoxic cultivated cells by using JC-1 fluorescence analysis. The fluorescence of 5×10³ stained cells was analysed with a FACsCalibur (BD) and CCCP-treated cells (2 μM) served as a control. The number of cells with an intact mitochondrial membrane potential is given in the upper right region (left). The ratio of cells with an intact mitochondrial membrane potential under normoxia/hypoxia is given for three independent experiments (right). B. The amount of apoptotic and necrotic cells was determined by annexin V/propidium iodide staining as recently described [35]. 1×10⁴ stained cells were analysed with a FACS Calibur (BD). The amount of vital cells after 24 h and 48 h cultivation is shown in the bar charts. Data represent the mean of three independent experiments. C. Cleaved caspase-3 activity was measured as recently described by Stehle and co-authors [35]. Both parental or CREB-deficient HER-2/neu+ cells were cultured under normoxic and hypoxic conditions before cleaved caspase-3 was determined as described in Materials and Methods using flow cytometry. D. ATP levels were measured with a luciferase specific substrate as described in Materials and Methods. Data show mean values from three independent experiments. E. Mitochondrial activity was analysed with the colorimetrical XTT substrate assay as described in Materials and Methods. Data show mean values from three independent experiments.
