Abstract
The extent of charging resulting from electrothermal supercharging for protein ions formed from various buffered aqueous solutions using nanoESI emitters with tip diameters between ~1.5 μm and ~310 nm is compared. Charging increases with decreasing tip size for proteins that are positively charged in solution but not for proteins that are negatively charged in solution. Charging with the smaller tips also increases with increasing solution pH. These results suggest that Coulombic attraction between positively charged protein molecules and the negatively charged glass surfaces in the tips of the emitters causes destabilization and even unfolding of proteins prior to nanoESI. Coulombic attraction to the negatively charged glass surfaces does not occur for negatively charged proteins and the extent of charging with electrothermal supercharging decreases with decreasing tip size. Smaller droplets are formed with smaller tips, and these droplets have shorter lifetimes for protein unfolding with electrothermal supercharging to occur prior to gaseous ion formation. Results from this study demonstrate simple principles to consider in order to optimize the extent of charging obtained with electrothermal supercharging, which should be useful for obtaining more structural information in tandem mass spectrometry.
Graphical Abstract
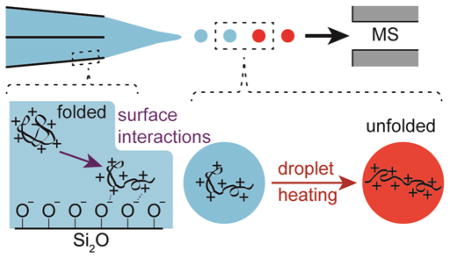
The extent of charging resulting from electrothermal supercharging increases with decreasing tip size for positively charged proteins.
Introduction
Electrospray ionization (ESI) mass spectrometry (MS) is a powerful tool for identifying proteins and for obtaining information about protein structure, including posttranslational modifications.1–3 Native MS,4,5 where protein ions are formed by ESI from buffered aqueous solutions in which the proteins have folded native or native-like conformations and activities, is useful for measuring protein-ligand binding affinities,6,7 stoichiometries of protein complexes,8,9 and thermodynamics and kinetics of protein complex assembly.10,11 Native MS typically produces compact gaseous ions with low charge states.8,9 However, the formation of high charge state ions can increase both sensitivity and resolution for charge detection instruments, such as orbitrap and ion cyclotron resonance mass spectrometers.12,13 Higher charge states fragment more readily, often resulting in increased structural information in tandem MS.14–16 Fewer cations adduct to higher charge states,17,18 and unresolved adducts can broaden ion peaks in ESI mass spectra, resulting in lower resolution and mass measuring accuracy.19
High charge state ions are most often formed from solutions containing acids and organic solvents in which proteins are denatured. High charge states can also be formed in native MS by adding supercharging reagents20–27 or trivalent metal ions28 to the analyte solution prior to ESI, by exposing the ESI droplets to acidic29 or basic30 vapors, or by using electrothermal supercharging (ETS).31–33 In ETS, protein ions are formed from buffered aqueous solutions using high spray potentials, which results in collisional heating of the ESI droplets and thermal denaturation of the proteins inside the droplets prior to ion formation,31,33 although other possibly contributing mechanisms have been proposed.32 ETS does not scramble H/D information encoded in the solution, making it well suited to top-down H/D exchange experiments.34 Charge states as high or higher than those obtained from denaturing solution can be obtained with ETS.35 The effectiveness of ammonium and sodium salts at forming high charge states with ETS increases with increasing propensity to induce protein aggregation in solution.33 Electron capture dissociation of the 16+ cytochrome c ions formed from ETS and from denaturing solutions resulted in the same extent of sequence coverage, but there were differences in the cleavage sites, indicating that different ion conformers of the same charge state can be formed by ETS and from denaturing solutions.35 The effects of protein isoelectric point (pI) on ETS have been investigated,33,35 and ETS is generally slightly more effective for proteins that are positively charged compared to those that are negatively charged in solution.35
Higher charging can also be obtained by using ESI emitters with smaller tips. For example, the average charge of ubiquitin ions formed from a 50/50 water/methanol solution increases from ~7 to ~7.5 when the tip outer diameters (o.d.) is reduced from ~45 μm to ~2 μm.36 Higher charging and narrower charge-state distributions were also reported for cytochrome c and ubiquitin ions formed from denaturing solutions with <100 nm o.d. tips compared to that obtained with ~1 μm o.d. tips.37 Improved signal-to-noise ratios and higher charging with decreasing tip size have also been reported for angiotensin I38 and insulin chain B39 ions formed using ESI emitters with adjustable orifice sizes.38,39 In these devices, the orifice width is varied between 1 and 10’s of microns by adjusting the position of silicon chips.
Recently, increased charging with decreasing tip size was reported for several proteins and a 14 residue peptide using double-barrel wire-in-a-capillary emitters (theta-glass emitters) with tips between ~1.5 μm and ~240 nm o.d.40,41 Additional high charge-state distributions in the ESI spectrum were often formed with the smaller tip sizes.40,41 Loss of heme occurred for holo-myoglobin ions formed from a slightly acidified aqueous solution with submicron o.d. tips, whereas the heme is retained for ions formed from this solution with micron o.d. tips.41 The formation of high charge-state distributions and the loss of heme for myoglobin indicate that fractions of these protein populations are unfolded with the submicron o.d. tips.40,41 More unfolding occurs with decreasing tip size for partially unfolded proteins than for folded proteins.41
Increased charging with decreasing tip size has only been reported for proteins that are positively charged in solution.36–41 For proteins that are negatively charged in solution, changes in tip o.d. between ~1.5 μm and ~310 nm did not result in measurable changes to the average charge of protein ions.41 Nano-ESI emitters are typically prepared from borosilicate glass36,37,40,41 or other forms of silicon38,39 that contain silanol groups on their surfaces.42 In aqueous solutions, a fraction of the silanol groups are deprotonated, resulting in a net negative charge on glass surfaces that depends on the solution pH.42 The increased charging obtained with decreasing tip size for positively charged proteins but not for negatively charged proteins suggests that the increased charging with decreasing tip size results from Coulombic attraction between positively charged protein molecules and the negatively charged glass surfaces in the tips of the nanoESI emitters, which results in protein destabilization and unfolding prior to nanoESI.41
Here, ETS is performed using emitters with micron and submicron o.d. tips prepared from borosilicate theta-glass capillaries. The efficiency of ETS at producing high charge state ions increases with decreasing tip size for proteins that are positively charged in solution but decreases with decreasing tip size for proteins that are negatively charged in solution. These results indicate that when surface-induced destabilization of the protein conformation occurs in the tips of the emitters prior to nanoESI, charging with ETS is enhanced in the droplets. When surface interactions do not occur in the tips of the nanoESI emitters, such as with negatively charged protein molecules, the extent to which high charge states are formed with ETS decreases with decreasing tip size. This reduced charging with decreased tip size likely results from droplets with smaller initial diameters that are formed with the smaller tips. Smaller droplets have shorter lifetimes,40,43 which limit the extent to which protein unfolding can occur in the nanoESI droplets prior to gaseous ion formation. These results demonstrate a simple method for increasing the extent of charging obtained with ETS, which should be useful for obtaining more structural information in tandem MS.
Experimental Section
Experiments are performed with a 9.4 T Fourier-transform ion cyclotron resonance mass spectrometer that is described elsewhere.44 Ions are formed by nanoESI using theta glass capillaries (Warner Instruments, LLC, Hamden, CT) with tips pulled to a small o.d. using a model p-87 Flaming/Brown micropipette puller (Sutter Instruments Co., Novato, CA). The tips of these emitters are imaged on carbon tape at 10,000-times magnification (Fig. S1) with a TM-1000 scanning electron microscope (Hitachi High-Technologies Co., Tokyo, Japan). Grounded platinum wires are inserted to within ~1 cm of the tips of the emitters and are in contact with the solutions. The distance between the platinum wires and the tips of the emitters does not affect the extent of charging resulting from nanoESI as long as contact is made between the wires and the solutions. The emitters are positioned ~1 mm from the mass spectrometer inlet, and nanoESI is initiated by applying a negative potential to the heated capillary of the ESI interface. Native MS and ETS were performed with 700 V and 1050 V spray potentials, respectively. Data are acquired with a Predator data station,45 and mass spectra are background subtracted. To determine flow rates, the emitters are weighed before and after ~20 min of electrospray using an A-200DS analytical balance (Denver Instrument Company, Bohemia, NY) with a lower mass limit of 10 μg. Spray currents are measured with a model 485 autoranging picoammeter (Keithley Instruments, Cleveland, OH) with a 2 Hz refresh rate. Average charge is computed as abundance weighted sums of the individual charge states, and reported uncertainties are standard deviations determined from triplicate measurements.
Ammonium acetate, ammonium formate, ammonium bicarbonate, L-arginine hydrochloride, equine apo- and holo-myoglobin, cytochrome c, bovine β-lactoglobulin A, ribonuclease A, ubiquitin, and chicken egg white lysozyme are obtained from Sigma-Aldrich (St. Louis, MO). Solutions are prepared with a 10 μM analyte concentration in 18.2 MΩ water from a Milli-Q water purification system (Millipore, Billerica, MA).
Results and Discussion
Electrothermal Supercharging of a Noncovalent Complex
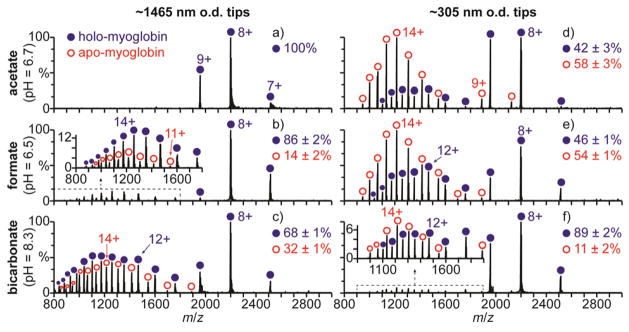
Mass spectra of hMb in 100 mM aqueous ammonium acetate (pH = 6.7), formate (pH = 6.5), and bicarbonate (pH = 8.3) solutions obtained with large ~1465 nm o.d. ESI emitter tips under ETS conditions (1050 V spray potential) are shown in Fig. 1a–c, respectively. In 100 mM aqueous salt solutions, hMb is in a native conformation between pH = 5 and 7, a slightly unfolded globular conformation around pH = 3,46 and an unfolded conformation with no heme attached below pH = 3.47 Only the 7–9+ charge states are formed with the ammonium acetate solution (Fig. 1a), consistent with hMb adopting a folded conformation in solution. The 7–9+ charge states are also formed with this solution under native MS conditions (700 V spray potential, Fig. S2a), indicating that ETS does not result in a significant increase in charge. With the ammonium formate (Fig. 1b) and bicarbonate (Fig. 1c) solutions under ETS conditions, charge states corresponding to both folded (7–9+) and unfolded (10–21+) conformers of hMb are formed. Apo-myoglobin (aMb) ions are also formed, indicating that a fraction of myoglobin is unfolded, and aMb comprises 14 ± 2% and 32 ± 1% of myoglobin in Fig. 1b and 1c, respectively. No aMb or charge states greater than 9+ are formed with these solutions under native MS conditions (Fig. S2b and S2c, respectively), indicating that the unfolding and resulting increased charging obtained with the high spray potential result from ETS. The relative abundance of aMb produced under ETS conditions is greater with ammonium bicarbonate (32 ± 1%, Fig. 1c) than with ammonium formate (14 ± 2%, Fig. 1b) or ammonium acetate (0%, Fig. 1a). These results are consistent with the relative effectiveness of these three salts at inducing ETS reported previously.33
Fig. 1.
Mass spectra of hMb (pI = 7.4) under electrothermal supercharging conditions (1050 V spray potential) in aqueous solutions containing 100 mM (a,d) ammonium acetate (pH = 6.7), (b,e) ammonium formate (pH = 6.5), and (c,f) ammonium bicarbonate (pH = 8.3) acquired with (a–c) ~1465 and (d–f) ~305 nm o.d. tips.
Results obtained for the ammonium acetate, formate, and bicarbonate solutions with the smaller ~305 nm o.d. tips under ETS conditions are shown in Fig. 1d–f, respectively. Charge states corresponding to both folded (7–9+) and unfolded (10–17+) conformers of hMb and to aMb are observed. With the ammonium acetate solution (Fig. 1d), aMb comprises 58 ± 3% of myoglobin. Neither aMb nor charge states of hMb greater than 9+ are produced with this solution under ETS conditions with the larger tips (Fig. 1a). With the ammonium formate solution, significantly more aMb is also produced with the smaller ~305 nm o.d. tips (54 ± 1%, Fig. 1e) than with the larger ~1465 nm o.d. tips (14 ± 2%, Fig. 1b). However, with the ammonium bicarbonate solution (pH = 8.3), significantly less aMb is produced with the smaller tips (11 ± 2%, Fig. 1f) than with the larger tips (32 ± 1%, Fig. 1c).
The pI of hMb is 7.4,48 so hMb is predominantly positively charged in the pH = 6.7 ammonium acetate and pH = 6.5 ammonium formate solutions and predominantly negatively charged in the pH = 8.3 ammonium bicarbonate solution. The extent of unfolding resulting from ETS increases with decreasing tip size for proteins that are positively charged in solution but decreases with decreasing tip size for proteins that are negatively charged in solution. Glass surfaces are negatively charged in aqueous solution,42 and Coulombic attraction between positively charged protein molecules and the negatively charged glass surfaces in the tips of nanoESI emitters can result in protein unfolding prior to nanoESI.40 These results indicate that the increased ETS efficiency obtained with the smaller tips for proteins that are positively charged in solution results from surface-induced unfolding occurring in the tips of these emitters prior to droplet formation by nanoESI.
In order to provide additional evidence for protein unfolding as the origin of increased charging obtained with the smaller tips, experiments were performed with a protein that has intramolecular disulfide bonds and therefore cannot unfold as extensively as a protein without internal linkages. Lysozyme (pI = 11.3)49 has four disulfide bridges. In aqueous solutions, lysozyme adopts a globular conformation between pH = 2 and 6 and a slightly unfolded conformation above pH = 7.50 NanoESI of lysozyme in a 100 mM aqueous ammonium acetate solution (pH = 6.7) with ~1465 nm o.d. tips under ETS conditions results in the 6–9+ charge states (Figure 2a), consistent with a folded conformation in solution. These charge states are also formed from this solution under native MS conditions (Figure 2b), indicating that ETS does not result in measurable unfolding in this experiment. NanoESI of this solution with ~305 nm o.d. tips under ETS conditions (Figure 2c) also results in the 6–9+ charge states, as well as the 10+ and 11+ charge states. The higher charge states that are produced with the smaller tips are consistent with the formation of partially unfolded conformers that comprise 2 ± 1% of the population. The extent of unfolding obtained for lysozyme with the ~305 nm o.d. tips is significantly less than that obtained for myoglobin (~58% aMb produced) with the ammonium acetate solution and the same tip size (Figure 1d). The lower extent of unfolding obtained for lysozyme than for myoglobin is consistent with the four disulfide bonds in lysozyme resulting in less structural flexibility for this protein and thus less surface-induced unfolding occurring prior to nanoESI. This result is consistent with the lower extent of supercharging with supercharging reagents for proteins with more disulfide bridges or chemical crosslinks that reduce conformational flexibility.23
Fig. 2.
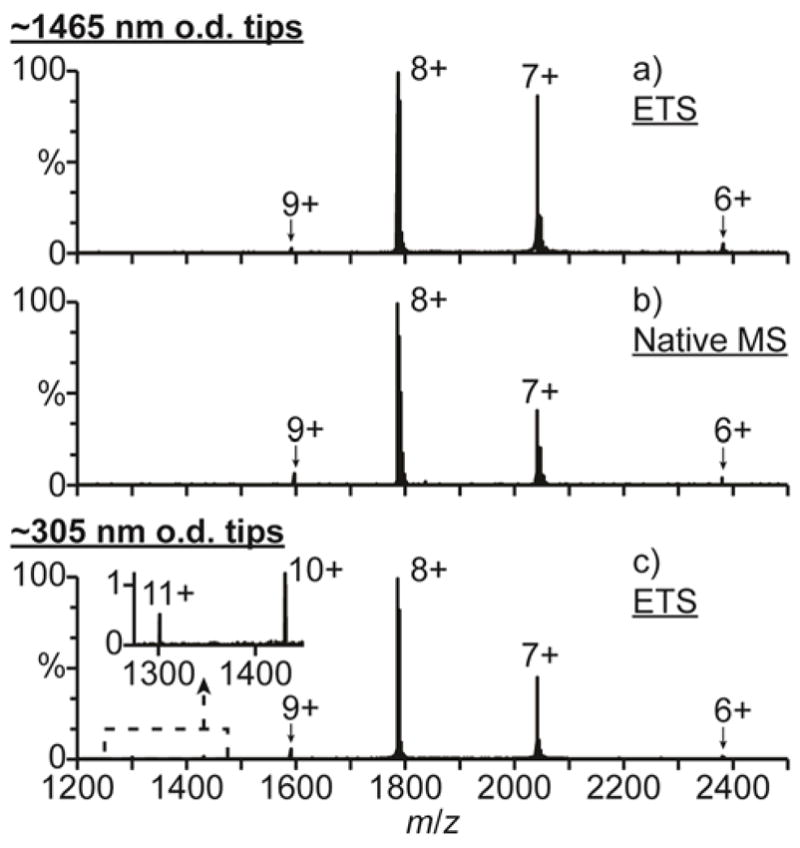
Mass spectra of lysozyme (pI = 11.3) under (a,c) electrothermal supercharging (1050 V spray potential) and (b) native MS (700 V spray potential) conditions in 100 mM aqueous ammonium acetate (pH = 6.7) acquired with (a,b) ~1465 and (c) ~305 nm o.d. tips.
The decreased charging obtained with decreasing tip size for proteins that are negatively charged in solution likely results from the initial size of the nanoESI droplets, which decreases with decreasing tip o.d.51 Smaller droplets have shorter lifetimes,40,43 which reduce the time for protein unfolding to occur in these droplets prior to gaseous ion formation. The electric field at the tip of the emitter increases with decreasing tip size, and the extent of unfolding obtained with ETS generally increases with increasing electric field strength.31 However, the extent of charging resulting directly from ETS decreases with decreasing tip size. This result indicates that the relationship between tip size and the extent of charging resulting from ETS is affected more by changes to the droplet lifetime than by changes to the electric field strength.
Electrothermal Supercharging of Positively Charged Proteins
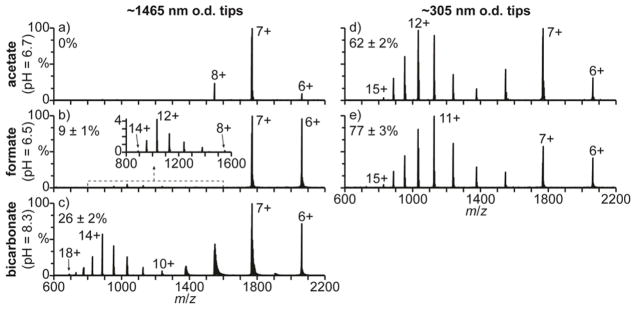
Mass spectra of cyt c in 100 mM aqueous ammonium acetate (pH = 6.7), formate (pH = 6.5), and bicarbonate (pH = 8.3) solutions obtained with ~1465 nm o.d. tips under ETS conditions are shown in Fig. 3a–c, respectively. In 100 mM aqueous salt solutions, cyt c has a native folded conformation between pH = 3 and 7 and is unfolded at pH = 2.52,53 Only the 6–8+ charge states are formed with the ammonium acetate solution (Fig. 3a), consistent with cyt c adopting a folded conformation in solution. The 6–8+ charge states are also formed with this solution under native MS conditions (Fig. S3a), indicating that ETS does not result in measurable unfolding in this experiment. With the ammonium formate (Fig. 3b) and bicarbonate (Fig. 3c) solutions, charge states corresponding to both folded (6–9+) and unfolded (10–18+) conformers are observed with ETS, and the unfolded conformers comprise 9 ± 1% and 26 ± 2% of cyt c in Fig. 3b and 3c, respectively. No charge states greater than 9+ are formed with either of these solutions under native MS conditions (Fig. S3b and S3c, respectively), showing that the high charge states are formed by ETS. The order of effectiveness of these salts at inducing ETS for cyt c is the same as that obtained for hMb with the larger tips and that reported previously.33
Fig. 3.
Mass spectra of cyt c (pI = 10.3) under electrothermal supercharging conditions (1050 V spray potential) in aqueous solutions containing 100 mM (a,d) ammonium acetate (pH = 6.7), (b,e) ammonium formate (pH = 6.5), and (c) ammonium bicarbonate (pH = 8.3) acquired with (a–c) ~1465 and (d,e) ~305 nm o.d. tips. Percentages are the relative abundances of the unfolded fractions (≥10+ charge states) of cyt c.
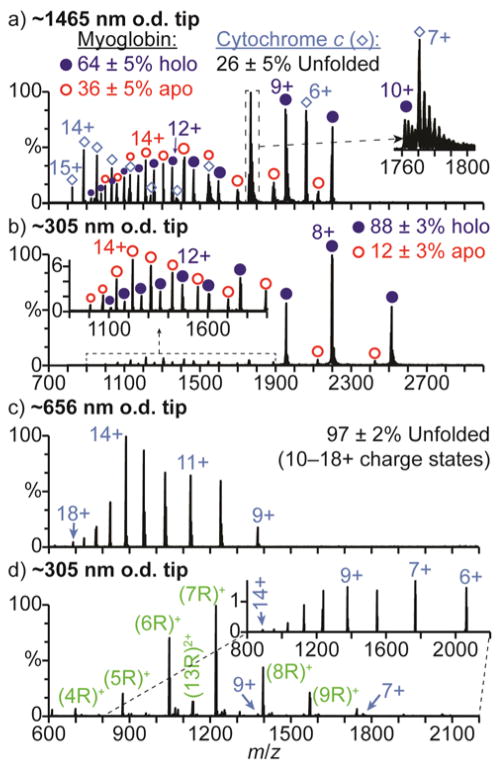
Charge states corresponding to both folded (6–9+) and unfolded (10–15+) conformers are formed by ETS of cyt c in the ammonium acetate and formate solutions with the smaller ~305 nm o.d. tips (Fig. 3d and 3e, respectively). With the ammonium acetate solution (Fig. 3d), 62 ± 2% of cyt c is unfolded, compared to no charge states greater than 8+ formed with the larger ~1465 nm o.d. tips (Fig. 3a). With the ammonium formate solution, ions corresponding to unfolded cyt c are also significantly more abundant with the smaller ~305 nm o.d. tips (77 ± 3%, Fig. 3e) than with the larger ~1465 nm o.d. tips (9 ± 1%, Fig. 3b). Cyt c has a pI = 10.349 and is therefore predominantly positively charged in these respective pH = 6.7 and 6.5 solutions. Therefore, the increased unfolding with decreasing tip size obtained for cyt c in these solutions is consistent with surface-induced unfolding occurring prior to droplet formation, resulting in enhanced charging with ETS in the droplet. With the ammonium bicarbonate solution and the ~305 nm o.d. tips, there is no ion signal for cyt c despite measurable spray current. To confirm that ion formation is occurring, 10 μM hMb was added to this solution. In aqueous solutions at pH = 8.3, hMb (pI = 7.3) is predominantly negatively charged and should not interact with the surfaces of the smaller tips. Results obtained for this spiked solution with ~1465 and ~305 nm o.d. tips are shown in Fig. 4a and 4b, respectively. With the ~1465 nm o.d. tips (Fig. 4a), both cyt c and myoglobin ions are observed. With the smaller ~305 nm o.d. tips (Fig. 4b), only myoglobin ions are observed. These results indicate that cyt c is not being ionized to a measurable extent from the pH = 8.3 ammonium bicarbonate solution with the smaller tips.
Fig. 4.
Mass spectra of cyt c in 100 mM aqueous ammonium bicarbonate solutions (pH = 8.3) acquired with (a) ~1465, (b,d) ~305, and (c) ~656 nm o.d. tips under electrothermal supercharging conditions (1050 V spray potential). The solution used to obtain (a) and (b) contains 10 μM hMb, and the solution used to obtain (d) contains 10 mM arginine. The inset in (d) shows only the distribution of ions corresponding to cyt c for clarity.
NanoESI of cyt c in a 100 mM aqueous ammonium bicarbonate solution (pH = 8.3) under ETS conditions with an intermediate ~656 nm o.d. tip size (Fig. 4c) results in the 9–18+ charge states, indicating that 97 ± 2% of cyt c is unfolded (10–18+ charge states). The relative abundance of the unfolded cyt c conformers obtained with this solution is nearly four times greater with the ~656 nm o.d. tips (97 ± 2%, Fig. 4c) than with the ~1465 nm o.d. tips (26 ± 2%, Fig. 3c). The relative abundance of the unfolded conformers also increases with ammonium acetate (from 0% to 62 ± 2%) and ammonium formate (from 9 ± 1% to 77 ± 3%) when the tip o.d. is reduced from ~1465 to ~305 nm, respectively, but the population of unfolded conformers is greatest with ammonium bicarbonate. These results indicate that more surface interactions resulting in protein unfolding occur with the ammonium bicarbonate solution than with the ammonium acetate and formate solutions. The charge density on the surface of the tips of the nanoESI emitters is at least 3 to 4 fold higher with the pH = 8.3 ammonium bicarbonate solution than with the pH = 6.7 ammonium acetate and pH = 6.5 ammonium formate solutions.42 These results indicate that increasing the charge density on the glass surfaces results in more Coulombic attraction for the positively charged protein molecules, resulting in more surface-induced protein unfolding.
The high charge density on the surface of the tips with the pH = 8.3 ammonium bicarbonate solution and the inability to form cyt c ions from this solution with the small ~305 nm o.d. tips suggests that positively charged protein molecules are adducting to the surfaces of these tips. To provide support for this hypothesis, ions were formed from an aqueous pH = 8.3 solution containing 10 μM cyt c, 100 mM ammonium bicarbonate, and 10 mM arginine using a ~305 nm o.d. tip (Fig. 4d). Arginine is predominantly positively charged in aqueous solutions below pH = 10.8,54 and positive ions can interact with the glass surfaces and reduce the net charge.55 Singly and doubly protonated arginine clusters and the 6–14+ charge states of cyt c are observed. The formation of cyt c ions only upon the addition of arginine is consistent with the positively charged arginine molecules interacting with and reducing the net charge on the surfaces in the tips of these emitters, resulting in less adduction and, thus, measurable ionization of cyt c.
Protein Adduction and Solution Flow Rates
The effects of positively charged protein ions adducting to the surfaces of the emitter tips on solution flow rates during nanoESI was investigated with 100 mM aqueous ammonium bicarbonate solutions (pH = 8.3), each containing a single protein with a pI value either below or above the solution pH (low and high pI proteins, respectively). Flow rates with ~305 nm o.d. tips were obtained for these solutions by measuring the change of mass before and after spraying the solutions for ~20 min (Fig. 5a). The flow rates obtained for the solutions containing low pI proteins (average flow rate = 119 ± 8 nL/s) are significantly higher than those obtained for the solutions containing high pI proteins (average flow rate = 40 ± 9 nL/s), indicating that protein adduction drastically reduces the flow rates of the solutions containing high pI proteins. In order to determine if the flow rates change with time within the 20 min used to obtain these data, the solution spray currents, which reflect solution flow rates,56 were measured (Fig. 5b). Higher spray currents are obtained for the solutions containing low pI proteins (average spray current = 929 ± 66 nA) than for the solutions containing high pI proteins (average spray current = 731 ± 81 nA). These spray currents were obtained immediately after initiating nanoESI and remained nominally constant with time for the ~20 min used to obtain the solution flow rates. These results suggest that the flow rates do not change with time and that for the solutions containing high pI proteins, adduction to the glass surfaces in the tips of the emitters occurs to a significant extent prior to the initiation of nanoESI.
Fig. 5.
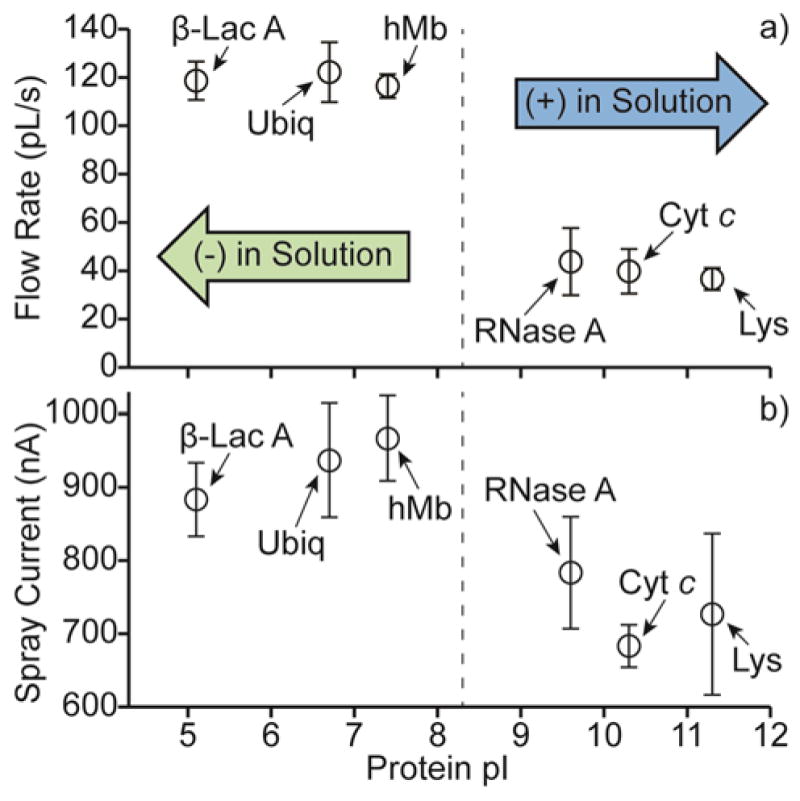
(a) Flow rates and (b) spray currents of 100 mM aqueous ammonium bicarbonate solutions, each containing a single protein, as a function of the protein pI values. Proteins used include β-lactoglobulin A (β-Lac A, pI = 5.1),63 ubiquitin (Ubiq, pI = 6.7),49 holo-myoglobin (hMb, pI = 7.4),48 ribonuclease A (RNase A, pI = 9.6),64 cytochrome c (Cyt c, pI = 10.3),49 and lysozyme (Lys, pI = 11.3).49
The lower flow rates of the solutions containing high pI proteins may be attributed to protein adduction resulting in an obstruction of the emitter tip orifice. The average flow rate of the solutions containing high pI proteins (40 ± 9 nL/s) is about one-third that of the solutions containing low pI proteins (119 ± 8 nL/s). Solution flow rates in nanoESI are directly proportional to the emitter tip diameter36,40 and are thus proportional to the square root of the emitter tip orifice area. Therefore, protein molecules would need to occupy a cross sectional area equal to about 81% of the orifice area in order to reduce the solution flow rate by about two-thirds (67%). The orifice area of a single barrel of a ~305 nm o.d. theta-glass emitter tip is ~4820 nm2. This value was estimated as the area of half of an ellipse with diameters equal to the i.d. of the tips perpendicular to and parallel to the inner divider less the area occupied by the inner divider. To reduce this orifice area by about 81% would require a ~21 nm thick obstruction along the surface of the tips of the emitters. A single folded cyt c molecule has a diameter of ~4.1 nm, estimated as the maximum diameter of the protein crystal structure of horse heart cyt c (PDB code 1HRC).57 The ~21 nm obstruction thickness and the ~4.1 nm diameter of cyt c indicate that ~5 layers of cyt c are required to reduce the solution flow rate by about two-thirds if the protein remains folded. The length of a fully extended cyt c molecule is about 40 nm (estimated from the average length of an individual amino acid in a fully extended protein conformation, between 0.34 and 0.40 nm,58 and the 104 amino acids in cyt c). The length of a fully extended cyt c molecule is greater than the ~21 nm obstruction thickness required to reduce the solution flow rate by about two-thirds. Thus, even a single layer of adducted protein molecules, which are partially or extensively unfolded and extend into the solution, is sufficient to reduce the solution flow rate by about two-thirds.
Protein adduction to the surface of the tips may also result in a change to the solution conductivity, and ESI solution flow rates increase with increasing solution conductivities.56,59 The conductivity of ≥50 mM aqueous salt solutions decreases with increasing protein concentration.60,61 Adduction of proteins to the glass surfaces results in a decrease in the concentration of proteins in solution, which should increase the solution conductivity and flow rate. However, when protein adduction occurs, lower flow rates are obtained (Fig. 5a). These results indicate that any possible changes to the solution flow rate resulting from changes to the solution conductivity are less significant than those resulting from obstructing the emitter tip orifice.
Electrothermal Supercharging of Negatively Charged Proteins
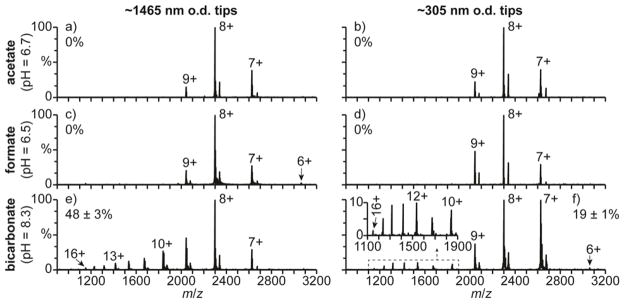
NanoESI of β-lactoglobulin A (β-lac A) in a 100 mM aqueous ammonium acetate solution (pH = 6.7) under ETS conditions results in the formation of the 7–9+ charge states with both the ~1465 and the ~305 nm o.d. tips (Fig. 6a and 5b, respectively). β-lac A has a native conformation between pH = 2.0 and 6.2 and has a slightly unfolded globular conformation at pH = 7.5.62 The results in Fig. 6a and 5b are consistent with β-lac A adopting a folded conformation in solution. Charge states consistent with a folded confirmation (6–9+) are also formed from a 100 mM aqueous ammonium formate solution (pH = 6.5) with the ~1465 and ~305 nm o.d. tips (Fig. 6c and 5d, respectively). The 6–9+ charge states are also formed from these solutions under native MS conditions (Fig. S4a and S4b), indicating that ETS does not result in measurable unfolding in these experiments. Results obtained for β-lac A in a 100 mM aquoeus ammonium bicarbonate solution with ~1465 and ~305 nm o.d. tips under ETS conditions are shown in Fig. 6e and 6f, respectively. With the ~1465 nm o.d. tips (Fig. 6e), charge states corresponding to both folded (7–9+) and unfolded (10–16+) conformers are observed, and the unfolded conformers comprise 48 ± 3% of the population. No charge states greater than 9+ are formed with this solution under native MS conditions (Fig. S4c), indicating that the high charge states obtained with the high spray potential result from ETS. With the smaller ~305 nm o.d. tips and ETS conditions (Fig. 6f), charge states corresponding to both folded (6–9+) and unfolded (10–16+) conformers are again observed, but only 19 ± 1% of the population is unfolded. The relative abundance of the unfolded β-lac A conformer is more than two times less with this tip size than with the larger tips under ETS conditions (48 ± 3%, Fig. 6e), indicating that reducing the tip size results in less unfolding with this solution.
Fig. 6.
Mass spectra of β-lac A (pI = 5.1) under electrothermal supercharging conditions (1050 V spray potential) in aqueous solutions containing 100 mM (a,b) ammonium acetate (pH = 6.7), (c,d) ammonium formate (pH = 6.5), and (e,f) ammonium bicarbonate (pH = 8.3) acquired with (a,c,e) ~1465 and (b,d,f) ~305 nm o.d. tips. Percentages are the relative abundances of the unfolded fractions (≥10+ charge states) of β-lac A.
β-lac A has a pI = 5.163 and is therefore predominantly negatively charged in the pH = 6.7 ammonium acetate, pH = 6.5 ammonium formate, and pH = 8.3 ammonium bicarbonate solutions. Therefore, surface-induced unfolding of β-lac A is not likely to occur in the tips of the emitters prior to nanoESI. This result is consistent with the decreased charging obtained with decreasing tip size for β-lac A in the ammonium bicarbonate solution. Because β-lac A has the same charge in the ammonium acetate, formate, and bicarbonate solutions, the order of effectiveness of these solutions at inducing ETS does not change with tip size and is the same as that obtained for hMb and cyt c with the larger tips and that reported previously.33
Conclusions
The effects of emitter tip size, protein isoelectric point, and buffer identity on the extent of charging obtained with ETS was investigated. More charging is obtained with smaller tip sizes for proteins that are positively charged in solution but not for proteins that are negatively charged in solution. There is also more charging and loss of the heme group for myoglobin with smaller emitter tips. These results suggest that for positively charged proteins, Coulombic attraction to the negatively charged surfaces in the tips of the emitters destabilizes the folded protein conformation prior to nanoESI, resulting in enhanced charging from ETS occurring in the droplet prior to gaseous ion formation. The extent to which charging is enhanced increases with increasing solution pH. The charge density on the surface of the emitters increases with increasing solution pH, resulting in more protein-surface interactions that cause destabilization of the folded form of the proteins and unfolding prior to nanoESI. Significant protein adduction to the emitter tip surface can occur, which reduces nanoESI solution flow rates and reduces or prevents measurable ionization from occurring at very small tip sizes. These results clearly show that the tip size, the solution pH, and the net charge of the protein in solution can affect the extent of charging in ETS.
For proteins that are negatively charged in solution, there is no Coulombic attraction to the negatively charged glass surfaces and slightly less charging occurs with smaller tips. The lower charging at small tip sizes is likely due to smaller ESI droplets with decreasing tip size.51 Smaller droplets have shorter lifetimes,40 and there is less time for protein unfolding to occur during ETS prior to gaseous ion formation. It may be possible to obtain increased charging with decreased tip size for proteins that are negatively charged in solution by using emitters with positively charged surfaces. The glass surfaces of borosilicate glass emitters could be functionalized with positive charge carriers, or emitters could be made from materials that have positively charged surfaces in aqueous solutions, such as silicon nitride.
Supplementary Material
Acknowledgments
The authors thank the Robert D. Ogg Electron Microscope Lab at the University of California, Berkeley for use of the Hitachi TM-1000 scanning electron microscope and the National Institutes of Health for funding (R01GM097357).
Footnotes
Electronic Supplementary Information
Electron micrographs of the tips of the emitters and mass spectra of hMb, cyt c, and β-lac A in 100 mM aqueous ammonium acetate, formate, and bicarbonate solutions acquired under native MS conditions.
References
- 1.Kruppa G, Schoeniger J, Young M. Rapid Commun Mass Spectrom. 2003;17:155–162. doi: 10.1002/rcm.885. [DOI] [PubMed] [Google Scholar]
- 2.Aebersold R, Mann M. Nature. 2003;422:198–207. doi: 10.1038/nature01511. [DOI] [PubMed] [Google Scholar]
- 3.Pan J, Borchers CH. Proteomics. 2013;13:974–981. doi: 10.1002/pmic.201200246. [DOI] [PubMed] [Google Scholar]
- 4.Benesch JL, Robinson CV. Curr Opin Struct Biol. 2006;16:245–251. doi: 10.1016/j.sbi.2006.03.009. [DOI] [PubMed] [Google Scholar]
- 5.Heck AJR. Nat Methods. 2008;5:927–933. doi: 10.1038/nmeth.1265. [DOI] [PubMed] [Google Scholar]
- 6.Rostom AA, Tame JRH, Ladbury JE, Robinson CV. J Mol Biol. 2000;296:269–279. doi: 10.1006/jmbi.1999.3431. [DOI] [PubMed] [Google Scholar]
- 7.Shoemaker GK, Soya N, Palcic MM, Klassen JS. Glycobiology. 2008;18:587–592. doi: 10.1093/glycob/cwn043. [DOI] [PubMed] [Google Scholar]
- 8.Esteban O, Bernal RA, Donohoe M, Videler H, Sharon M, Robinson CV, Stock D. J Biol Chem. 2008;283:2595–2603. doi: 10.1074/jbc.M704941200. [DOI] [PubMed] [Google Scholar]
- 9.Lorenzen K, Olia AS, Uetrecht C, Cingolani G, Heck AJR. J Mol Biol. 2008;379:385–396. doi: 10.1016/j.jmb.2008.02.017. [DOI] [PMC free article] [PubMed] [Google Scholar]
- 10.Painter AJ, Jaya N, Basha E, Vierling E, Robinson CV, Benesch JLP. Chem Biol. 2008;15:246–253. doi: 10.1016/j.chembiol.2008.01.009. [DOI] [PubMed] [Google Scholar]
- 11.Kintzer AF, Sterling HJ, Tang II, Abdul-Gader A, Miles AJ, Wallace BA, Williams ER, Krantz BA. J Mol Biol. 2010;399:741–758. doi: 10.1016/j.jmb.2010.04.041. [DOI] [PMC free article] [PubMed] [Google Scholar]
- 12.Marshall AG, Hendrickson CL, Jackson GS. Mass Spectrom Rev. 1998;17:1–35. doi: 10.1002/(SICI)1098-2787(1998)17:1<1::AID-MAS1>3.0.CO;2-K. [DOI] [PubMed] [Google Scholar]
- 13.Zubarev RA, Makarov A. Anal Chem. 2013;85:5288–5296. doi: 10.1021/ac4001223. [DOI] [PubMed] [Google Scholar]
- 14.Iavarone AT, Williams ER. Anal Chem. 2003;75:4525–4533. doi: 10.1021/ac034144i. [DOI] [PMC free article] [PubMed] [Google Scholar]
- 15.Iavarone AT, Paech K, Williams ER. Anal Chem. 2004;76:2231–2238. doi: 10.1021/ac035431p. [DOI] [PMC free article] [PubMed] [Google Scholar]
- 16.Madsen JA, Brodbelt JS. J Am Soc Mass Spectrom. 2009;20:349–358. doi: 10.1016/j.jasms.2008.10.018. [DOI] [PubMed] [Google Scholar]
- 17.Pan P, Gunawardena HP, Xia Y, McLuckey SA. Anal Chem. 2004;76:1165–1174. doi: 10.1021/ac035209k. [DOI] [PubMed] [Google Scholar]
- 18.Flick TG, Cassou CA, Chang TM, Williams ER. Anal Chem. 2012;84:7511–7517. doi: 10.1021/ac301629s. [DOI] [PMC free article] [PubMed] [Google Scholar]
- 19.McKay AR, Ruotolo BT, Ilag LL, Robinson CV. J Am Chem Soc. 2006;128:11433–11442. doi: 10.1021/ja061468q. [DOI] [PubMed] [Google Scholar]
- 20.Lomeli SH, Yin S, Loo RRO, Loo JA. J Am Soc Mass Spectrom. 2009;20:593–596. doi: 10.1016/j.jasms.2008.11.013. [DOI] [PMC free article] [PubMed] [Google Scholar]
- 21.Sterling HJ, Williams ER. Anal Chem. 2010;82:9050–9057. doi: 10.1021/ac101957x. [DOI] [PMC free article] [PubMed] [Google Scholar]
- 22.Hogan CJ, Loo RRO, Loo JA, de la Mora JF. PCCP. 2010;12:13476–13483. doi: 10.1039/c0cp01208d. [DOI] [PubMed] [Google Scholar]
- 23.Sterling HJ, Cassou CA, Trnka MJ, Burlingame AL, Krantz BA, Williams ER. PCCP. 2011;13:18288–18296. doi: 10.1039/c1cp20277d. [DOI] [PMC free article] [PubMed] [Google Scholar]
- 24.Yin S, Loo JA. Int J Mass Spectrom. 2011;300:118–122. doi: 10.1016/j.ijms.2010.06.032. [DOI] [PMC free article] [PubMed] [Google Scholar]
- 25.Sterling HJ, Kintzer AF, Feld GK, Cassou CA, Krantz BA, Williams ER. J Am Soc Mass Spectrom. 2012;23:191–200. doi: 10.1007/s13361-011-0301-y. [DOI] [PMC free article] [PubMed] [Google Scholar]
- 26.Going CC, Williams ER. Anal Chem. 2015;87:3973–3980. doi: 10.1021/acs.analchem.5b00071. [DOI] [PubMed] [Google Scholar]
- 27.Metwally H, McAllister RG, Popa V, Konermann L. Anal Chem. 2016;88:5345–5354. doi: 10.1021/acs.analchem.6b00650. [DOI] [PubMed] [Google Scholar]
- 28.Flick TG, Williams ER. J Am Soc Mass Spectrom. 2012;23:1885–1895. doi: 10.1007/s13361-012-0463-2. [DOI] [PMC free article] [PubMed] [Google Scholar]
- 29.Kharlamova A, Prentice BM, Huang T, McLuckey SA. Anal Chem. 2010;82:7422–7429. doi: 10.1021/ac101578q. [DOI] [PMC free article] [PubMed] [Google Scholar]
- 30.Kharlamova A, McLuckey SA. Anal Chem. 2011;83:431–437. doi: 10.1021/ac1027319. [DOI] [PMC free article] [PubMed] [Google Scholar]
- 31.Sterling HJ, Cassou CA, Susa AC, Williams ER. Anal Chem. 2012;84:3795–3801. doi: 10.1021/ac300468a. [DOI] [PMC free article] [PubMed] [Google Scholar]
- 32.Hedges JB, Vahidi S, Yue X, Konermann L. Anal Chem. 2013;85:6469–6476. doi: 10.1021/ac401020s. [DOI] [PubMed] [Google Scholar]
- 33.Cassou CA, Williams ER. Anal Chem. 2014;86:1640–1647. doi: 10.1021/ac403398j. [DOI] [PMC free article] [PubMed] [Google Scholar]
- 34.Going CC, Xia Z, Williams ER. J Am Soc Mass Spectrom. 2016;27:1019–1027. doi: 10.1007/s13361-016-1350-z. [DOI] [PMC free article] [PubMed] [Google Scholar]
- 35.Cassou CA, Sterling HJ, Susa AC, Williams ER. Anal Chem. 2013;85:138–146. doi: 10.1021/ac302256d. [DOI] [PMC free article] [PubMed] [Google Scholar]
- 36.Li Y, Cole RB. Anal Chem. 2003;75:5739–5746. doi: 10.1021/ac0301402. [DOI] [PubMed] [Google Scholar]
- 37.Yuill EM, Sa N, Ray SJ, Hieftje GM, Baker LA. Anal Chem. 2013;85:8498–8502. doi: 10.1021/ac402214g. [DOI] [PubMed] [Google Scholar]
- 38.Ek P, Sjodahl J, Roeraade J. Rapid Commun Mass Spectrom. 2006;20:3176–3182. doi: 10.1002/rcm.2710. [DOI] [PubMed] [Google Scholar]
- 39.Ek P, Schonberg T, Sjodahl J, Jacksen J, Vieider C, Emmer A, Roeraade J. J Mass Spectrom. 2009;44:171–181. doi: 10.1002/jms.1478. [DOI] [PubMed] [Google Scholar]
- 40.Mortensen DN, Williams ER. J Am Chem Soc. 2016;138:3453–3460. doi: 10.1021/jacs.5b13081. [DOI] [PubMed] [Google Scholar]
- 41.Mortensen DN, Williams ER. Anal Chem. 2016 submitted for publication. [Google Scholar]
- 42.Behrens SH, Grier DG. J Chem Phys. 2001;115:6716–6721. [Google Scholar]
- 43.Grimm RL, Beauchamp JL. Anal Chem. 2002;74:6291–6297. doi: 10.1021/ac025889b. [DOI] [PubMed] [Google Scholar]
- 44.Jurchen JC, Williams ER. J Am Chem Soc. 2003;125:2817–2826. doi: 10.1021/ja0211508. [DOI] [PMC free article] [PubMed] [Google Scholar]
- 45.Blakney GT, Hendrickson CL, Marshall AG. Int J Mass Spectrom. 2011;306:246–252. doi: 10.1016/j.ijms.2011.08.006. [DOI] [PMC free article] [PubMed] [Google Scholar]
- 46.Sage JT, Morikis D, Champion PM. Biochemistry. 1991;30:1227–1237. doi: 10.1021/bi00219a010. [DOI] [PubMed] [Google Scholar]
- 47.Griko YV, Privalov PL, Venyaminov SY, Kutyshenko VP. J Mol Biol. 1988;202:127–138. doi: 10.1016/0022-2836(88)90525-6. [DOI] [PubMed] [Google Scholar]
- 48.Bergers JJ, Vingerhoeds MH, Vanbloois L, Herron JN, Janssen LHM, Fischer MJE, Crommelin DJA. Biochemistry. 1993;32:4641–4649. doi: 10.1021/bi00068a023. [DOI] [PubMed] [Google Scholar]
- 49.Hemdan ES, Zhao YJ, Sulkowski E, Porath J. Proc Natl Acad Sci. 1989;86:1811–1815. doi: 10.1073/pnas.86.6.1811. [DOI] [PMC free article] [PubMed] [Google Scholar]
- 50.Bonincontro A, De Francesco A, Onori G. Colloids Surf B. 1998;12:1–5. [Google Scholar]
- 51.Schmidt A, Karas M, Dülcks T. J Am Soc Mass Spectrom. 2003;14:492–500. doi: 10.1016/S1044-0305(03)00128-4. [DOI] [PubMed] [Google Scholar]
- 52.Shastry RMC, Luck SD, Roder H. Biophys J. 1998;74:2714–2721. doi: 10.1016/S0006-3495(98)77977-9. [DOI] [PMC free article] [PubMed] [Google Scholar]
- 53.Konno T. Protein Sci. 1998;7:975–982. doi: 10.1002/pro.5560070415. [DOI] [PMC free article] [PubMed] [Google Scholar]
- 54.Weast RC, editor. CRC Handbook of Chemistry and Physics. 55. CRC Press; Boca Raton, FL: 1974. [Google Scholar]
- 55.Stein D, Kruithof M, Dekker C. Phys Rev Lett. 2004;93:035901. doi: 10.1103/PhysRevLett.93.035901. [DOI] [PubMed] [Google Scholar]
- 56.Gañán-Calvo AM, Dávila J, Barrero A. J Aerosol Sci. 1997;28:249–275. [Google Scholar]
- 57.Bushnell GW, Louie GV, Brayer GD. J Mol Biol. 1990;214:585–595. doi: 10.1016/0022-2836(90)90200-6. [DOI] [PubMed] [Google Scholar]
- 58.Ainavarapu SRK, Brujic J, Huang HH, Wiita AP, Lu H, Li L, Walther KA, Carrion-Vazquez M, Li H, Fernandez JM. Biophys J. 2007;92:225–233. doi: 10.1529/biophysj.106.091561. [DOI] [PMC free article] [PubMed] [Google Scholar]
- 59.Tang K, Gomez A. J Colloid Interface Sci. 1996;184:500–511. doi: 10.1006/jcis.1996.0645. [DOI] [PubMed] [Google Scholar]
- 60.Palmer WW, Atchley DW, Loeb RF. J Gen Physiol. 1922;4:585–589. doi: 10.1085/jgp.4.5.585. [DOI] [PMC free article] [PubMed] [Google Scholar]
- 61.Atchley DW, Nichols EG. J Biol Chem. 1925;65:729–734. [Google Scholar]
- 62.Kuwata K, Hoshino M, Forge V, Era S, Batt CA, Goto Y. Protein Sci. 1999;8:2541–2545. doi: 10.1110/ps.8.11.2541. [DOI] [PMC free article] [PubMed] [Google Scholar]
- 63.Kuroda Y, Yukinaga H, Kitano M, Noguchi T, Nemati M, Shibukawa A, Nakagawa T, Matsuzaki K. J Pharm Biomed Anal. 2005;37:423–428. doi: 10.1016/j.jpba.2004.11.025. [DOI] [PubMed] [Google Scholar]
- 64.Liu Q, Shi J, Sun J, Wang T, Zeng L, Jiang G. Angew Chem Int Ed. 2011;50:5913–5917. doi: 10.1002/anie.201007138. [DOI] [PubMed] [Google Scholar]
Associated Data
This section collects any data citations, data availability statements, or supplementary materials included in this article.


