

Abstract
Women who inject drugs have been shown to have higher incidence of HIV and risk behaviors than men, but there are conflicting reports about hepatitis C virus (HCV) incidence. We systematically reviewed the literature to examine the female to male (F:M) HCV incidence in female and male persons who inject drugs (PWID), and also to explore the heterogeneity (i.e., methodological diversity) in these differences. We searched PubMed and EMBASE for studies published between 1989 to March 2015 for research that reported incidence of HCV infection by sex or HCV incidence F:M rate ratio. A total of 28 studies, which enrolled 9,325 PWID were included. The overall pooled HCV incidence rate (per 100 person-years observation) was 20.36 (95%CI: 13.86, 29.90) and 15.20 (95%CI: 10.52, 21.97) in females and males, respectively. F:M ratio was 1.36:1 (95%CI: 1.13,1.64) with substantial heterogeneity (I-squared = 71.6%). The F:M ratio varied by geographic location: from 4.0 (95%CI: 1.80, 8.89) in China to 1.17 (95%CI: 0.95,1.43) in the U.S. In studies which recruited participants from community settings, the F:M ratio was 1.24 (95%CI: 1.03,1.48), which was lower than that reported in the clinical settings (1.72, 95%CI: 0.86,3.45). The number of studies included provided sufficient statistical power to detect sex differences in this analysis. Our findings raise questions and concerns regarding sex differences with respect to the risk of HCV. Both behavioral and biological studies are needed to investigate causes and potential mechanisms as well as sex-specific prevention approaches to HCV infection.
Keywords: Females, sex differences, Hepatitis C, Incidence, Systematic Review, Meta analysis
INTRODUCTION
Estimates of the global prevalence of hepatitis C virus (HCV) infection range from 1.6% to 2.8%, corresponding to between 80 to185 million people (1–3). The morbidity and mortality associated with this widespread infection is a major global health burden. Persistent HCV infection can lead to up to 0.5 million deaths every year (4) Recent studies showed mortality rate due to viral hepatitis increased in the past two decades and HCV was the seventh leading cause of death worldwide in 2013, compared with tenth in 1990 (5). Disability-adjusted life-years (DALYs) for HCV also have more than doubled since 1990. Compared with other viral hepatitis, HCV is the only infection, which is associated with increasing age-specific DALYs rates (5). Parenteral exposures, especially injection drug use accounts for the majority of HCV infections (6). In the United States (U.S.) 2.6% (95% confidence interval (95%CI): 1.8%–3.3%) of the population aged 13 years or older have reported any lifetime injection drug use (7). The rate of current illicit drug use is higher for males than for females and males are more likely than females to be current users of several different illicit drugs. As a result, more numbers of males are infected than females (7). However, several studies have shown that injection practices of women, including higher rates of equipment and syringe sharing, women using injecting equipment following their male partners, and being injected by others may put them at higher risk (8–12). In addition, women who inject drugs have been shown to have higher incidence of HIV and higher injection related risk behaviors (13–16).
HCV surveillance data generally show lower HCV detection rates among females compared to men. Viral hepatitis statistics and surveillance in 2013 in the U.S. reported 0.5 and 0.7 cases/100,00 among females and males respectively (17). HCV surveillance data in European Centers of Disease Prevention reported the male to female ratio of 1.9 to 1 in 2013 (18). In Canada, from 1998 to 2004 the enhanced Hepatitis Strain Surveillance System found HCV detection rates per 100,000 people were 1.31 times (95% CI 1.09,1.58) higher among males than among females, and sex-specific rate for HCV detection showed the same trend over the time (19). The literature on HCV prevalence, does not suggest differences between women and men. Hagan et al (20) evaluated 58 studies that reported HCV prevalence in relation to biological sex. The crude and weighted odds ratio (OR) for the difference in HCV prevalence between males and females was 0.95 and 1.0 respectively (95%CI for weighted OR: 0.94,1.07). Both surveillance data and studies of prevalence however are limited in the capacity of informing the overall burden and incidence of HCV due to challenges in case detection associated with asymptomatic infection, low reporting overall, and resource limitations. (21)
For these reasons, prospective cohort studies, which assess newly or recently acquired infections systematically offer the most reliable information on incidence of HCV infection (22). HCV differences by sex in longitudinal studies of people who inject drugs (PWID) appear to be inconsistent upon brief review. In a retrospective cohort study, in Sydney, Australia, Micallef et al, (23) reported that women were less likely than men to become infected with HCV whereas Maher et al, (24) in a prospective study found that women were significantly more likely to become infected. Two prospective studies, in Canada and Switzerland in PWID found non-significant differences by sex (25, 26). Other reports suggest a significantly higher incidence among female PWID compared to males, including in San Francisco, The Netherlands and China (12, 27, 28). These discrepancies point to the need for more systematic analysis of studies of HCV infection differences between females and males who inject drugs.
We systematically searched the literature to explore the heterogeneity (i.e., methodological diversity) reported in HCV incidence rate between female and male PWID. We conducted a meta-analysis including studies that reported HCV incidence by sex or HCV incidence F:M rate ratio by countries/regions, screening test (anti-HCV and/or RNA), nature of data collection (retrospective vs. prospective), recruitment setting [community, prison, clinic (which included drug treatment or other health care setting), and ‘multiple’ setting], type of analysis model and reported effect size (whether adjusted for covariates or not).
METHODS
Search strategies and study identification
Methods used to search and identify the target articles were based on the methodology described by Stern et al (29). Briefly, three collaborators worked closely to assess literature review, data extraction and quality of included studies. We conducted a comprehensive literature search in PubMed and EMBASE (in English language), using the following search terms: (hepatitis C OR HCV) AND (intravenous drug OR drug misuse OR drug addict OR injecting drug use OR drug abuse OR IDU OR PWID) AND (incidence OR seroincidence OR seroconversion) AND “name of country”. Reference lists of obtained articles were searched as well. The search was limited to the period of 1989 to 2015.
We retrieved and/or requested all the required full text from the library of the Icahn School of Medicine at Mount Sinai. We included longitudinal studies, including intervention studies that reported incidence of HCV infection in both female and male PWID. To be eligible for inclusion in this project, studies must have reported crude and/or adjusted HCV incidence rates by sex or female:male (F:M) rate ratio (Hazard Ratio, Rate ratio or Risk Ratio). We excluded studies that assessed HCV incidence in hemodialysis patients, blood donors, post-transfusion, mixed injection and non-injecting populations (with unstratified estimates), and non-injecting populations including studies that reported incidence in non-injecting men who have-sex with men (MSM).
A worksheet was developed to extract data on recruitment years and location, nature of data collection (prospective vs. retrospective), study recruitment setting, type of analysis model used to reported effect size, and screening test used to identify incident HCV [either by antibodies to HCV (anti-HCV) indicating exposure, or actual infection status (RNA)] and by sex, we extracted the data on cohort size, person-years of follow up, incidence rate (with 95%CI), and F:M ratio (crude and adjusted effect size). In order to assess the quality of data reporting (selection bias, misclassification of exposure or outcome, and confounding due to non-comparability of the groups being compared), we used Newcastle-Ottawa Scale (NOS) for cohort studies (30).
Data synthesis and analysis
We extracted or calculated the crude and adjusted F:M ratio within the studies (Table 1 and S.3). If the F:M rate ratio of HCV incidence was not reported in the article, we computed the effect size and its 95%CI in three ways: (1) If the number of cases and person-years observation (PYO) were reported by sex, we used the Incidence Rate Ratio calculator of Stata 13.1 (StataCorp, LP, College Station, Texas, USA) to compute 95%CI; (2) If the number of cases and total number of subjects were reported, we used the Cohort Study Risk Ratio calculator of Stata 13.1 to compute RR and 95%CI for analysis; and (3) for three studies, Roy (26), Micallef (23) and Broers (25), we obtained the 95%CI from a P value (31).
Table 1.
Characteristics of included articles and summary data of female and male HCV incidence in PWID populations.
| 1st Author Published Year (Jiurnal¶) |
Location, Study setting (Recruitment periods) |
Total Cohort Size (N) (Female N, Male N) |
Female Incidence per 100PYO (95%CI) |
Male Incidence per 100PYO (95%CI) |
F:M IRR crude (95%CI)/Type of analysis model |
F:M IRR adjusted (95%CI)/Type |
Selected F:M IRR (95%CI)/Type |
|---|---|---|---|---|---|---|---|
| Iversen 2013 (Am J Public Health) | Australia, Community (1995–2010) | 724 (269, 453) | 18.1 (14.3, 23) | 16.5 (13.7, 19.8) | 1.01 (0.746, 1.37)/HRˆ | 1.01 (0.746, 1.37)/HR | |
| Snow 2014 (BMC Public Health) | Australia, Queensland, Prisoner (1999–2013) | 735 (169, 566) | 9.8 (7.33, 13.12)$ | 5.74 (4.69, 7.02)$ | 1.65 (1.14, 2.39)/HR | 1.36 (0.91, 2.03)/AHR | 1.36 (0.91, 2.03)/AHR |
| Teutsch 2010 (BMC Public Health) | Australia, New South Wales, Prisoner (2005–2009) | 488 (170, 318) | 42 (30.4, 56.5) | 26.2 (19.5, 34.4) | 1.6 (1.1, 2.4)/IRR |
NA |
1.6 (1.1, 2.4)/IRR |
| White 2014 (Vaccine) | Australia, New South Wales, Community 2008–2011 | 129 (33, 96) | 12.9 (6.7, 27.2) | 6.2 (3.3, 11.5) | 2.04 (0.84, 4.92)/RR*ˆ |
NA |
2.04 (0.84, 4.92)/RR* |
| Micallef 2007 (J Viral Hepat) | Australia, New South Wales, Sydney, Clinical setting 93–2002 | 423 (253, 166) | 15.3 (11.9, 19.6) | 19 (14.4, 25) | 0.72 (0.59, 1.27)/IRRˆ |
NA |
0.72 (0.59, 1.27)/IRR |
| Maher 2006 (Addiction) | Australia, New South Wales, Sydney, Multiple setting 1999–2002 | 368 (140, 228) | 42.4 (30.6, 58.8) | 23.5 (16.6, 33.2) | 1.75 (1.09, 2.86)/HR | 1.66 (0.99, 2.77)/AHR | 1.66 (0.99, 2.77)/AHR |
| Aitken 2008 (Hepatology) | Australia, Victoria, Melbourne, Community 2005–2007 | 55 (19, 36) |
NA |
NA |
1.35 (0.66, 2.70)/HRˆ |
NA |
1.35 (0.66, 2.70)/HR |
| Crofts 1997 (Addiction) | Australia, Victoria, Clinical setting 1991–1995 | 73 (35, 38) |
NA |
NA |
1.21 (0.56, 2.62)/RR*ˆ |
NA |
1.21 (0.56, 2.62)/RR* |
| Grebely 2014 (PLoS One) | Canada, British Columbia, Vancouver, Community 1996–2012 | 364 (115, 249) |
NA |
NA |
1.42 (0.95, 2.1)/HR | 1.42 (0.95–2.1)/AHR | 1.42 (0.95, 2.1)/AHR |
| Puri 2014 (J Adolesc Health) | Canada, British Columbia, Vancouver, Community 2005–2011 | 512 (151, 361) |
NA |
NA |
2.1 (1.24, 3.56)/HR | 2.01 (1.18, 3.44)/AHR | 2.01 (1.18, 3.44)/AHR |
| Spittal 2012 (BMC Public Health) | Canada, British Columbia, Vancouver and Prince George, Community 2003–2009 | 148 (79, 69) |
NA |
NA |
1.43 (0.79, 2.6)/HR |
NA |
1.43 (0.79, 2.6)/HR |
| Bruneau 2012 (Addiction) | Canada, Quebec, Montreal, Community 2004–2009 | 246 (45, 201) | 13.45 (7.29, 22.86) | 20.49 (16.13, 25.69) | 0.7 (0.38, 1.29)/HR | 0.9 (0.46, 1.74)/AHR | 0.9 (0.46, 1.74)/AHR |
| Roy 2007 (Int J STD AIDS) | Canada, Quebec, Community 1997–2003 | 359 (97, 262) |
NA |
NA |
1.44 (0.84, 1.63)/HR |
NA |
1.44 (0.84, 1.63)/HR |
| Ruan 2007 (AIDS) | China, Community 2002 | 86 (11, 75) | 76.3 (54.49, 106.94)$ | 29.8 (22.91, 38.76)$ | 2.6 (1.2, 5.5)/IRR | 4 (1.8, 8.9)/AIRR | 4 (1.8, 8.9)/AIRR |
| Lucidarme 2004 (Epidemiol Infect) | France, Clinical setting 1999–2000 | 165 (29, 136) | 16.67 (2–31) | 7.41 (3–12) | 2.38 (0.82, 6.667)/HRˆ | 2 (0.63, 6.67)/AHRˆ | 2 (0.63, 6.67)/AHR |
| Smyth 2003 (J Epidemiol Community Health) | Ireland, Dublin, Clinical setting 1992–1998 | 100 (34, 66) | 60 (38, 89) | 70 (51, 94) | 0.85 (0.49, 1.44)/IRRˆ |
NA |
0.85 (0.49, 1.44)/IRR |
| Rezza 1996 (Scand J Infect Dis) | Italy, Naples, Clinical setting 1991–1993 | 106 (3, 103) |
NA |
NA |
5.72 (3.76, 8.71)/RR*ˆ |
NA |
5.72 (3.76, 8.71)/RR* |
| van de Laar 2009 (J Hepatol) | Netherlands, Amsterdam, Clinical setting 1985–2005 | 456 (137, 319) |
NA |
NA |
1.71 (1.06, 2.76)/RR*ˆ |
NA |
1.71 (1.06, 2.76)/RR* |
| Brunton 2000 (N Z Med J) | New Zealand, Community 1994–1996 | 39 (16, 23) |
NA |
NA |
0.72 (0.21, 2.46)/RR*ˆ |
NA |
0.72 (0.21, 2.46)/RR* |
| Broers 1998 (AIDS) | Switzerland, Geneva, Clinical setting 1988–1995 | 576 (130, 446) | 9.6 (4.49, 20.54)$ | 2.7 (1.23, 5.94)$ | 3.56 (0.62, 4.84)/IRRˆ |
NA |
3.56 (0.62, 4.84)/IRR |
| Craine 2009 (Epidemiol Infect) | UK, South Wales, Multiple setting 2004–2006 | 286 (83, 203) | 6 (1.9, 14) | 5.9 (3, 10.3) | 1.02 (0.36, 2.88)/IRR |
NA |
1.02 (0.36, 2.88)/IRR |
| Hagan 2010 (J Infect Dis) | USA, 5 cities, Community 2002–2004 | 483 (321, 159) | 12.94 (7.66, 21.85) | 19.61 (14.44, 26.63) | 0.75 (0.58, 1.78)/HR |
NA |
0.75 (0.58, 1.78)/HR |
| Thorpe 2002 (Am J Epidemiol) | USA, Illinois, Community 1997–1999 | 353 (128, 225) |
NA |
NA |
1 (0.47, 2.09)/HR |
NA |
1 (0.47, 2.09)/HR |
| Stein 2009 (J Addict Dis) | USA, Rhode island, RCT 2001–2004 | 109 (28, 81) |
NA |
NA |
0.87 (0.26, 2.93)/RR*ˆ |
NA |
0.87 (0.26, 2.93)/RR* |
| Hagan 2004 (Epidemiology) | USA, Seattle, Multiple setting 1994–2001 | 484 (185, 299) |
NA |
NA |
1.5 (1, 2.1)/HR | 1.2 (0.9, 1.8)/AHR | 1.2 (0.9, 1.8)/AHR |
| McDonald 2012 (Int J Drug Policy) | Scotland, Glasgow, Community 1993–2007 | 829 (290, 539) | 10.6 (8.3, 13.5) | 10.1 (8.3, 12.3) | 1.05 (0.76, 1.43)/IRR&ˆ |
NA |
1.05 (0.76, 1.43)/IRR& |
| Vallejo 2015 (J Epidemiol Community Health) | Spain, Barcelona, Madrid and Seville, Community 2001–2006 | 77 (21, 56) | 43.8 (28.66, 66.93)$ | 38.5 (29.05, 50.93)$ | 1.1 (0.6, 2.2)/IRR | 0.6 (0.3, 1.2)/AIRR | 0.6 (0.3, 1.2)/AIRR |
| Tsui 2014 (JAMA Intern Med) | USA, San Francisco, Community 2000–2013 | 552 (176, 376) |
NA |
NA |
NA |
1.39 (1, 1.92)/AHR | 1.39 (1, 1.92)/AHR |
Cohort Study Risk Ratio calculator of Stata used to calculate RR for meta-analysis.
We used Incidence Rate Ratio calculator of Stata to compute confidence interval.
The effect size or CI is calculated.
F:M IRR: Female to Male Incidence Rate Ratio.
The Incidence Rate or CI is calculated.
The source of included studies is cited in supplementary documents as well.
Adjusted rate ratios were used in the analysis where they were reported in the source studies with the goal of minimizing bias in the estimate of measured effect as described by Hagan et al, (32). We transformed the HCV incidence rate ratio into the natural logarithm. Results are presented as rate ratios (converted from the natural logarithm; Table 2). Forest plots were created to show pooled estimates of incidence rate and 95% CIs by sex and F:M rate ratio. Using a random effects model, we estimated the overall ratio and in subgroups of geographic locations, type of collecting data, recruitment setting types, and by model of analyzing, types of effect size (if sex is included in adjusted model), NOS score and screening test (anti-HCV and/or RNA). The results were sorted by the estimated midpoint of recruitment date (Figure 2 and 3). Publication bias was evaluated using a funnel plot with Egger’s bias indicator test.
Table 2.
Summary of incident rate ratios (IRR) for female to male HCV incidence in studies of people who inject drugs (PWID) overall and by subgroups including: geographic area, study setting, HCV test used to identify incident infection, type of analysis model, effect size, nature of data collection and NOS score.
| Subgroups (Number of studies) |
Incidence Rate Ratio (95%CI) | Tests of heterogeneity
|
||
|---|---|---|---|---|
| Heterogeneity statistic | P-Value | I2 | ||
| Overall (28) | 1.36 (1.13. 1.64) | 95.23 | <0.001 | 71.6% |
| Geographic area | ||||
| Australia (9) | 1.21 (0.96, 1.53) | 14.39 | 0.072 | 44.4% |
| Canada (5) | 1.44 (1.18, 1.77) | 3.42 | 0.491 | 0% |
| China (1) | 4.00 (1.80, 8.89) | NA | NA | NA |
| Europe (8) | 1.56 (0.86, 2.84) | 58.46 | <0.001 | 88% |
| USA (5) | 1.17 (0.95, 1.43) | 3.90 | 0.42 | 0% |
| Study setting | ||||
| Community (16) | 1.24 (1.03, 1.48) | 26.99 | 0.029 | 44.4% |
| Prisons (2) | 1.48 (1.12, 1.96) | 0.32 | 0.569 | 0% |
| Clinical setting (7) | 1.72 (0.86, 3.45) | 60.9 | <0.001 | 90.1% |
| Multiple setting (3) | 1.30 (0.99, 1.72) | 1.28 | 0.527 | 0% |
| HCV test used to identify incident infection | ||||
| Anti-HCV (18) | 1.39 (1.05, 1.85) | 77.69 | <0.001 | 78.1% |
| HCV RNA (10) | 1.29 (1.05, 1.57) | 16.40 | 0.059 | 45.1% |
| Type of analysis model | ||||
| Cox Model (14) | 1.28 (1.14, 1.45) | 12.95 | 0.451 | 0% |
| Others (14) | 1.44 (0.97, 2.14) | 81.25 | <0.001 | 84% |
| Type of effect size* | ||||
| Crude (18) | 1.32 (1.01, 1.73) | 77.44 | <0.001 | 78% |
| Adjusted (10) | 1.41 (1.13, 1.76) | 17.36 | 0.043 | 48.2% |
| By nature of data collection | ||||
| Retrospective design (5) | 0.99 (0.81, 1.2) | 5.63 | 0.229 | 28.9% |
| Prospective design (23) | 1.49 (1.2, 1.86) | 70.87 | <0.001 | 69% |
| By NOS score | ||||
| NOS=7 (11) | 1.59 (1.03, 2.47) | 61.05 | <0.001 | 83.6% |
| NOS=8 (12) | 1.19 (0.94, 1.50) | 25.09 | 0.009 | 56.2% |
| NOS=9 (5) | 1.37 (1.14, 1.66) | 2.11 | 0.716 | 0% |
Random effect model; NA: Not applied
In ten studies that reported both crude and adjusted (including sex) F:M ratio of HCV incidence: Vallejo 2015, Bruneau 2012, Hagan 2004, Snow 2014, Tsui 2014, Grebely 2014, Maher 2006, Lucidarme 2004, Puri 2014, Ruan 2007
Figure 2.
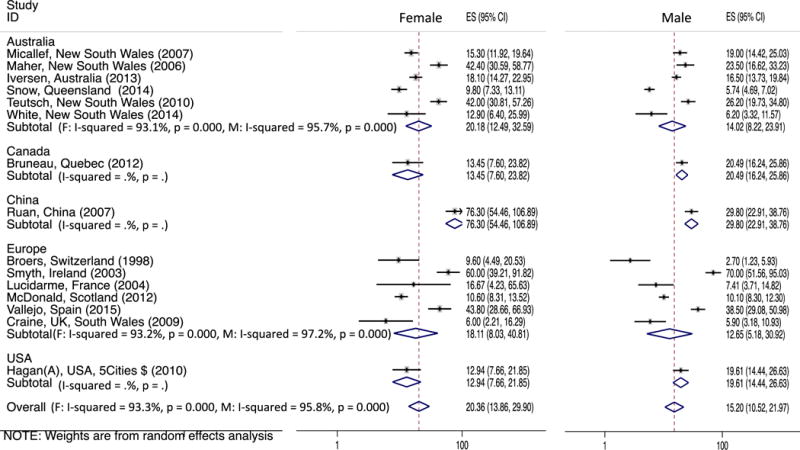
Forest plot of the studies and pooled estimates of incident HCV per 100 person-years observation in female and male PWID (ES: Effect Size which is the HCV incidence).
Figure 3.
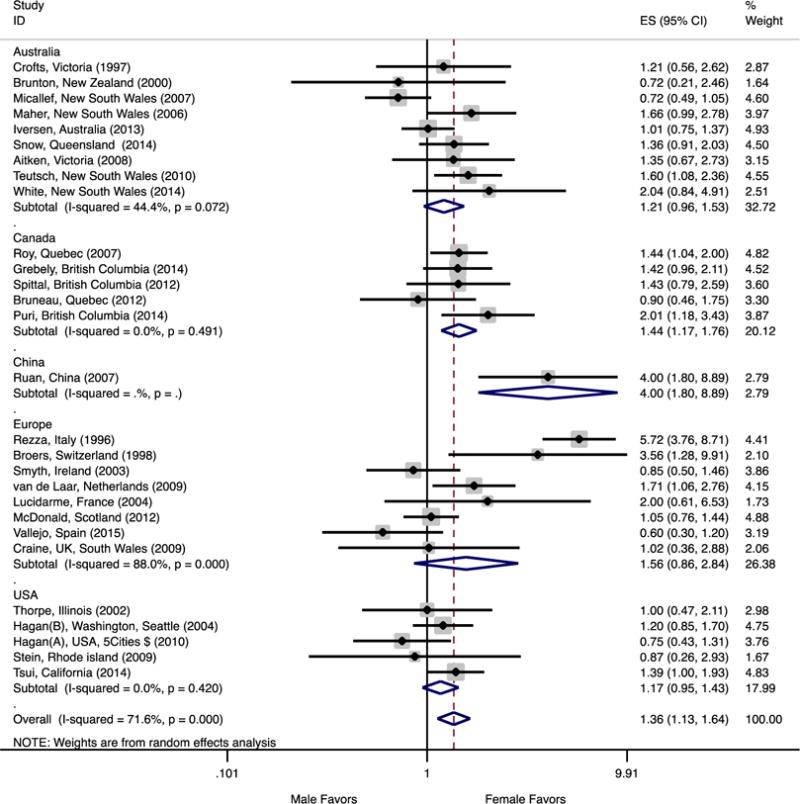
Forest plot of the studies and pooled estimates of female to male rate ratios of HCV infection in people who inject drugs by geographic area. Within each continent, studies are sorted by recruitment date midpoint. F-M IRR ranges between 0 and +infinity; 1 would be the F-M equality and amount less than 1 is favors males.
Analyses were conducted using Stata version 13.1 (StataCorp LP, College Station, Texas USA) for data analyses using the metan command and heterogeneity was assessed, using the I2 statistic. We used meta-regression to evaluate trend of F:M IRR over the time (the estimated midpoint of recruitment date).
RESULTS
A total of 2,393 reports published from 1989 through March 2015 were identified. Of these, 103 were determined to be eligible for full text assessment (Figure 1). The cohort studies included overall had high NOS ratings, ranging 7–9 (out of 10). The characteristics of included studies (all the articles that reported the HCV incidence in PWID) are shown in Tables 1 and S.1. We identified duplicate data from same cohorts (Table S.2) based on matching cohort names, settings, and geographic area; this was followed by comparing sample sizes, years of data collection, and other study characteristics to select the most complete and informative report (cohorts) for final analysis.
Figure 1.
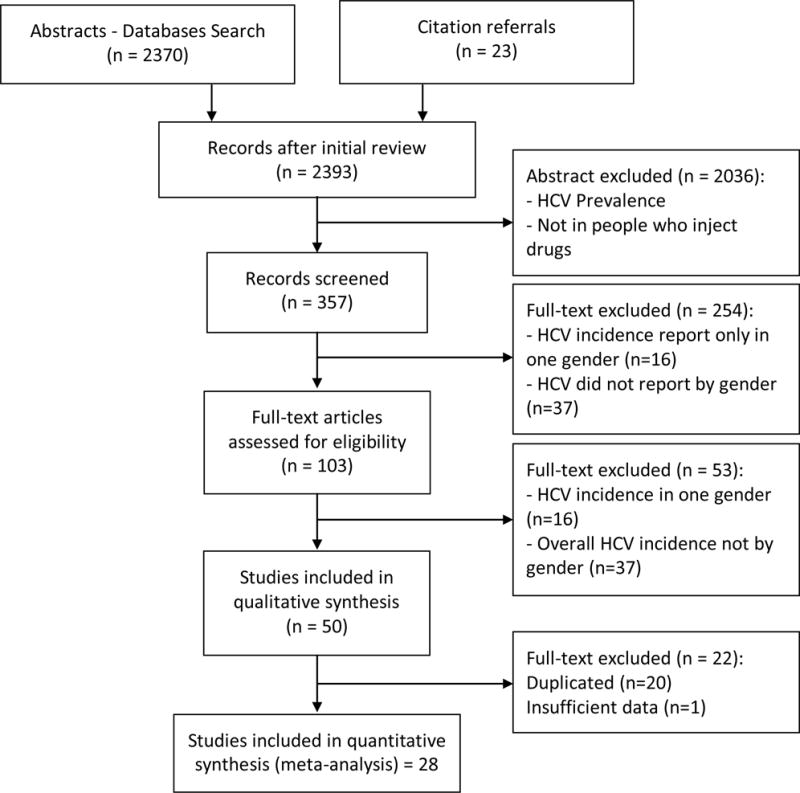
Flow Chart of Selection Process of Reviewed Studies
After evaluating the eligibility criteria and removing duplicate cohorts (Table S.2), we found 28 studies eligible for inclusion in our final analysis. One of these studies was a randomized clinical trial (33); all others were observational longitudinal studies, including 5 retrospective and 22 prospective cohort studies. These 28 studies included a total of 9,325 enrolled PWID, with 6,049 male and 2,098 female participants, and 14,787.42 PYO.
In Figure 2, we report HCV incidence rates (IRs) and variability within five continents and overall in females and males; results were sorted by the recruitment date midpoint. In 16 studies that reported HCV IRs in both females and males, the overall pooled HCV estimate was 20.36/100 PYO (95%CI: 13.86, 29.90) in females and 15.20/100 PYO (95%CI 10.52, 21.97) in males. The pooled HCV IRs reported in Australian studies were 20.18/100 PYO in females and 14.02/100 PYO in males. The variability was considerable in both sexes (I-Squared>93%, P < 0.001), however no time trend was observed. In six European studies that reported IRs, the pooled HCV IRs in females and males were 18.11 and 12.65 /100 PYO, respectively. The variability was also considerable in both groups and significant (I-Squared>95%, P < 0.001) with no time trend pattern. In the only study from China, the HCV IR was 76.30/100 PYO in females compared to 29.80/100 PYO in males, higher than rates reported by any other studies.
Table 2 shows results for F:M HCV incidence rate ratios (IRR) overall and stratified by geographical area, research setting, type of data collection, analysis model and by types of effects size. Overall, the pooled F:M HCV IRR was 1.36:1 (95%CI 1.13, 1.64), with relatively high heterogeneity (I2=71.6%, P < 0.001). Subgroup analyses shed light on potential causes of this variability. Lower heterogeneity and I2 statistics were observed with higher NOS scores. Five studies with NOS score of 9 (Table S.4) were accompanied by zero I2 and F:M IRR of 1.37, comparable to the overall estimate of 1.36. By geographical area, studies in the U.S. (N=5) and Australia (N=9) had comparable pooled estimates of relative risk of HCV for females compared to males: IRR: 1.17 and 1.21, respectively, followed by European studies (N=8) at 1.56. We observed elevated but non-significant higher F:M IRR (95%CI) in Australia and the U.S. respectively: 1.21 (0.96–1.53) and 1.17 (0.95–1.43).
In studies which recruited participants from community settings, the pooled F:M IRR was 1.24 (95%CI: 1.03, 1.48), which was lower than seen in studies conducted in prison settings (1.48, 95%CI: 1.12, 1.96), and in studies conducted in clinical settings (1.72, 95%CI: 0.86, 3.45). The results of studies conducted in prison and multiple setting were more consistent (I2=0%), compared to the high variability (I2= 90.1%) observed in studies conducted in clinical settings. The pooled F:M IRR estimate was not elevated in studies which used a retrospective design (0.99), whereas prospective studies showed a significantly elevated pooled F:M IRR at 1.49, but with high variability (I2=69%). Another factor that impacted F:M IRR were found by type of analyses: those that used Cox proportional hazards modeling and reported a Hazard Ratio (HR) or Adjusted Hazard Ratio (AHR) had elevated pooled F:M IRR at 1.28, and showed no significant variability in the F:M ratio (I2=0%). We found that only ten out of 28 (35.7%) studies included sex in their adjusted model when examining HCV incidence (in addition to covariates such as age, duration of injecting, drug usually injected, recruitment strategy, shared syringe, needle and equipment exposures, ethnicity, sexually transmitted infection, geographical region, opiate agonist treatment, recent incarceration, and homelessness). In the studies grouped by those that presented unadjusted models, the crude pooled F:M IRR was 1.32, compared to 1.41 in those that adjusted for sex and other covariates (Table 2). Studies that identified incident HCV based on RNA testing showed a F:M IRR of 1.29 and lower variability (I2=45%) compared to those that identified incidence using anti-HCV (F:M IRR=1.39; I2=78.1%).
Figure 3 illustrates the F:M IRR variability within five continents. Sorting the results by the recruitment date midpoint provides further clarity on underlying variability in Australian and European studies. For the eight studies in Europe that reported IRRs (England, Nederland, Spain, France, Italy, Scotland and Switzerland), we noted high variability (I2= 88%). The F:M ratio in Europe decreased significantly (coefficient: −0.12, p=0.039) from 5.72 in the Rezza et al study (1996) to 0.6 in the Craine et al study (2015; Figure 3). In contrast, we noted moderate variability in Australia (I2 of 44.4%). In Australia, we observed a borderline increase (coefficient: 0.05, p=0.064) in the trend of F:M IRR from 0.72 (95%CI: 0.21, 2.46) in the Brunton et al study (2000) to 2.04 (95%CI: 0.84,4.92) in the White et al study (2015, Figure 3). In Canada and USA, the observed variability was due to chance only (sampling error) as both had I2 of 0% (P>0.42) with no time trend in results.
DISCUSSION
The higher pooled estimated IR among females (20.36/100 PYO) compared to men (15.20 /100 PYO) is consistent with an overall 36% higher risk of infection. This effect is seen from pooling data from a substantive number (N=28) of studies, thus providing sufficient statistical power to detect and test for sex differences. Substantial heterogeneity (I2= 71.6%) was observed overall, and when restricting analyses to studies with high NOS scores (=9), pooled M:F IRR estimates were similar to the overall pooled estimate (1.37) and variability in this subgroup was null. Inconsistency in results was seen in association with various study factors, most notably geographic locations, study setting, type of analysis model and type of HCV screening test used to identify incident infection.
In all geographic regions, studies showed elevated F:M IRRs; those conducted in North America (Canada and USA) had the least heterogeneity, whilst those in Australia and Europe the most. These results suggest that risk differential between females and males is not constant. The variability in the studies from Europe and Australia appears to be in part associated with temporal changes, which is demonstrated in figure 3. However, when examining these, it is not clear what potential changes, for instance in behavioral or structural factors, might have contributed to the trends seen in female to male risk differential. In Australia, comprehensive harm-reduction and drug treatment programs (including needle and syringe programs, peer education and opioid agonist therapy programs) have contributed to decreased overall HCV infection rate (9, 34), yet the F:M IRR among PWID shows an upward trend over the past 18 years, suggesting that women are increasingly at disproportionate risk. In contrast, studies conducted in European countries show downward trends in the F:M IRR. One study in Spain describes a program specifically targeting HCV risk reduction in women (35), but it is difficult to know if there has been wider implementation of this or similar programs, and if such programs contributed to the downward trend in F:M IRR. There remain significant gaps in information and data from these and many other regions where HCV is epidemic among PWID. The single study from China, which found a fourfold higher risk for females, points to a need for more work in Asia. No studies were found from South or Southeast Asia where there are large populations of PWID (3, 36). As well, there is a lack of data from the Middle East and North Africa as well as Sub-Saharan Africa (3, 36). Data from these regions would add significantly to characterizing factors involved in differential risk between female and male PWID.
Behavioral and social risks have been shown to differ between female and male injectors (9, 12, 13, 16) and some studies that have investigated sex differences have found that some of these risk exposures can account for differences in HCV incidence (8, 12, 37). In addition to differential behavioral risks, studies are needed to assess other potential causes and mediators, including biological, and structural contribute to differential HCV risk. Biological factors that may contribute to increased susceptibility, estrogen receptors, and genetic variations in the estrogen receptor gene (the estrogen receptor 2 gene) are potential factors which might contribute to higher HCV incidence in females (38). The natural history of HCV infection does differ significantly in females compared to males including higher rates of viral clearance (39), re-clearance after reinfection (40), and differences in response to HCV treatment for chronic HCV (41, 42). Overall, a lack of information on sex-specific differences is the norm; we found that just over a third (34.5%) of studies on HCV incidence examined sex related differences in HCV incidence. Further work should go beyond controlling for sex differences and begin to examine factors that contribute to differences, and especially higher risk in women.
These findings regarding incident HCV are in contrast to those seen with respect to prevalent HCV infection, where meta-analyses show prevalence parity among PWID (20). Factors that can lead to differences in HCV infection measures, including in incidence and prevalence studies include how HCV infection is measured, and how frequently. Since women are significantly more likely to spontaneously clear HCV (39, 43), variability in HCV testing interval in the different studies may also contribute to biased estimates of infection detection (44). Spontaneous clearance of HCV also may explain differences in the rate ratios observed between clinical settings where monitoring may be more frequent and have the highest rate ratio (1.72) compared with prison (1.48) or community (1.24) settings (Table 2).
Our findings have some limitations. Overall and in most of the subgroup analysis, we had a large amount of heterogeneity which couldn’t be solely explained by study type, study recruitment, study setting, geographical location, analytic approaches or screening test. Other factors that may contribute to this include factors which we could not control for, such as differences in drugs used, behavioral risk exposures, method of data collection, and follow-up frequencies. The random effects model we used, in part, addresses some of these variabilities. Evaluating the effect size based on testing methods (anti-HCV and HCV RNA) showed a small decrease in effect size in those studies using RNA testing compared to RNA (1.29 vs. 1.39, respectively). However, this does not impact the overall finding of significantly higher pooled F:M IRR. Significant effects size with low variability in subgroup analysis of study that used the Cox proportional survival model (1.28, I2=0%) support our inferences regarding sex differences difference (Table 2). Finally, we assessed the publication bias by looking at the symmetrical funnel plot (Figure 4), indicating that there is no publication bias for the F:M ratios (Egger’s test P = 0.736).
Figure 4.
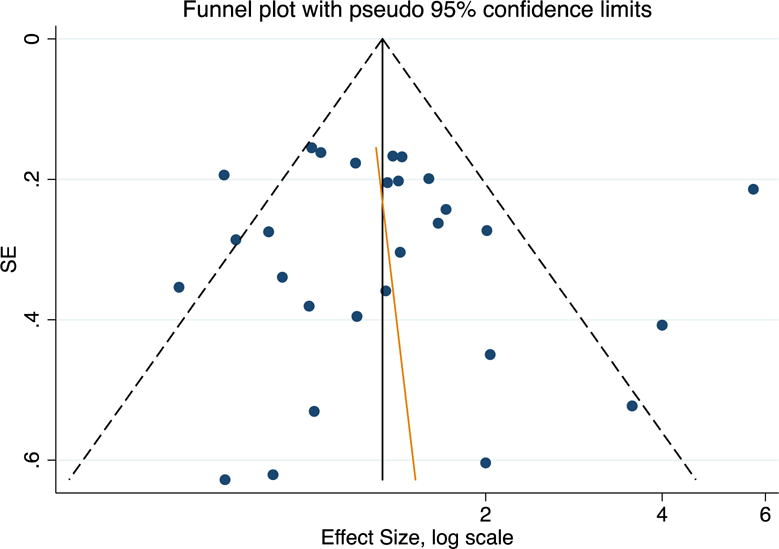
Publication bias in studies of people who inject drugs: the female to male incidence rate ratio funnel plot is symmetric, indicating that there is no publication bias (Egger’s test P = 0.736).
Globally, sexual differences in burden of HCV infection are not well studied. While our results show that there is a differential in HCV acquisition, in absolute numbers, among PWID more males are HCV infected than females, due to the higher prevalence of injecting (7), and lower HCV clearance (39). Nevertheless, there is a need to assess and identify mechanisms for sex related differences. Biological factors may contribute to differences in HCV susceptibility by sex, but potential mechanisms have not been studied. Certainly, other data show that women have different biological responses to HCV: female PWID have higher rates of spontaneous clearance and reclearance after reinfection (39, 40) than men, as well as lower rates of HCV associated liver disease and mortality (45). Behavioral and social factors, however pose the most proximal point for interventions to reduce sex related differences, as many studies have shown that females who inject drugs have significantly higher HCV associated risk exposures than males (8, 10–12). Behavioral, social and structural factors, play an important role in transmission of HCV and other infections like HIV, and these are likely to differ by country and region where cultural, social and political factors may differentially impact risk by sex. Sex-based interventions are under-implemented and may have potential to contribute to reducing some of the risk differential between male and female PWID. Studies show that female PWID often face significant stigma, leading to lower participation in harm reduction services (46, 47). In addition to behavioral interventions, further integration of biomedical prevention especially targeting women is needed (48). Opiate agonist therapy and needle and syringe programs are proven, safe, and effective interventions to reduce HCV infection (32, 49), and new sex-based approaches should be explored with the goal of reducing disparities in HCV infection rates. As with many meta-analyses, especially of observational research, findings from this analysis reveals gaps/need for more research in the area (50). Future investigations to assess mechanisms, mediators and moderators of the differences in HCV incidence between women and men will inform public health practice and approaches to prevention.
Supplementary Material
Acknowledgments
This study was supported by the National Institutes of Health (NIH) National Institute on Drug Abuse (NIDA) Award Number R01DA031056. KP also received support from NIDA 3-R01 DA016017, 1 ULTR001449 and U54GM104944. The content is solely the responsibility of the authors and does not necessarily represent the official views of the NIH or NIDA. Literature review, data extraction and quality assessment have done by three persons (AE, AE, AM). In detail, all authors contributed to this paper and fulfill the authorship criteria: Designed the study (AE, AM, HS, KP), literature review and data extraction (AE, AE, AM), Analyzed the data (AE, AM), wrote the paper (AE, AM, KP), reviewed and commented on the manuscript (AE, AM, GC, AE, BH, HS, KP). The manuscript has been read and approved by all co-authors.
Abbreviations
- CI
Confidence Interval
- F:M
Female to Male
- HCV
Hepatitis C Virus
- HR
Hazard Ratio
- IRR
Incidence Rate Ratio
- OR
Odds Ratio
- PWID
People Who Inject Drugs
- PYO
Person-Years Observation
- U.S.
The United States
Footnotes
Authors have no commercial or other association that might pose a conflict of interest.
References
- 1.Gower E, Estes C, Blach S, Razavi-Shearer K, Razavi H. Global epidemiology and genotype distribution of the hepatitis C virus infection. J Hepatol. 2014;61(1 Suppl):S45–57. doi: 10.1016/j.jhep.2014.07.027. [DOI] [PubMed] [Google Scholar]
- 2.Messina JP, Humphreys I, Flaxman A, et al. Global distribution and prevalence of hepatitis C virus genotypes. Hepatology. 2015;61(1):77–87. doi: 10.1002/hep.27259. [DOI] [PMC free article] [PubMed] [Google Scholar]
- 3.Mohd Hanafiah K, Groeger J, Flaxman AD, Wiersma ST. Global epidemiology of hepatitis C virus infection: new estimates of age-specific antibody to HCV seroprevalence. Hepatology. 2013;57(4):1333–42. doi: 10.1002/hep.26141. [DOI] [PubMed] [Google Scholar]
- 4.Wedemeyer H, Dore GJ, Ward JW. Estimates on HCV disease burden worldwide – filling the gaps. J Viral Hepat. 2015;22(Suppl 1):1–5. doi: 10.1111/jvh.12371. [DOI] [PubMed] [Google Scholar]
- 5.Stanaway JD, Flaxman AD, Naghavi M, et al. The global burden of viral hepatitis from 1990 to 2013: findings from the Global Burden of Disease Study 2013. Lancet. 2016 doi: 10.1016/S0140-6736(16)30579-7. [DOI] [PMC free article] [PubMed] [Google Scholar]
- 6.Murphy EL, Bryzman SM, Glynn SA, et al. Risk factors for hepatitis C virus infection in United States blood donors. NHLBI Retrovirus Epidemiology Donor Study (REDS) Hepatology. 2000;31(3):756–62. doi: 10.1002/hep.510310329. [DOI] [PubMed] [Google Scholar]
- 7.Lansky A, Finlayson T, Johnson C, et al. Estimating the number of persons who inject drugs in the united states by meta-analysis to calculate national rates of HIV and hepatitis C virus infections. PLoS One. 2014;9(5):e97596. doi: 10.1371/journal.pone.0097596. [DOI] [PMC free article] [PubMed] [Google Scholar]
- 8.Evans JL, Hahn JA, Page-Shafer K, et al. Gender differences in sexual and injection risk behavior among active young injection drug users in San Francisco (the UFO Study) J Urban Health. 2003;80(1):137–46. doi: 10.1093/jurban/jtg137. [DOI] [PMC free article] [PubMed] [Google Scholar]
- 9.Iversen J, Wand H, Topp L, Kaldor J, Maher L. Reduction in HCV incidence among injection drug users attending needle and syringe programs in Australia: a linkage study. Am J Public Health. 2013;103(8):1436–44. doi: 10.2105/AJPH.2012.301206. [DOI] [PMC free article] [PubMed] [Google Scholar]
- 10.Morris MD, Bates A, Andrew E, Hahn J, Page K, Maher L. More than just someone to inject drugs with: Injecting within primary injection partnerships. Drug Alcohol Depend. 2015;156:275–81. doi: 10.1016/j.drugalcdep.2015.09.025. [DOI] [PMC free article] [PubMed] [Google Scholar]
- 11.Morris MD, Evans J, Montgomery M, et al. Intimate injection partnerships are at elevated risk of high-risk injecting: a multi-level longitudinal study of HCV-serodiscordant injection partnerships in San Francisco, CA. PLoS One. 2014;9(10):e109282. doi: 10.1371/journal.pone.0109282. [DOI] [PMC free article] [PubMed] [Google Scholar]
- 12.Tracy D, Hahn JA, Fuller Lewis C, et al. Higher risk of incident hepatitis C virus among young women who inject drugs compared with young men in association with sexual relationships: a prospective analysis from the UFO Study cohort. BMJ Open. 2014;4(5):e004988. doi: 10.1136/bmjopen-2014-004988. [DOI] [PMC free article] [PubMed] [Google Scholar]
- 13.Folch C, Casabona J, Espelt A, et al. Gender differences in HIV risk behaviours among intravenous drug users in Catalonia, Spain. Gac Sanit. 2013;27(4):338–43. doi: 10.1016/j.gaceta.2013.02.006. [DOI] [PubMed] [Google Scholar]
- 14.Hurtado Navarro I, Alastrue I, Del Amo J, et al. Differences between women and men in serial HIV prevalence and incidence trends. Eur J Epidemiol. 2008;23(6):435–40. doi: 10.1007/s10654-008-9246-2. [DOI] [PubMed] [Google Scholar]
- 15.van Beek I, Dwyer R, Dore GJ, Luo K, Kaldor JM. Infection with HIV and hepatitis C virus among injecting drug users in a prevention setting: retrospective cohort study. BMJ. 1998;317(7156):433–7. doi: 10.1136/bmj.317.7156.433. [DOI] [PMC free article] [PubMed] [Google Scholar]
- 16.Viitanen P, Vartiainen H, Aarnio J, et al. Hepatitis A, B, C and HIV infections among Finnish female prisoners–young females a risk group. J Infect. 2011;62(1):59–66. doi: 10.1016/j.jinf.2010.10.011. [DOI] [PubMed] [Google Scholar]
- 17.CDC. Surveillance for Viral Hepatitis – United States, 2013. Division of Viral Hepatitis and National Center for HIV/AIDS, Viral Hepatitis, STD, and TB Prevention; 2013. [Google Scholar]
- 18.Duffell E. In: Hepatitis C surveillance in Europe –2013. Control ECfDPa, editor. Vol. 2015. Stockholm: ECDC; 2015. [Google Scholar]
- 19.Wu HX, Wu J, Wong T, et al. Enhanced surveillance of newly acquired hepatitis C virus infection in Canada, 1998 to 2004. Scand J Infect Dis. 2006;38(6–7):482–9. doi: 10.1080/00365540500525161. [DOI] [PubMed] [Google Scholar]
- 20.Hagan H, Des Jarlais DC, Stern R, et al. HCV synthesis project: preliminary analyses of HCV prevalence in relation to age and duration of injection. Int J Drug Policy. 2007;18(5):341–51. doi: 10.1016/j.drugpo.2007.01.016. [DOI] [PubMed] [Google Scholar]
- 21.Onofrey S, Aneja J, Haney GA, et al. Underascertainment of acute hepatitis C virus infections in the U.S. surveillance system: a case series and chart review. Ann Intern Med. 2015;163(4):254–61. doi: 10.7326/M14-2939. [DOI] [PMC free article] [PubMed] [Google Scholar]
- 22.Carlson MD, Morrison RS. Study design, precision, and validity in observational studies. J Palliat Med. 2009;12(1):77–82. doi: 10.1089/jpm.2008.9690. [DOI] [PMC free article] [PubMed] [Google Scholar]
- 23.Micallef JM, Macdonald V, Jauncey M, et al. High incidence of hepatitis C virus reinfection within a cohort of injecting drug users. J Viral Hepat. 2007;14(6):413–8. doi: 10.1111/j.1365-2893.2006.00812.x. [DOI] [PubMed] [Google Scholar]
- 24.Maher L, Jalaludin B, Chant KG, et al. Incidence and risk factors for hepatitis C seroconversion in injecting drug users in Australia. Addiction. 2006;101(10):1499–508. doi: 10.1111/j.1360-0443.2006.01543.x. [DOI] [PubMed] [Google Scholar]
- 25.Broers B, Junet C, Bourquin M, Deglon JJ, Perrin L, Hirschel B. Prevalence and incidence rate of HIV, hepatitis B and C among drug users on methadone maintenance treatment in Geneva between 1988 and 1995. AIDS. 1998;12(15):2059–66. doi: 10.1097/00002030-199815000-00018. [DOI] [PubMed] [Google Scholar]
- 26.Roy E, Alary M, Morissette C, et al. High hepatitis C virus prevalence and incidence among Canadian intravenous drug users. Int J STD AIDS. 2007;18(1):23–7. doi: 10.1258/095646207779949880. [DOI] [PubMed] [Google Scholar]
- 27.Ruan Y, Qin G, Yin L, et al. Incidence of HIV, hepatitis C and hepatitis B viruses among injection drug users in southwestern China: a 3-year follow-up study. AIDS. 2007;21(Suppl 8):S39–46. doi: 10.1097/01.aids.0000304695.54884.4f. [DOI] [PubMed] [Google Scholar]
- 28.van de Laar TJ, Molenkamp R, van den Berg C, et al. Frequent HCV reinfection and superinfection in a cohort of injecting drug users in Amsterdam. J Hepatol. 2009;51(4):667–74. doi: 10.1016/j.jhep.2009.05.027. [DOI] [PubMed] [Google Scholar]
- 29.Stern RK, Hagan H, Lelutiu-Weinberger C, et al. The HCV Synthesis Project: scope, methodology, and preliminary results. BMC Med Res Methodol. 2008;8:62. doi: 10.1186/1471-2288-8-62. [DOI] [PMC free article] [PubMed] [Google Scholar]
- 30.Wells G, Shea B, Peterson J, Welch V, Losos M, Tugwell P. The Newcastle-Ottawa Scale (NOS) for Assessing the Quality of Nonrandomised Studies in Meta-Analyses. Ottawa: Ottawa Hospital Research Institute; [Google Scholar]
- 31.Altman DG, Bland JM. How to obtain the confidence interval from a P value. BMJ. 2011;343:d2090. doi: 10.1136/bmj.d2090. [DOI] [PubMed] [Google Scholar]
- 32.Hagan H, Pouget ER, Des Jarlais DC. A systematic review and meta-analysis of interventions to prevent hepatitis C virus infection in people who inject drugs. J Infect Dis. 2011;204(1):74–83. doi: 10.1093/infdis/jir196. [DOI] [PMC free article] [PubMed] [Google Scholar]
- 33.Stein MD, Herman DS, Anderson BJ. A trial to reduce hepatitis C seroincidence in drug users. J Addict Dis. 2009;28(4):389–98. doi: 10.1080/10550880903183034. [DOI] [PMC free article] [PubMed] [Google Scholar]
- 34.Morris MD, S S, Bruneau J, Maher L, Hahn J, Hellard M, Prins M, Cox AL, Dore G, Dietz P, Grebely J, Kim A, Lauer G, Lloyd A, Rice T, Shoukry N, Page K, on behalf of the InC3 Collaborative Geographic differences in temporal incidence trends of hepatitis C virus (HCV) infection among people who inject drugs: the InC3 Collaborative. doi: 10.1093/cid/ciw869. Under editorial review. [DOI] [PMC free article] [PubMed] [Google Scholar]
- 35.Gilchrist G, Torrens M. Reducing hepatitis C sexual and drug taking risk behaviours among female drug users in Europe (REDUCE) The Parc de Salut Mar, Barcelona, Spain. 2010–2013 [Google Scholar]
- 36.Nelson PK, Mathers BM, Cowie B, et al. Global epidemiology of hepatitis B and hepatitis C in people who inject drugs: results of systematic reviews. Lancet. 2011;378(9791):571–83. doi: 10.1016/S0140-6736(11)61097-0. [DOI] [PMC free article] [PubMed] [Google Scholar]
- 37.Puri N, DeBeck K, Feng C, Kerr T, Rieb L, Wood E. Gender influences on hepatitis C incidence among street youth in a Canadian setting. J Adolesc Health. 2014;55(6):830–4. doi: 10.1016/j.jadohealth.2014.07.006. [DOI] [PMC free article] [PubMed] [Google Scholar]
- 38.Cai L, Gao C, Tang S, et al. Sex-specific association of estrogen receptor 2 polymorphisms with hepatitis C virus infection outcomes in a high-risk Chinese Han population. Infect Genet Evol. 2014;28:118–24. doi: 10.1016/j.meegid.2014.09.024. [DOI] [PubMed] [Google Scholar]
- 39.Grebely J, Page K, Sacks-Davis R, et al. The effects of female sex, viral genotype, and IL28B genotype on spontaneous clearance of acute hepatitis C virus infection. Hepatology. 2014;59(1):109–20. doi: 10.1002/hep.26639. [DOI] [PMC free article] [PubMed] [Google Scholar]
- 40.Sacks-Davis R, Grebely J, Dore GJ, et al. Hepatitis C Virus Reinfection and Spontaneous Clearance of Reinfection-the InC3 Study. J Infect Dis. 2015 doi: 10.1093/infdis/jiv220. [DOI] [PMC free article] [PubMed] [Google Scholar]
- 41.Livingston SE, Townshend-Bulson LJ, Bruden DJ, et al. Results of interferon-based treatments in Alaska Native and American Indian population with chronic hepatitis C. Int J Circumpolar Health. 2016;75:30696. doi: 10.3402/ijch.v75.30696. [DOI] [PMC free article] [PubMed] [Google Scholar]
- 42.Thornton K, Deming P, Manch RA, et al. Is response guided therapy dead? Low cure rates in patients with detectable hepatitis C virus at week 4 of treatment. Hepatol Int. 2016 doi: 10.1007/s12072-016-9725-6. [DOI] [PubMed] [Google Scholar]
- 43.Page K, Hahn JA, Evans J, et al. Acute hepatitis C virus infection in young adult injection drug users: a prospective study of incident infection, resolution, and reinfection. J Infect Dis. 2009;200(8):1216–26. doi: 10.1086/605947. [DOI] [PMC free article] [PubMed] [Google Scholar]
- 44.Vickerman P, Grebely J, Dore GJ, et al. The more you look, the more you find: effects of hepatitis C virus testing interval on reinfection incidence and clearance and implications for future vaccine study design. J Infect Dis. 2012;205(9):1342–50. doi: 10.1093/infdis/jis213. [DOI] [PMC free article] [PubMed] [Google Scholar]
- 45.Mathers BM, Degenhardt L, Bucello C, Lemon J, Wiessing L, Hickman M. Mortality among people who inject drugs: a systematic review and meta-analysis. Bull World Health Organ. 2013;91(2):102–23. doi: 10.2471/BLT.12.108282. [DOI] [PMC free article] [PubMed] [Google Scholar]
- 46.Razani N, Mohraz M, Kheirandish P, et al. HIV risk behavior among injection drug users in Tehran, Iran. Addiction. 2007;102(9):1472–82. doi: 10.1111/j.1360-0443.2007.01914.x. [DOI] [PubMed] [Google Scholar]
- 47.Simmonds L, Coomber R. Injecting drug users: a stigmatised and stigmatising population. Int J Drug Policy. 2009;20(2):121–30. doi: 10.1016/j.drugpo.2007.09.002. [DOI] [PubMed] [Google Scholar]
- 48.Page K, Tsui J, Maher L, et al. Biomedical HIV Prevention Including Pre-exposure Prophylaxis and Opiate Agonist Therapy for Women Who Inject Drugs: State of Research and Future Directions. J Acquir Immune Defic Syndr. 2015;69(Suppl 2):S169–75. doi: 10.1097/QAI.0000000000000641. [DOI] [PMC free article] [PubMed] [Google Scholar]
- 49.MacArthur GJ, van Velzen E, Palmateer N, et al. Interventions to prevent HIV and Hepatitis C in people who inject drugs: a review of reviews to assess evidence of effectiveness. Int J Drug Policy. 2014;25(1):34–52. doi: 10.1016/j.drugpo.2013.07.001. [DOI] [PubMed] [Google Scholar]
- 50.Stroup DF, Berlin JA, Morton SC, et al. Meta-analysis of observational studies in epidemiology: a proposal for reporting. Meta-analysis Of Observational Studies in Epidemiology (MOOSE) group. JAMA. 2000;283(15):2008–12. doi: 10.1001/jama.283.15.2008. [DOI] [PubMed] [Google Scholar]
Associated Data
This section collects any data citations, data availability statements, or supplementary materials included in this article.