

Abstract
The transcription factor ISGF3, comprised of IRF9 and tyrosine‐phosphorylated STATs 1 and 2, transmits the signal from the type I interferon receptor to the genome. We have discovered a novel phosphorylation of STAT2 on T387 that negatively regulates this response. In most untreated cell types, the majority of STAT2 is phosphorylated on T387 constitutively. In response to interferon‐β, the T387A mutant of STAT2 is much more effective than wild‐type STAT2 in mediating the expression of many interferon‐stimulated genes, in protecting cells against virus infection, and in inhibiting cell growth. Interferon‐β‐treated cells expressing wild‐type STAT2 contain much less ISGF3 capable of binding to an interferon‐stimulated response element than do cells expressing T387A STAT2. T387 lies in a cyclin‐dependent kinase (CDK) consensus sequence, and CDK inhibitors decrease T387 phosphorylation. Using CDK inhibitors to reverse the constitutive inhibitory phosphorylation of T387 of U‐STAT2 might enhance the efficacy of type I interferons in many different clinical settings.
Keywords: negative regulation, STAT2, T387 phosphorylation, type I interferon
Subject Categories: Signal Transduction
Introduction
Interferons (IFNs) are classified into types I, II, and III (Walter et al, 1998). The IFNAR1–IFNAR2 heterodimeric receptor for type I IFNs is ubiquitously expressed and, following IFN binding, transmits the signal through two receptor‐associated tyrosine kinases, tyrosine kinase 2 (TYK2) and Janus kinase 1 (JAK1), resulting in the phosphorylation of STAT1 at Y701 and STAT2 at Y690. The tyrosine‐phosphorylated STATs hetero‐dimerize and bind to IFN‐regulatory factor 9 (IRF9) to form the active transcription factor IFN‐stimulated gene factor 3 (ISGF3). ISGF3 initiates transcription by binding to IFN‐stimulated response elements (ISREs) in the promoters of interferon‐stimulated genes (ISGs) (Platanias, 2005).
Unlike other family members, STAT2 does not bind to DNA directly (Bluyssen & Levy, 1997). In ISGF3, STAT2 provides a potent transcriptional activation domain that recruits additional co‐factors required to initiate gene expression, including p300/CBP, GCN5, and DRIP150 (Bhattacharya et al, 1996). Mutant U6A cells, which lack STAT2, do not respond to type I IFNs unless STAT2 expression is restored (Leung et al, 1995) and mice lacking STAT2 have impaired immune systems and are vulnerable to virus infection (Park et al, 2000).
In addition to the essential tyrosine phosphorylations, post‐translational modifications of the STATs contribute important modulation of their functions. For example, STAT1 and STAT3 carry important regulatory phosphorylations on serine 727 residues (Decker & Kovarik, 2000), and STAT3 has a number of regulatory di‐methylations of lysine residues that impact its function (Yang et al, 2010; Dasgupta et al, 2015). Compared to other STATs, relatively few post‐translational modifications of STAT2 have been described. The acetylation of K390 of STAT2 positively regulates the induction of antiviral genes by enhancing the interaction between STAT1 and STAT2 (Tang et al, 2007), and mutants of S287 of STAT2 enhance the ability of ISGF3 to bind to DNA (Steen et al, 2013).
We now find that a major fraction of STAT2 is constitutively phosphorylated on T387 in most untreated cell types, and that this phosphorylation inhibits signaling in response to type I IFN. Mutation of T387 to A significantly enhances the formation and binding to DNA of the ISGF3 that is formed in response to type I IFN, and this mutation also enhances the antiviral and anti‐proliferative responses of cells treated with IFN‐β.
Identification of novel phosphorylated residues in STAT2
We used mass spectrometry to analyze STAT2 immunoprecipitated from 293T cells expressing the Flag‐tagged wild‐type protein. Three different chymotryptic peptides containing pT387 were identified: TSNQKTLpTPEKGQSQGL (C380–396), TSNQKTLpTPEKGQSQGLIW (C380–398), and NILTSNQKTLpTPEKGQSQGL (C377–396). The MS/MS spectrum for the phosphorylated chymotryptic peptide C380–398 is shown in Fig 1A. This doubly charged peptide has an observed m/z of 1,098.5372 Da and is within −1.2 ppm of the expected mass. The spectrum is dominated by H3PO4 loss, consistent with the presence of a phosphorylated S or T residue. The mass difference between the y12 and y11 ions is consistent with phosphorylation at T387. The degree of modification, determined from chromatograms of the unmodified and modified forms of the T387 chymotryptic peptides C380–396 and C380–398 (Fig 1B, left), was 85% in the untreated sample (Fig 1B, right).
Figure 1. Identification of novel phosphorylated residues in STAT2.
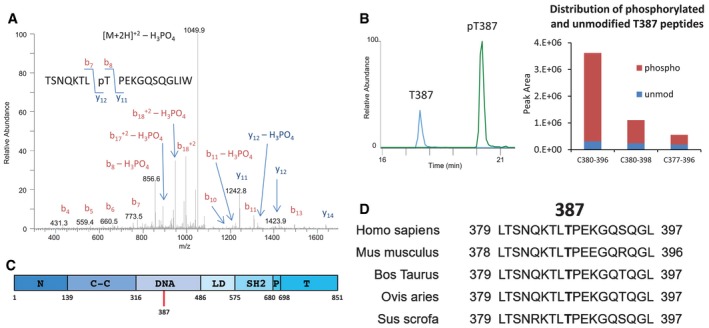
- MS/MS analysis of peptides corresponding to amino acids 380–399 of STAT2. 293T cells expressing Flag‐tagged STAT2 were used.
- Abundance of T387‐phosphorylated STAT2 in 293T cells expressing Flag‐tagged STAT2.
- Location of T387 in STAT2.
- Conservation of T387.
STAT2 does not recognize the ISRE element by binding to DNA directly; rather, it contributes a potent transcriptional activation domain to ISGF3. T387 is located in the so‐called DNA‐binding domain of STAT2 (Fig 1C), which is defined by its homology to similar regions on other STAT family members. The amino acid sequence surrounding T387 in human STAT2 is highly conserved across several other mammalian species (Fig 1D), consistent with the possibility that the phosphorylation of this residue might have an important function.
Phosphorylation of STAT2 on T387 regulates type I IFN signaling negatively
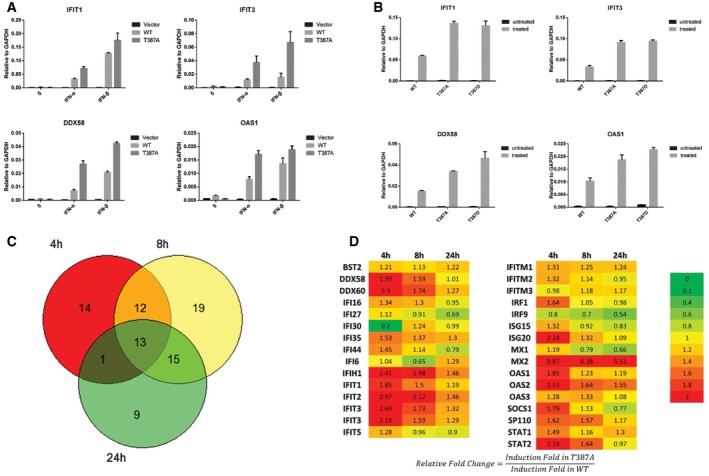
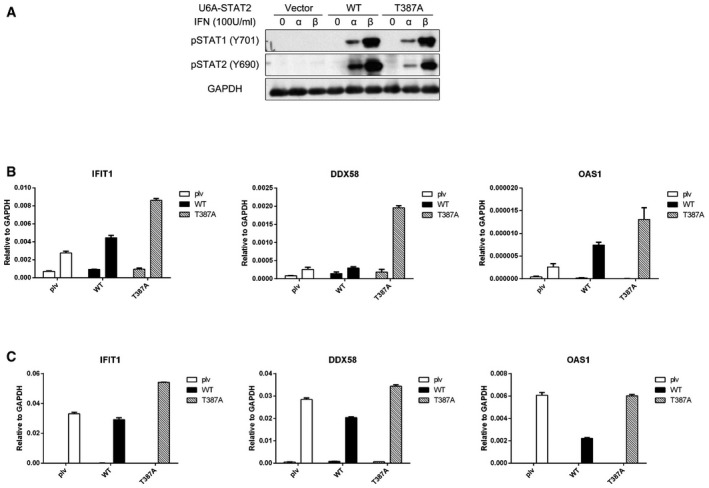
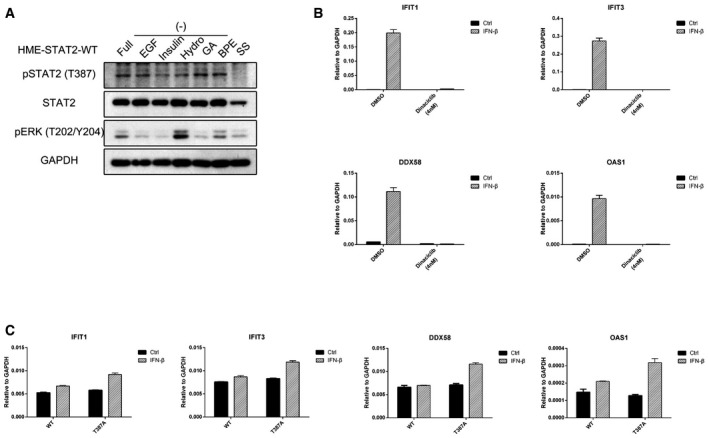
We mutated threonine 387 to alanine to prevent its phosphorylation and then expressed either Flag‐tagged wild‐type or T387A STAT2 in STAT2‐deficient U6A cells, followed by analysis of the IFN‐β‐induced expression of some typical ISGs by quantitative real‐time PCR (qPCR). The T387A mutation dramatically enhanced the expression of IFIT1, IFIT3, DDX58 and OAS1 at 4 h, but did not affect the expression or tyrosine phosphorylation of STAT1 or STAT2 (Figs 2A and EV1A). As a control, we repeated the same experiment in 293T and human mammary epithelial (HME) cells to show that increased levels of STAT2, due to expression of the Flag‐tagged wild‐type protein, did not change gene expression in response to IFN‐β substantially (Fig EV1B and C). We also analyzed IFN‐β‐induced gene expression in U6A cells stably expressing the phospho‐mimetic T387D mutant of STAT2. Compared with the wild‐type protein, the T387D mutant showed higher ISG induction in response to IFN‐β, similar to the effect of the T387A mutation (Fig 2B). Therefore, a phosphoryl group at T387, and not just a negative charge, is required for the negative regulatory effect on STAT2 function.
Figure 2. Threonine phosphorylation of T387 STAT2 negatively regulates type I IFN signaling.
-
AU6A cells expressing wild‐type or T387A STAT2 were treated with IFN‐β (100 IU/ml). Cells were harvested after 4 h, and total RNAs were analyzed by real‐time PCR. Values are the means ± SD from three independent experiments.
-
BU6A cells expressing wild‐type, T387A, or T387D STAT2 were treated with IFN‐β (100 IU/ml). Cells were harvested after 4 h, and total RNAs were analyzed by real‐time PCR. Values are the means ± SD from three independent experiments.
-
C, DU6A cells expressing wild‐type or T387A STAT2 were treated with IFN‐β for 0, 4, 8, or 24 h. Total RNAs were analyzed by using an Illumina HumanHT‐12 v4 Expression BeadChip array. The average signal for each probe was used to determine expression levels. Genes with average signals below 25 and detection P‐values > 0.01 in the untreated or treated cells were excluded from the analysis. Inductions of less than twofold were not scored. The Venn diagram shows the numbers of genes induced by 1.2‐fold or more in U6A cells expressing T387A STAT2, relative to untreated control cells. The numbers in the table are fold changes calculated from the ratios T387A STAT2 treated/untreated and wild‐type STAT2 treated/untreated.
Figure EV1. Tyrosine phosphorylation of STAT1 and STAT2 in U6A cells expressing wild‐type or T387A STAT2, and high expression of STAT2 does not change gene expression in response to IFN‐β.
-
AThe cells were treated with IFN‐α or IFN‐β (100 IU/ml) for 30 min or were untreated. Whole‐cell lysates were analyzed by Western blot.
-
B, C293T (B) or HME (C) cells expressing wild‐type or T387A STAT2 were treated with IFN‐β (100 IU/ml). Cells were harvested after 4 h, and RNAs were analyzed by real‐time PCR. Values are the means ± SD from three independent experiments.
We used an Illumina Gene Expression Array to understand in more detail how T387 phosphorylation affects ISG induction. mRNA preparations from U6A cells expressing wild‐type or T387A STAT2, treated with IFN‐β for 0, 4, 8, or 24 h, were analyzed. Of the 20,292 genes on the array, 124 were induced in cells containing wild‐type STAT2 after 4 h, 139 after 8 h, and 155 after 24 h. Of the total of 260 genes that responded to treatment with IFN‐β, 83 were induced more strongly in cells containing the T387A mutant than in cells containing wild‐type STAT2 (Fig 2C and Table EV1). A total of 13 genes (listed in Table 1) were preferentially induced at all three times. Most of these genes are well‐known ISGs, encoding proteins that are vital for IFN‐β‐induced functions, especially antiviral defense. Therefore, phosphorylation of T387 STAT2 regulates the transcriptional activity of ISGF3 negatively. We also compared the time courses of induction of many genes in U6A cells expressing T387A STAT2 to their induction in cells expressing the wild‐type protein (Fig 2D). The T387A mutation affects more genes at the early time of 4 h after treatment with IFN‐β than after 24 h.
Table 1.
Genes affected by STAT2 T387 phosphorylation in all time points of IFN‐β treatment
| Genes | WT STAT2 | T387A STAT2 | ||||
|---|---|---|---|---|---|---|
| 4 h | 8 h | 24 h | 4 h | 8 h | 24 h | |
| AIM2 | 6.01 | 14.64 | 6.21 | 16.28 | 32.59 | 15.09 |
| GBP1 | 3.76 | 13.88 | 7.00 | 9.77 | 25.11 | 8.88 |
| IFI35 | 2.74 | 6.24 | 10.17 | 4.19 | 8.56 | 13.25 |
| IFIH1 | 9.64 | 27.82 | 21.91 | 23.28 | 55.08 | 31.96 |
| IFIT2 | 35.58 | 76.20 | 33.66 | 105.96 | 161.63 | 49.25 |
| IFIT3 | 50.77 | 127.61 | 77.31 | 136.45 | 220.37 | 102.23 |
| IFITM1 | 5.19 | 14.18 | 35.10 | 6.81 | 17.67 | 43.66 |
| MASTL | 2.28 | 3.85 | 2.94 | 5.00 | 5.73 | 4.36 |
| OAS1 | 2.39 | 6.58 | 9.44 | 5.74 | 15.74 | 17.86 |
| OAS2 | 16.06 | 53.63 | 55.19 | 40.32 | 87.87 | 85.53 |
| SP110 | 3.30 | 5.76 | 4.30 | 4.43 | 8.29 | 5.78 |
| STAT1 | 3.49 | 8.96 | 11.45 | 5.91 | 11.49 | 14.52 |
| TNFSF13B | 3.20 | 7.76 | 5.68 | 6.48 | 25.12 | 10.39 |
U6A cells expressing wild‐type or T387A STAT2 were treated with IFN‐β for 0, 4, 8, or 24 h. Total RNAs were analyzed by using an Illumina HumanHT‐12 v4 Expression BeadChip array. The average signal for each probe was used to determine expression levels. Genes with average signals below 25 and detection P‐values > 0.01 in the untreated or treated cells were excluded from the analysis. Inductions of less than twofold were not scored. The number in the table is induction fold, calculated from the ratio of treated and untreated sample.
Phosphorylation of T387 of STAT2 compromises the ability of IFN‐β to inhibit virus replication and cancer cell growth
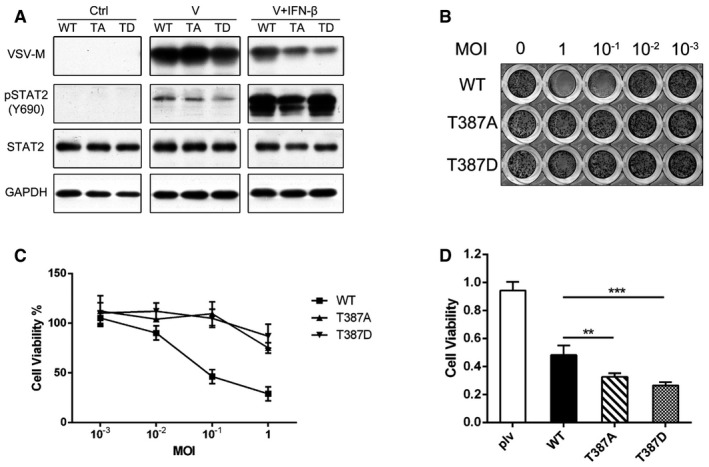
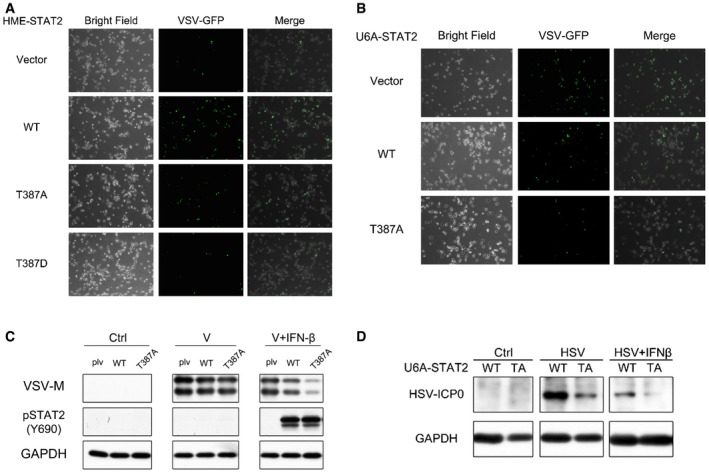
To determine whether the differences in gene expression between wild‐type and T387A STAT2 translate into an improved antiviral defense, we studied immortalized HME cells, which are derived from normal tissue and are not tumorigenic. Since the basal expression of STAT2 is low in HME cells, we stably expressed either Flag‐tagged wild‐type, T387A, or T387D STAT2, at comparable levels in these cells (Fig 3A). The cells were infected for 2 h with vesicular stomatitis virus (VSV), a negative single‐stranded RNA virus, with or without IFN‐β pre‐treatment. Without IFN‐β, all the cells were infected, as shown by the presence of GFP‐tagged VSV (Fig EV2A). We also quantified VSV‐M protein expression by Western blot (Fig 3A). In the presence of IFN‐β, expression of the viral M‐protein and virus replication was dramatically inhibited in HME cells expressing either T387A or T387D STAT2, compared to cells expressing wild‐type STAT2. A similar result was observed with U6A cells expressing wild‐type or mutant STAT2 proteins (Fig EV2B and C). We also examined the effect of preventing T387 phosphorylation after several cycles of virus replication. HME cells expressing wild‐type, T387A, or T387D STAT2 were infected with VSV at multiplicities of infection (MOI) from 10 to 10−3. VSV eventually lysed the infected cells, and we measured the number of cells surviving after 48 h by crystal violet staining and by using the Sigma MTT assay (Fig 3B and C). Cells expressing wild‐type STAT2 were killed completely at 10−1 MOI of VSV, but cells expressing T387A or T387D STAT2 were > 100 times more resistant to VSV in both assays. We also found that the expression of the herpes simplex virus (HSV) protein ICP0 was strongly inhibited by the T387A mutation, with or without treatment with exogenous IFN‐β (Fig EV2D). Together, these results reveal that the T387A and T387D mutants of STAT2 significantly enhance the antiviral response to IFN‐β.
Figure 3. Phosphorylation of T387 of STAT2 inhibits the antiviral and growth suppressive activities of IFN‐β.
-
AHME cells expressing wild‐type, T387A, or T387D STAT2 were seeded in 96‐well plates at 8,000 cells/well. The cells were exposed to vesicular stomatitis virus (VSV) for 2 h, with or without pre‐treatment with IFN‐β (100 IU/ml). After 20 h, the amounts of the VSV‐M and STAT2 proteins were analyzed by Western blot.
-
B, CHME cells expressing wild‐type, T387A, or T387D STAT2 were seeded in 96‐well plates at 8,000 cells/well. On the second day, the cells were treated with IFN‐β (10 IU/ml) for 2 h. The cells were then exposed to different multiplicities of infection of VSV for 2 h, followed by fresh media containing 10 IU/ml of IFN‐β. The cells were analyzed by staining with crystal violet (B) or the MTT assay (C) after 48 h. Values are the means ± SD from three independent experiments.
-
DU6A cells expressing wild‐type, T387A, or T387D STAT2 were placed into 96‐well plates (2,000 cells/well), and the cells were treated with IFN‐β (1,000 IU/ml) for 96 h. Cell survival was analyzed by the MTT assay. Values are the means ± SD from three independent experiments. One‐way ANOVA: ** P < 0.005, *** P < 0.001. Each experiment was carried out two independent times, with results similar to the representative examples that are shown.
Source data are available online for this figure.
Figure EV2. Phosphorylation of T387 STAT2 inhibits the antiviral effect of IFN‐β in HME and U6A cells.
-
AHME cells expressing wild‐type, T387A, or T387D STAT2 were seeded at 8,000 cells/well. The cells were exposed to VSV for 2 h, with or without pre‐treatment with IFN‐β (100 IU/ml). After 20 h, the expression of GFP from modified VSV was analyzed by microscopy.
-
B, CU6A cells expressing wild‐type or T387A STAT2 were seeded at 8,000 cells/well. The cells were exposed to VSV for 2 h, with or without pre‐treatment with IFN‐β (100 IU/ml). After 20 h, the expression of GFP from modified VSV was analyzed by microscopy (B) and the VSV‐M protein was analyzed by Western blot (C).
-
DU6A cells expressing wild‐type or T387A STAT2 were seeded at 8,000 cells/well. The cells were exposed to HSV for 2 h, with or without pre‐treatment with IFN‐β (100 IU/ml). After 20 h, the HSV ICP0 protein was analyzed by Western blot.
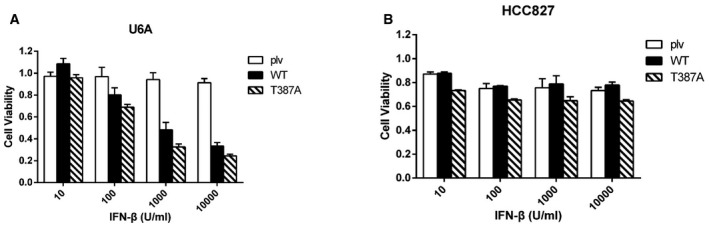
Type I IFNs also inhibit tumor cell proliferation by triggering cell cycle arrest and apoptosis. To investigate whether the phosphorylation of T387 impacts the effect of IFN‐β on cell growth, U6A cells expressing wild‐type or mutant STAT2 proteins were treated with IFN‐β for 96 h and cell viability was measured by the MTT assay (Fig EV3A). Expression of T387A or T387D STAT2 enhanced the cell growth inhibitory effect of IFN‐β by about 40%, compared to cells expressing wild‐type STAT2 (Fig 3D). A similar result was also observed with HCC827 cells expressing T387A or wild‐type STAT2 (Fig EV3B). Taken together, these results show that the lack of T387 phosphorylation sensitizes cells to IFN‐β and indicate that the phosphorylation of T387 is a crucial modification of STAT2 that compromises the ability of type I IFNs to inhibit virus replication and cell growth.
Figure EV3. Phosphorylation of T387 of STAT2 compromises the ability of IFN‐β to inhibit cancer cell growth.
-
A, BU6A (A) or HCC827 (B) cells expressing wild‐type or T387A STAT2 were placed into 96‐well plates (2,000 cells/well). The cells were incubated with IFN‐β (0, 10, 100, 1,000 or 10,000 IU/ml) for 96 h. Cell survival was analyzed by the MTT assay. Values are the means ± SD from three independent experiments.
Cell‐type specificity and kinetics of T387 STAT2 phosphorylation
We generated an antibody against a STAT2 peptide with phosphorylated T387 to allow us to investigate the level of T387 phosphorylation in different cells. Endogenous STAT2 from 293T and DLD1 (human colon carcinoma cells) was enriched by immunoprecipitation and analyzed with this antibody (Fig EV4A). From the mass spectrometric analysis, we found that about 85% of T387 is phosphorylated in 293T cells expressing Flag‐tagged STAT2 (Fig 1B). By determining the ratios of the signals in Western blots for phospho‐threonine 387 and total STAT2 in 293T cells, we calculated the percentage of STAT2 phosphorylated on T387 in other cells. We analyzed two immortalized normal human cell lines (HME cells and BJ foreskin fibroblasts) and five cancer cell lines (HCC827 non‐small‐cell lung adenocarcinoma cells, H1650 non‐small‐cell lung adenocarcinoma cells, MCF7 breast adenocarcinoma cells, SKBR3 breast adenocarcinoma cells, and LNCaP prostate adenocarcinoma cells). The steady‐state levels of T387 phosphorylation are high in HCC827 and HME cells, but low in H1650 and BJ cells (Figs 4A and EV4B). A high level of endogenous T387 phosphorylation inhibits the sensitivity of specific cells to type I IFN, compromising the ability of type I IFN to inhibit virus replication and cell growth in specific types of cells (Fig EV4C).
Figure EV4. Phosphorylation of STAT2 T387 in various cells.
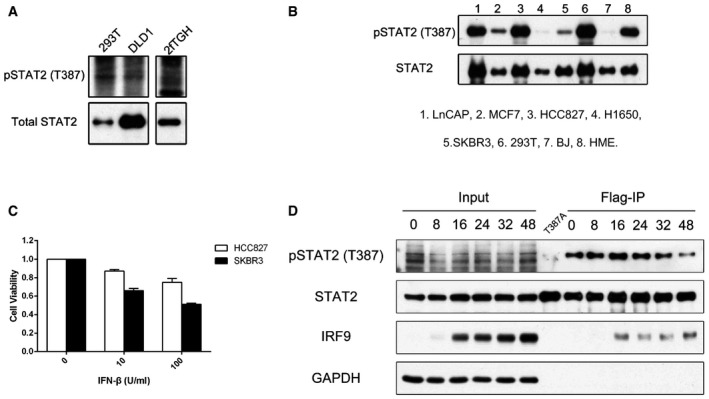
- Immunoprecipitations of STAT2 were performed with whole‐cell lysates of 293T, DLD1, and 2fTGH cells, and samples were analyzed by Western blot.
- STAT2, immunoprecipitated by means of a Flag tag from cells expressing wild‐type STAT2, was analyzed by Western blot. 1: LnCAP; 2: MCF7; 3: HCC827; 4: H1650; 5: SKBR3; 6: 293T; 7: BJ; 8: HME.
- HCC827 and SKBR3 cells were placed into 96‐well plates (2,000 cells/well), and the cells were treated with IFN‐β (1,000 IU/ml) for 96 h. Cell survival was analyzed by the MTT assay. Each experiment was carried out two independent times, with results similar to the representative examples that are shown. Values are the means ± SD from three independent experiments.
- STAT2 was immunoprecipitated by means of a Flag tag from U6A cells expressing wild‐type or T387A STAT2, treated with IFN‐β (100 IU/ml) at the times indicated. Cell extracts were analyzed by Western blot.
Figure 4. Kinetics of STAT2 T387 phosphorylation in response to IFN‐β and downregulation by CDK inhibitors.
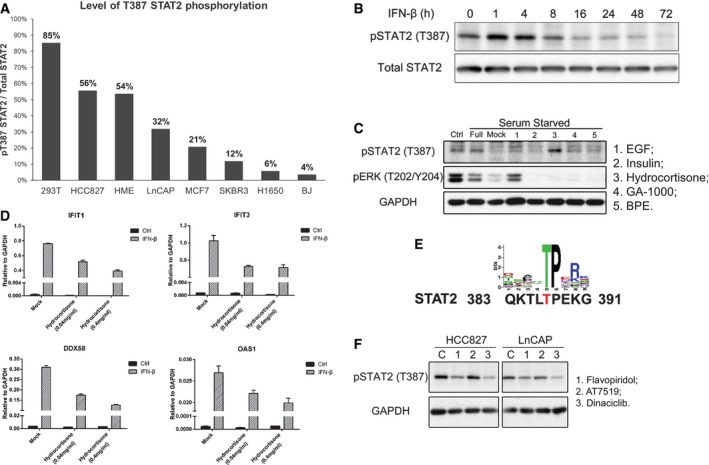
- An immunoprecipitation was performed using whole‐cell lysates from cells expressing Flag‐tagged wild‐type STAT2, and samples were analyzed by Western blot. The numbers in the chart are the proportions of T387‐phosphorylated STAT2 in each cell type, calculated in comparison with 293T cells.
- HME cells expressing wild‐type STAT2 were treated with IFN‐β (100 IU/ml). Whole‐cell lysates harvested at the times indicated were analyzed by Western blot.
- HME cells expressing wild‐type STAT2 were seeded in complete medium. On the second day, the cells were re‐fed with medium lacking supplements. On the third day, the cells were treated with each supplement for 4 h, and total lysates were analyzed by Western blot. 1: EGF; 2: insulin; 3: hydrocortisone; 4: GA‐1000; 5: BPE.
- HME cells were pre‐treated with hydrocortisone (0.04 and 0.4 mg/ml) for 3 h and then treated with IFN‐β (100 IU/ml). Cells were harvested after 4 h, and total RNAs were analyzed by real‐time PCR. Values are the means ± SD from three independent experiments.
- Consensus sequences for CDK‐catalyzed phosphorylation, compared to residues 383–391 of STAT2.
- HCC827 and LnCAP cells expressing wild‐type STAT2 were treated with CDK inhibitors (1 μM) for 4 h, and whole‐cell lysates were analyzed by Western blot. 1: flavopiridol; 2: AT7519; 3: dinaciclib.
Source data are available online for this figure.
Human mammary epithelial cells expressing wild‐type STAT2 were treated with IFN‐β for times ranging from 1 to 72 h (Fig 4B). The phosphorylation of T387 increased slightly after 1 and 4 h of treatment, and then decreased gradually at longer times. A similar result was observed with U6A cells expressing wild‐type STAT2 (Fig EV4D). These observations explain why the phosphorylation of T387 affects primarily the early induction of ISGs by IFN‐β.
The glucocorticoid signaling pathway affects T387 phosphorylation
Human mammary epithelial cells are cultured in a special medium containing five supplements, including EGF, GA1000 (Gentamicin and Amphotericin), BPE (Bovine Pituitary Extract), insulin, and hydrocortisone. Since we observed a high proportion of T387 phosphorylation before IFN‐β treatment, we postulated that one of the five supplements might be responsible. When we deprived the cells of all supplements, they stopped growing and the level of T387 phosphorylation decreased dramatically (Fig 4C). Replenishing all five components at once induced the phosphorylation of T387; when each component was added individually, only hydrocortisone induced this phosphorylation (Fig 4C, lane 3). Since the cells were re‐exposed to the supplements for only 4 h, we surmise that the phosphorylation of T387 of STAT2 is likely to be induced by glucocorticoid signaling. We also observed decreased T387 phosphorylation when we withdrew only hydrocortisone from the complete medium (Fig EV5A). To understand the function of hydrocortisone in type I IFN‐dependent signaling better, HME cells were pre‐treated with hydrocortisone and then treated with IFN‐β. As shown in Fig 4D, ISG induction is inhibited by hydrocortisone in a dose‐dependent manner. We conclude that hydrocortisone, which activates the glucocorticoid signaling pathway, induces T387 phosphorylation by an as yet unknown mechanism.
Figure EV5. ISG induction by IFN‐β in response to dinaciclib treatment and in the absence of STAT1.
- HME cells expressing wild‐type STAT2 were seeded in complete medium. On the second day, the medium was replaced with fresh medium lacking each component. On the third day, the cells were harvested and total lysates were analyzed by Western blot.
- HME cells were pre‐treated with dinaciclib (4 nM) for 3 h and then treated with IFN‐β (100 IU/ml). Cells were harvested after 4 h, and total RNAs were analyzed by real‐time PCR. Values are the means ± SD from three independent experiments.
- STAT1‐null U3A cells expressing wild‐type (WT) or T387A STAT2 were treated with IFN‐β (100 IU/ml). Cells were harvested after 4 h, and total RNAs were analyzed by real‐time PCR. Values are the means ± SD from three independent experiments.
CDKs are likely to catalyze T387 phosphorylation
We compared the amino acid sequence surrounding T387 in STAT2 to the sequences that are preferentially recognized by different kinases. Four kinase families, ERK, p38, JNK, and CDK, have consensus sequences containing a threonine–proline motif (Fig 4E). When we tested specific inhibitors against each, only the pan‐CDK inhibitor affected the phosphorylation of T387 (Fig 4F). We also tested whether this inhibitor enhanced ISG induction by limiting T387 phosphorylation. However, the inhibitor not only inhibited T387 phosphorylation but also entirely ablated ISG induction (Fig EV5B), making a conclusion impossible. We also used mass spectrometry to analyze proteins bound to STAT2 in U6A cells expressing wild‐type STAT2. CDK1 and CDK9 were identified in this analysis (Table EV2). In summary, it is likely that one or more kinases in the CDK family are responsible for T387 phosphorylation.
T387 phosphorylation negatively regulates the amount of ISGF3 bound to DNA
To test whether the phosphorylation of T387 affects the phosphorylation of STAT1 or STAT2 on tyrosine, we treated U6A cells expressing wild‐type or T387A STAT2 with IFN‐β for 30 min and then added staurosporine for 1–6 h more. This kinase inhibitor rapidly blocks further tyrosine phosphorylation, enabling analysis of the rate of decay of the initially phosphorylated residues. The T387A mutation did not affect either the initial phosphorylation of the tyrosine residues of STAT1 or STAT2 or their subsequent de‐phosphorylation (Fig 5A).
Figure 5. T387 phosphorylation negatively regulates the binding of ISGF3 to DNA .
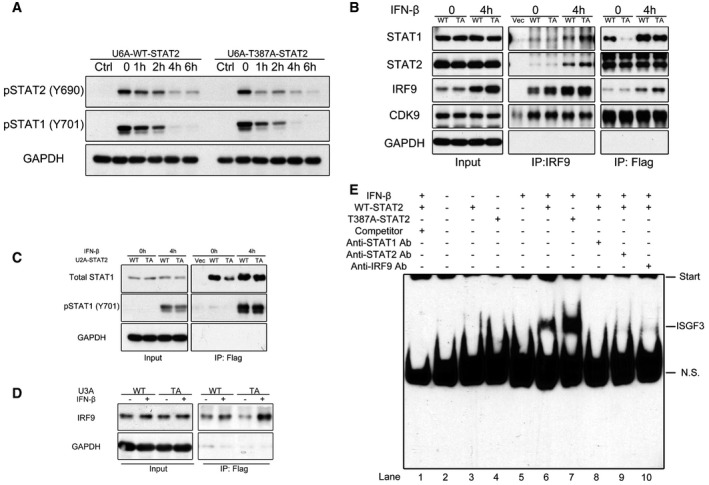
- U6A cells expressing wild‐type or T387A STAT2 were treated with IFN‐β (100 IU/ml) for 30 min or were untreated. The cells were washed with PBS, and the media was replaced with fresh media containing staurosporine (500 nM). Whole‐cell lysates were harvested and analyzed by Western blot.
- U6A cells expressing wild‐type or T387A STAT2 were treated with IFN‐β (100 IU/ml) for 4 h or were untreated. Whole‐cell lysates were used for immunoprecipitations of IRF9 and Flag‐STAT2.
- U2A cells expressing wild‐type or T387A STAT2 were treated with IFN‐β (100 IU/ml) for 4 h or were untreated. Whole‐cell lysates were used for immunoprecipitation of Flag‐STAT2.
- U3A cells expressing wild‐type or T387A STAT2 were treated with IFN‐β (100 IU/ml) for 4 h or were untreated. Whole‐cell lysates were used for immunoprecipitation of Flag‐tagged STAT2.
- EMSAs using an ISRE probe. Extracts from U6A cells expressing wild‐type or T387A STAT2 treated with IFN‐β for 1 h were analyzed. The position of ISGF3 is labeled.
Source data are available online for this figure.
In response to IFN‐β, STAT2, STAT1, and IRF9 combine to form ISGF3. We observed that more STAT1 and STAT2 were bound to IRF9 in IFN‐β‐treated cells containing the T387A mutant than in cells containing wild‐type STAT2 (Fig 5B, center). We also observed a strong interaction of CDK9 with STAT2 and IRF9, supporting the possibility that CDK9 phosphorylates T387. In untreated cells, the interaction of STAT2 and STAT1 was greatly inhibited by the T387A mutation (Fig 5B, right). We used IRF9‐null U2A cells (Li et al, 1996) to show that, without IFN‐β treatment and in the absence of IRF9, STAT2 lacking tyrosine phosphorylation (U‐STAT2) forms a heterodimer with U‐STAT1, and wild‐type U‐STAT2 binds to U‐STAT1 much more efficiently than T387A U‐STAT2 (Fig 5C). However, when the tyrosine residues of the two STATs were phosphorylated following treatment with IFN‐β for 4 h, the amount of P‐STAT1/P‐STAT2 heterodimer was similar for wild‐type and T387A mutant STAT2 (Fig 5C). We also tested the effect of STAT2 T387 phosphorylation in the absence of STAT1. More IRF9 was bound to STAT2 in IFN‐β‐treated cells expressing the T387A mutant than in cells expressing wild‐type STAT2 (Fig 5D). It has been reported previously that STAT2 can direct an ISGF3‐like transcriptional response in the absence of STAT1 (Blaszczyk et al, 2015). We also observed T387 phosphorylation negatively affects this non‐canonical function of STAT2 (Fig EV5C). These results indicate that the phosphorylation of T387 favors the formation of U‐STAT1/U‐STAT2 heterodimers at the expense of tyrosine‐phosphorylated heterodimers and ISGF3.
We used whole‐cell lysates for electrophoretic mobility shift assays (EMSAs) with an ISRE probe to assess the ability of ISGF3 to bind to DNA. In control U6A cells (which lack STAT2), ISGF3 does not form (Fig 5E, lanes 2 and 5). In U6A cells that express wild‐type STAT2, ISGF3 was detected readily (lanes 3 and 6), but there was much more ISGF3 (normalized to total protein) in the extract of cells expressing the T387A mutant of STAT2 (lane 7). Controls with unlabeled competitor DNA (lane 1) and with antibodies to STAT1, STAT2, or IRF9 (lanes 8–10) show that the indicated band is indeed ISGF3. We conclude that the amount of ISGF3 capable of binding to an ISRE sequence is greatly enhanced by the T387A mutation of STAT2, either because less ISGF3 is formed when T387 is phosphorylated, or because the threonine‐phosphorylated ISGF3 has a lower affinity for DNA, or both.
Discussion
We have found an important mechanism of inhibition of type I IFN‐dependent signaling by a novel post‐translational modification of STAT2, the phosphorylation of T387. Introducing the phosphorylation‐deficient T387A mutant protein into cells enhances the antiviral and anti‐proliferative effect of IFN‐β. The level of STAT2 T387 phosphorylation varies in different cells and decreases after long‐term treatment with IFN‐β. Hydrocortisone inhibits type I IFN‐dependent signaling by increasing STAT2 T387 phosphorylation, consistent with its well‐known function as a negative regulator of the immune response. CDKs, and especially CDK9, are responsible for phosphorylating T387 in untreated cells. T387 phosphorylation increases the level of U‐STAT1/U‐STAT2 heterodimers and decreases the amount of ISGF3 that is formed in response to IFN‐β (Fig 6).
Figure 6. A model of how phosphorylation of STAT2 on T387 regulates signaling in response to IFN‐β.
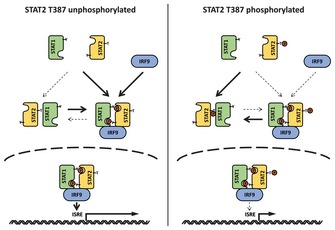
Although the structure of the U‐STAT1/U‐STAT2 heterodimer is not known, it is very likely to be different from that of the P‐STAT1/P‐STAT2 heterodimer and to resemble the antiparallel structure of the U‐STAT1 homodimer (Mao et al, 2005; Mertens et al, 2006). The anti‐parallel homodimer of U‐STAT1 is stabilized by reciprocal interactions between the coiled‐coil domain of one monomer and the DNA‐binding domain of the other (Mertens et al, 2006). An anti‐parallel conformation of U‐STAT1/U‐STAT2 would need to be rearranged to form functional ISGF3, in which the STAT1 and STAT2 moieties are parallel to each other. This need for this rearrangement can explain the delayed and weaker responses to type I IFN in cells expressing wild‐type STAT2, compared with cells expressing the T387A mutant protein. It is interesting that the phospho‐mimetic mutation T387D has an effect similar to that of T387A, suggesting that T387 phosphorylation functions through a specific mechanism, such as the one proposed above, and not simply by adding a negative charge to this residue.
Type I IFNs trigger an antiviral state by inducing the expression of genes whose products interfere with many stages of virus replication by many different mechanisms (Yan & Chen, 2012; McNab et al, 2015). We show that CDK inhibitors decrease T387 phosphorylation, and that the phosphorylation‐deficient T387A mutation increases biological responses to IFN‐β. Viruses achieve resistance to interferon by a variety of mechanisms, including the aberrant activation of certain kinases, and CDK inhibitors have been shown to be potential antiviral drugs by targeting cellular proteins rather than viral proteins (Schang et al, 2006). We find that CDK9 binds strongly to STAT2 and that CDK inhibitors reduce the phosphorylation of T387. Unlike the other CDKs, CDK9 is involved in the control of gene transcription rather than the cell cycle. It is important to note that a CDK9 inhibitor prevents replication of multiple DNA viruses (Yamamoto et al, 2014). Our work provides a rationale for using a CDK inhibitor as an antiviral agent in conjunction with type I IFN.
Type I IFN can inhibit cancer cell proliferation by inducing the expression of ISGs whose protein products lead to apoptosis and differentiation (Asmana Ningrum, 2014). Type I IFN also regulates the cell cycle by inhibiting the MEK‐ERK signaling pathway (Romerio et al, 2000). Endogenous IFN induced by DNA damage is required for cancer drugs to eliminate cancer cells (Yu et al, 2015). However, some cancer cells develop resistance to type I IFN, and we propose that T387 phosphorylation of STAT2 might be one of these mechanisms. Type I IFN also plays important roles in the development and maturation of immune cells (Zitvogel et al, 2015), and it has been reported that the response of immune cells to type I IFN is compromised by an unknown mechanism in different cancer patients (Critchley‐Thorne et al, 2009). Cancer cells might take advantage of their microenvironment by releasing cytokines and hormones that activate downstream kinases to phosphorylate STAT2 T387 in immune cells as well as cancer cells. In summary, the phosphorylation of T387 is not only a marker for measuring the responsiveness of cancer cells to type I IFN, but also a pharmaceutical target to sensitize cancer cells to treatment with type I IFNs.
The findings described in this study indicate that CDK inhibitors may accelerate and augment responses to type I IFNs by decreasing the phosphorylation of T387 of STAT2. Co‐administration of a CDK inhibitor and type I IFN might be a novel strategy for treating cancers such as melanoma, which respond significantly to this therapy (Asghar et al, 2015), and for treating multiple sclerosis and virus infections. Much more work remains to be done, including understanding how the phosphorylation of T387 modulates the interaction between U‐STAT1 and U‐STAT2, determining which CDKs catalyze T387 phosphorylation, and determining which phosphatases lead to T387 de‐phosphorylation in response to IFN‐β.
Materials and Methods
Cell culture
The human colon carcinoma cell line DLD1, HEK293T cells, the human fibrosarcoma cell line 2fTGH, the mammal epithelial cell line HME, the foreskin fibroblast cell line BJ, and the non‐small‐cell lung adenocarcinoma cell line HCC827 were obtained from the ATCC and grown in DMEM (Gibco‐BRL), supplemented with 5% FBS with penicillin (100 U/ml), and streptomycin (100 μg/ml). The non‐small‐cell lung adenocarcinoma cell line H1650, the breast adenocarcinoma cell line MCF7, the breast adenocarcinoma cell line SKBR3, and the prostate adenocarcinoma cell line LNCaP were obtained from the ATCC and grown in RPMI1640 (Gibco‐BRL), supplemented with 5% FBS with penicillin (100 U/ml), and streptomycin (100 μg/ml). The human normal mammary epithelial cell line hTERT‐HME1 was purchased from Clontech and grown in mammary epithelium growth media (MEGM) containing bovine pituitary extract, hydrocortisone, insulin, epithelial growth factor, and gentamycin/amphotericin‐B (Lonza). U6A, U2A, and U3A cells were described previously (Banninger & Reich, 2004).
Reagents
Human IFN‐β was from PBL Interferon Source. Mouse monoclonal antibodies against STAT2 (Santa Cruz Biotechnology) and IRF9 (ISGF3γ) (Santa Cruz Biotechnology), and rabbit polyclonal antibodies against Tyr 701‐phosphorylated STAT1 (Cell Signaling), Tyr 690‐phosphorylated STAT2 (Millipore), and STAT1 (Upstate) were used for Western analyses. Mouse monoclonal antibodies against STAT2 (Santa Cruz Biotechnology) and IRF9 (Santa Cruz Biotechnology) were used for immunoprecipitations. Hydrocortisone was from Sigma‐Aldrich. Staurosporine, flavopiridol, AT7519, and dinaciclib were from Selleckchem. SureBeads Protein A Magnetic Beads were from Bio‐Rad. Anti‐FLAG® M2 Magnetic Beads were from Sigma.
Mass spectrometry
STAT2 protein was purified from 293T cells expressing STAT2 Flag by using Anti‐FLAG® M2 Magnetic Beads (Sigma). For protein digestions, the bands were cut from the gels as closely as possible and washed and de‐stained in 50% ethanol, 5% acetic acid. The gel pieces were then dehydrated in acetonitrile, dried in a Speed‐vac, and digested by adding 5 μl 10 ng/μl of trypsin or chymotrypsin, in 50 mM ammonium bicarbonate, followed by incubation overnight. The peptides were extracted into two portions of 30 μl each 50% acetonitrile, 5% formic acid. The combined extracts were evaporated to < 10 μl in a Speed‐vac and then re‐suspended in 1% acetic acid to make up a final volume of ~30 μl for LC‐MS analysis. The LC‐MS system was a Finnigan LTQ‐Orbitrap Elite hybrid mass spectrometer system. The HPLC column was a Dionex 15 cm × 75 μm id Acclaim PepMap C18, 2 μm, 100 Å reversed‐phase capillary chromatography column. Five microliters of volume of the extract was injected and the peptides, eluted from the column in an acetonitrile, 0.1% formic acid gradient at a flow rate of 0.25 μl/min, were introduced into the source of the mass spectrometer online. The micro‐electrospray ion source was operated at 2.5 kV. The digest was analyzed in both a survey manner and a targeted manner. The survey experiments were performed using the data‐dependent multitask capability of the instrument, acquiring full scan mass spectra to determine peptide molecular weights and product ion spectra to determine amino acid sequences in successive instrument scans. The LC‐MS/MS data was searched with the programs Mascot and Sequest against both the full human reference sequence database and specifically against the sequence of Stat2. The parameters used in this search include a peptide mass accuracy of 10 ppm, fragment ion mass accuracy of 0.6 Da, carbamidomethylated cysteines as a constant modification, and oxidized methionine and phosphorylation at S, T, and Y as a dynamic modification. The results were filtered based on Mascot ion scores and Sequest XCorr scores. All positively identified phosphopeptides were manually validated. The targeted experiments involve the analysis of specific STAT2 peptides, including the phosphorylated and unmodified forms of the T387 peptides. The chromatograms for these peptides were plotted based on known fragmentation patterns, and the peak areas of these chromatograms were used to determine the extent of phosphorylation. The mass spectrometry data from this publication have been submitted to the PRIDE database and assigned the project accession PXD005008.
Real‐time PCR
cDNA was synthesized from total RNA using a modified manufacturer's protocol, with random hexamer and Superscript III (Invitrogen). Real‐time PCR was performed with EvaGreen qPCR master mix (Bullseye) in a LightCycler 480 (Roche). The PCR protocol was as follows: initial activation at 95°C for 5 min, 40 cycles at 95°C for 15 s, and 60°C for 1 min. C t values were converted into relative gene expression levels, compared to that of internal control gene GAPDH, using the ΔΔC t method or the standard curve method (Livak & Schmittgen, 2001).
The specificity was confirmed by analysis of the melting curves of the PCR products. The primer sequences used were as follows:
OAS1‐F, TGAGGTCCAGGCTCCACGCT;
OAS1‐R, GCAGGTCGGTGCACTCCTCG;
IFIT1‐F, TCTCAGAGGAGCCTGGCTAA;
IFIT1‐R, CCAGACTATCCTTGACCTGATGA;
IFIT3‐F, CAGAACTGCAGGGAAACAGC;
IFIT3‐R, TGAATAAGTTCCAGGTGAAATGGC;
DDX58‐F, AAACAAATCAGAACACAGGAATG;
DDX58‐R, CCTCTGCCTCTGGTTTGG.
Gene expression analysis
Total RNA was isolated by using a Qiagen RNeasy Mini Kit according to the manufacturer's instructions, and 1 μg of this RNA was used for microarray analysis on an Illumina HumanHT‐12 v4 Expression BeadChip Kit. Data were analyzed by using the Illumina BeadStudio software and normalized by the quantile method. Genes were selected that satisfied the following criteria: differential P‐values of ≤ 0.01, average signals > 25, and signals that changed by > twofold. The average signal for each probe was used to determine expression levels. Genes with average signals below 25 and detection P‐values > 0.01 in the untreated or treated cells were excluded from the analysis. Inductions of less than twofold were not scored. The microarray data from this publication have been submitted to the GEO database (http://www.ncbi.nlm.nih.gov/geo/query/acc.cgi?acc=GSE87090) and assigned the GEO accession number GSE87090.
Virus preparation and infection
Vesicular stomatitis virus (VSV) and VSV‐GFP virus were titrated as previous described (Fensterl et al, 2014). For the infection, cells were cultured in serum‐free medium, and the viruses were inoculated at the multiplicities of infection indicated in the figures. Two hours later, cells were washed with PBS and fresh culture medium was added. Cells were harvested 20 h after infection.
Herpes simplex virus (HSV1 KOS strain) was titrated by using the TCID50 assay (Blaho et al, 2005). Virus infections were performed as previously described (Fensterl et al, 2014).
Cell survival assay
Cell cultures were assayed for survival using the Sigma MTT method, according to the manufacturer's instructions. Briefly, the reagent was added directly to the culture medium. After 4 h, the medium was removed, neat DMSO was added to extract the reagent, and the signal was read with a fluorometer.
Preparation and purification of antibodies against T387‐phosphorylated STAT2 peptides
Anti‐pT387 STAT2 antibody was raised with peptides representing human STAT2 residues 380–397, with and without phosphorylation of T387. The sequence is TSNQKTLTPEKGQSQGLI. The antibody was prepared and purified by Shanghai Immune Biotech.
Western blots
Whole‐cell extracts were prepared by incubating cell pellets in lysis buffer containing 50 mM Tris–HCl, pH 7.4, 150 mM NaCl, 1 mM EDTA, 0.5% Triton X‐100, and a mixture of protease and phosphatase inhibitors (Roche). After incubation on ice for 20 min, cell debris was removed by centrifugation. Cell extracts containing equal quantities of proteins, determined by the Bradford method, were separated by SDS/PAGE [10% (vol/vol) acrylamide] and transferred to polyvinylidene difluoride membranes (Millipore). The membranes were incubated with primary antibody for 2 h, followed by incubation with secondary antibody for 1 h at room temperature, and developed by using the enhanced chemiluminescence solution (Perkin‐Elmer).
Immunoprecipitations
Cell pellets were suspended in a nuclear extraction buffer containing 50 mM Tris–HCl, pH 7.4, 150 mM NaCl, 1 mM EDTA, 0.5% Triton X‐100 with proteinase/phosphatase inhibitors. Whole‐cell lysates (1 mg) were precleared with Protein A/G PLUS Agarose (Santa Cruz) and incubated with 3 μg of mouse monoclonal antibodies overnight. The antibody‐bound proteins were precipitated with SureBeads Protein A Magnetic Beads (Bio‐Rad), washed with PBS, and boiled with loading buffer containing 0.9% β‐mercaptoethanol.
EMSAs
U6A cells transfected with empty vector, wild‐type STAT2, or T387A STAT2 were left untreated or treated for 60 min with IFN‐β (100 IU/ml). Whole‐cell extracts were prepared with the Nuclear Extract Kit (Active Motif). The probe with 5′‐TGAC‐3′ overhangs at the 5′ ends was labeled with the Biotin 3′ End DNA Labeling Kit (Thermo Scientific). ISRE (ISG15), 5′‐GGGAAAGGGAAACCGAAACTGA‐3′ and 5′‐TTCAGTTTCGGTTTCCCTTTCCC‐3′. The DNA‐binding reaction and native polyacrylamide gel electrophoresis were performed following the instructions for Gelshift Chemiluminescent EMSA (Active Motif). The protein composition of IFN‐β‐induced complexes was determined by performing a super‐shift assay, using antibodies to STAT1 (Upstate; diluted 1:1,000), STAT2 (Santa Cruz; diluted 1:1,000), or IRF9 (Santa Cruz; diluted 1:1,000). The competition EMSA was done as described, using a 500‐fold molar excess of unlabeled probe.
Author contributions
YW, JY, and GRS designed the research; YW, JN, BW, and XW performed the research; YW, JN, BW, XW, JY, and GRS analyzed the data; YW and GRS wrote the manuscript.
Conflict of interest
The authors declare that they have no conflict of interest.
Supporting information
Expanded View Figures PDF
Table EV1
Table EV2
Review Process File
Source Data for Figure 3
Source Data for Figure 4
Source Data for Figure 5
Acknowledgements
VSV‐GFP and HSV were kindly provided by Dr. G Sen, Cleveland Clinic. We thank the Genomics Core of the Lerner Research Institute, Cleveland Clinic, who performed microarray analyses. This work was funded by National Institutes of Health Grants PO1 CA062220 (to G.R.S), National Natural Science Foundation of China Grant 31571439, and Ocean University of China “Zhufeng Talented Professionals” start‐up fund (to J.Y.). The Orbitrap Elite instrument was purchased via an NIH shared instrument grant, 1S10RR031537‐01 (to B.W.).
The EMBO Journal (2017) 36: 202–212
Contributor Information
Jinbo Yang, Email: yangjb@ouc.edu.cn.
George R Stark, Email: starkg@ccf.org.
References
- Asghar U, Witkiewicz AK, Turner NC, Knudsen ES (2015) The history and future of targeting cyclin‐dependent kinases in cancer therapy. Nat Rev Drug Discovery 14: 130–146 [DOI] [PMC free article] [PubMed] [Google Scholar]
- Asmana Ningrum R (2014) Human interferon alpha‐2b: a therapeutic protein for cancer treatment. Scientifica (Cairo) 2014: 970315 [DOI] [PMC free article] [PubMed] [Google Scholar]
- Banninger G, Reich NC (2004) STAT2 nuclear trafficking. J Biol Chem 279: 39199–39206 [DOI] [PubMed] [Google Scholar]
- Bhattacharya S, Eckner R, Grossman S, Oldread E, Arany Z, D'Andrea A, Livingston DM (1996) Cooperation of Stat2 and p300/CBP in signalling induced by interferon‐alpha. Nature 383: 344–347 [DOI] [PubMed] [Google Scholar]
- Blaho JA, Morton ER, Yedowitz JC (2005) Herpes simplex virus: propagation, quantification, and storage. Curr Protocol Microbiol 14E.1.1–14E.1.23 [DOI] [PubMed] [Google Scholar]
- Blaszczyk K, Olejnik A, Nowicka H, Ozgyin L, Chen YL, Chmielewski S, Kostyrko K, Wesoly J, Balint BL, Lee CK, Bluyssen HA (2015) STAT2/IRF9 directs a prolonged ISGF3‐like transcriptional response and antiviral activity in the absence of STAT1. Biochem J 466: 511–524 [DOI] [PMC free article] [PubMed] [Google Scholar]
- Bluyssen HA, Levy DE (1997) Stat2 is a transcriptional activator that requires sequence‐specific contacts provided by stat1 and p48 for stable interaction with DNA. J Biol Chem 272: 4600–4605 [DOI] [PubMed] [Google Scholar]
- Critchley‐Thorne RJ, Simons DL, Yan N, Miyahira AK, Dirbas FM, Johnson DL, Swetter SM, Carlson RW, Fisher GA, Koong A, Holmes S, Lee PP (2009) Impaired interferon signaling is a common immune defect in human cancer. Proc Natl Acad Sci USA 106: 9010–9015 [DOI] [PMC free article] [PubMed] [Google Scholar]
- Dasgupta M, Dermawan JK, Willard B, Stark GR (2015) STAT3‐driven transcription depends upon the dimethylation of K49 by EZH2. Proc Natl Acad Sci USA 112: 3985–3990 [DOI] [PMC free article] [PubMed] [Google Scholar]
- Decker T, Kovarik P (2000) Serine phosphorylation of STATs. Oncogene 19: 2628–2637 [DOI] [PubMed] [Google Scholar]
- Fensterl V, Wetzel JL, Sen GC (2014) Interferon‐induced protein Ifit2 protects mice from infection of the peripheral nervous system by vesicular stomatitis virus. J Virol 88: 10303–10311 [DOI] [PMC free article] [PubMed] [Google Scholar]
- Leung S, Qureshi SA, Kerr IM, Darnell JE Jr, Stark GR (1995) Role of STAT2 in the alpha interferon signaling pathway. Mol Cell Biol 15: 1312–1317 [DOI] [PMC free article] [PubMed] [Google Scholar]
- Li X, Leung S, Qureshi S, Darnell JE Jr, Stark GR (1996) Formation of STAT1‐STAT2 heterodimers and their role in the activation of IRF‐1 gene transcription by interferon‐alpha. J Biol Chem 271: 5790–5794 [DOI] [PubMed] [Google Scholar]
- Livak KJ, Schmittgen TD (2001) Analysis of relative gene expression data using real‐time quantitative PCR and the 2(‐Delta Delta C(T)) Method. Methods 25: 402–408 [DOI] [PubMed] [Google Scholar]
- Mao X, Ren Z, Parker GN, Sondermann H, Pastorello MA, Wang W, McMurray JS, Demeler B, Darnell JE Jr, Chen X (2005) Structural bases of unphosphorylated STAT1 association and receptor binding. Mol Cell 17: 761–771 [DOI] [PubMed] [Google Scholar]
- McNab F, Mayer‐Barber K, Sher A, Wack A, O'Garra A (2015) Type I interferons in infectious disease. Nat Rev Immunol 15: 87–103 [DOI] [PMC free article] [PubMed] [Google Scholar]
- Mertens C, Zhong M, Krishnaraj R, Zou W, Chen X, Darnell JE Jr (2006) Dephosphorylation of phosphotyrosine on STAT1 dimers requires extensive spatial reorientation of the monomers facilitated by the N‐terminal domain. Genes Dev 20: 3372–3381 [DOI] [PMC free article] [PubMed] [Google Scholar]
- Park C, Li S, Cha E, Schindler C (2000) Immune response in Stat2 knockout mice. Immunity 13: 795–804 [DOI] [PubMed] [Google Scholar]
- Platanias LC (2005) Mechanisms of type‐I‐ and type‐II‐interferon‐mediated signalling. Nat Rev Immunol 5: 375–386 [DOI] [PubMed] [Google Scholar]
- Romerio F, Riva A, Zella D (2000) Interferon‐alpha2b reduces phosphorylation and activity of MEK and ERK through a Ras/Raf‐independent mechanism. Br J Cancer 83: 532–538 [DOI] [PMC free article] [PubMed] [Google Scholar]
- Schang LM, St Vincent MR, Lacasse JJ (2006) Five years of progress on cyclin‐dependent kinases and other cellular proteins as potential targets for antiviral drugs. Antiviral Chem Chemother 17: 293–320 [DOI] [PubMed] [Google Scholar]
- Steen HC, Nogusa S, Thapa RJ, Basagoudanavar SH, Gill AL, Merali S, Barrero CA, Balachandran S, Gamero AM (2013) Identification of STAT2 serine 287 as a novel regulatory phosphorylation site in type I interferon‐induced cellular responses. J Biol Chem 288: 747–758 [DOI] [PMC free article] [PubMed] [Google Scholar]
- Tang X, Gao JS, Guan YJ, McLane KE, Yuan ZL, Ramratnam B, Chin YE (2007) Acetylation‐dependent signal transduction for type I interferon receptor. Cell 131: 93–105 [DOI] [PubMed] [Google Scholar]
- Walter MR, Bordens R, Nagabhushan TL, Williams BR, Herberman RB, Dinarello CA, Borden EC, Trotta PP, Pestka S, Pfeffer LM (1998) Review of recent developments in the molecular characterization of recombinant alfa interferons on the 40th anniversary of the discovery of interferon. Cancer Biother Radiopharm 13: 143–154 [DOI] [PubMed] [Google Scholar]
- Yamamoto M, Onogi H, Kii I, Yoshida S, Iida K, Sakai H, Abe M, Tsubota T, Ito N, Hosoya T, Hagiwara M (2014) CDK9 inhibitor FIT‐039 prevents replication of multiple DNA viruses. J Clin Invest 124: 3479–3488 [DOI] [PMC free article] [PubMed] [Google Scholar]
- Yan N, Chen ZJ (2012) Intrinsic antiviral immunity. Nat Immunol 13: 214–222 [DOI] [PMC free article] [PubMed] [Google Scholar]
- Yang J, Huang J, Dasgupta M, Sears N, Miyagi M, Wang B, Chance MR, Chen X, Du Y, Wang Y, An L, Wang Q, Lu T, Zhang X, Wang Z, Stark GR (2010) Reversible methylation of promoter‐bound STAT3 by histone‐modifying enzymes. Proc Natl Acad Sci USA 107: 21499–21504 [DOI] [PMC free article] [PubMed] [Google Scholar]
- Yu Q, Katlinskaya YV, Carbone CJ, Zhao B, Katlinski KV, Zheng H, Guha M, Li N, Chen Q, Yang T, Lengner CJ, Greenberg RA, Johnson FB, Fuchs SY (2015) DNA‐damage‐induced type I interferon promotes senescence and inhibits stem cell function. Cell Rep 11: 785–797 [DOI] [PMC free article] [PubMed] [Google Scholar]
- Zitvogel L, Galluzzi L, Kepp O, Smyth MJ, Kroemer G (2015) Type I interferons in anticancer immunity. Nat Rev Immunol 15: 405–414 [DOI] [PubMed] [Google Scholar]
Associated Data
This section collects any data citations, data availability statements, or supplementary materials included in this article.
Supplementary Materials
Expanded View Figures PDF
Table EV1
Table EV2
Review Process File
Source Data for Figure 3
Source Data for Figure 4
Source Data for Figure 5