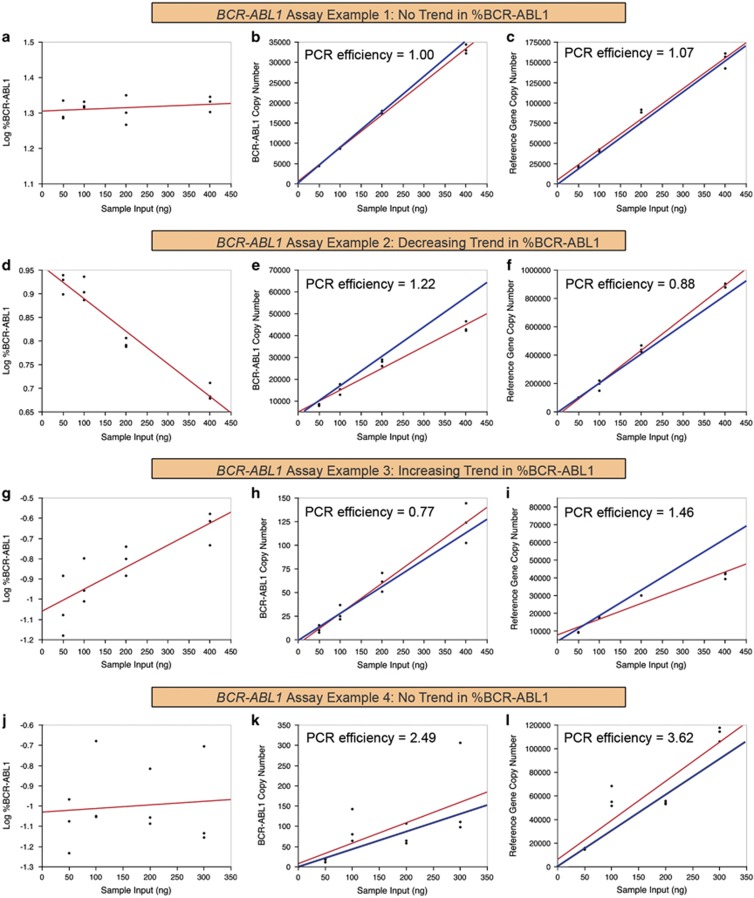
Figure 3.
Examples of different assay results from Study 1 of the multi-center evaluation study. A properly optimized assay should yield similar %BCR-ABL1 results at different sample inputs and both the BCR-ABL1 and reference gene assays should have a PCR efficiency close to 1 (a–c). Some assays showed decreasing %BCR-ABL1 measurements with increasing sample input (d–f), whereas others showed increasing %BCR-ABL1 measurements instead (g–i). The PCR efficiency of these assays tended to be suboptimal (<0.9 or >1.1), resulting in disproportional increase of BCR-ABL1 or reference gene copy number with increasing sample input (e, f, h and i), which subsequently led to the unstable %BCR-ABL1 measurements (d and g). Occasionally, BCR-ABL1 and reference gene assays that were suboptimal in a similar manner could cancel each other's defects, to achieve artificially stable %BCR-ABL1 measurements (j–l). Red lines represent the linear regression fit based on actual data and blue lines represent what ideal data should resemble.

