Abstract
Introduction:
Glycated hemoglobin (HbA1c) can be altered in different conditions. We hypothesize that HbA1c levels may change due to altered thyroid status, possibly due to changes in red blood cell (RBC) turnover.
Objectives:
The objective of this study was to determine the effects of altered thyroid status on HbA1c levels in individuals without diabetes, with overt hyper- and hypo-thyroidism, and if present, whether such changes in HbA1c are reversed after achieving euthyroid state.
Methods:
Euglycemic individuals with overt hypo- or hyper-thyroidism were selected. Age- and sex-matched controls were recruited. Baseline HbA1c and reticulocyte counts (for estimation of RBC turnover) were estimated in all the patients and compared. Thereafter, stable euthyroidism was achieved in a randomly selected subgroup and HbA1c and reticulocyte count was reassessed. HbA1c values and reticulocyte counts were compared with baseline in both the groups.
Results:
Hb A1c in patients initially selected was found to be significantly higher in hypothyroid group. HbA1c values in hyperthyroid patients were not significantly different from controls. HbA1c reduction and rise in reticulocyte count were significant in hypothyroid group following treatment without significant change in glucose level. Hb A1c did not change significantly following treatment in hyperthyroid group. The reticulocyte count, however, decreased significantly.
Conclusion:
Baseline HbA1c levels were found to be significantly higher in hypothyroid patients, which reduced significantly after achievement of euthyroidism without any change in glucose levels. Significant baseline or posttreatment change was not observed in hyperthyroid patients. Our study suggests that we should be cautious while interpreting HbA1c data in patients with hypothyroidism.
Keywords: Assay interpretation, HbA1c, thyroid function
INTRODUCTION
Glycated hemoglobin (HbA1c) has been considered as an important marker of long-term glycemic control. In the recent past, the American Diabetes Association has suggested the use of HbA1c as diagnostic tool for prediabetes and diabetes. A value between 5.7% and 6.5% represents prediabetes while a value ≥6.5% is considered as diabetes mellitus. Several factors other than glycemic status can influence HbA1c levels, including altered red blood cell (RBC) turnover. RBC turnover is increased in thyrotoxic states whereas hypothyroidism has the opposite effect. We hypothesize that HbA1c levels may change due to altered thyroid status, possibly due to changes in RBC turnover. Therefore, we measured HbA1c levels in hypothyroid and thyrotoxic individuals who do not have diabetes or prediabetes based on fasting and 2 h postglucose plasma glucose criteria. We also followed up some of the patients and measured HbA1c again after euthyroidism was achieved.
Aims and objectives
The objective of our study was to determine the effects of altered thyroid status on HbA1c levels in individuals without diabetes, and with overt hyper-and hypo-thyroidism. We would, thereafter, follow up the patients and see if such changes in HbA1c are reversed after achieving euthyroid state.
METHODOLOGY
The study was carried out in Department of Endocrinology and Metabolism, IPGME and R and SSKM Hospital, Kolkata; and was approved by the Institutional Ethics Committee. Informed consent was taken from the individuals. It was conducted over a period of 2 years (December 2010–November 2012). Patients from both genders, between 18 and 60 years of age, who were diagnosed to have overt primary hypo- or hyper-thyroidism and were treatment naive, were recruited as cases.
Overt primary hypothyroidism was defined as free T4 below the lower limit of normal range and thyroid stimulating hormone (TSH) more than 15 µ/ml. Hyperthyroidism was defined as free T4 and/or T3 above the upper limit of normal range with suppressed TSH.
Patients with diabetes (defined as fasting plasma glucose ≥126 mg/dl [7 mmol/L] or 2 h post 75 g glucose plasma glucose ≥200 mg/dl [11.1 mmol/L]), impaired glucose tolerance (IGT) (defined as 2 h post 75 g glucose plasma glucose between 140 and 199 mg/dl [7.8–11 mmol/L]), or impaired fasting glucose (defined as fasting plasma glucose between 100 and 125 mg/dl [5.6–6.9 mmol/L]) were excluded from the study. Both the fasting and oral glucose tolerance test (OGTT) were done on single day. Patients with hemoglobin <10 g/dl, known hemoglobinopathies, renal failure (creatinine clearance < 60 ml/min), significant hepatic dysfunction (increased bilirubin [>1 mg/dl], reduced albumin [<3.5 mg/dl], or alanine aminotransferase and aspartate aminotransferase 3 times upper limit of normal), acute or subacute thyroiditis, patients who are on aspirin or Vitamin C (>500 mg/day), and pregnant patients, were all excluded.
Age- and gender-matched healthy euthyroid and euglycemic persons were recruited as controls.
At the start of the study, assuming that a difference in HbA1c of 0.5% among baseline subgroup would be clinically meaningful and assuming that the standard deviation (SD) would be ≤0.5% and keeping the power at 80% and P = 0.05; the sample size needed was calculated to be 17.
The patients thus selected (47 hypothyroid, 34 hyperthyroid and 46 controls) additionally underwent tests for estimation of HbA1c and reticulocyte count. HbA1c was measured at the baseline using ion-exchange high-performance liquid chromatography method using Bio-Rad D 10 HbA1c program which is certified by National Glycohemoglobin Standardization Program as having documented traceability to the Diabetes Control and Complications Trial reference method. The reportable range for HbA1c on the D-10 HbA1c program is 3.8%–18.5% (19–179 mmol/mol) (i.e., it shows linearity in this range). Interassay coefficient of variation of the test was 0.9%–1.2%. Serum triglyceride up to 5500 mg/dl (62 mmol/L), bilirubin up to 20 mg/dl (342 µmol/L), carbamylated hemoglobin up to 2%, and fetal hemoglobin levels up to 10% have no clinically significant effect on HbA1c using this system. The HbA1c was compared between hypo- and hyper-thyroid patients with age- and gender-matched healthy control population.
We could not follow all the patients due to logistic constraints. Moreover, for the before and after analysis for follow-up, the sample size needed was estimated to be 10, keeping the power at 80% and P = 0.05, assuming that a change in HbA1c of 0.5% would be clinically meaningful and an expected SD of 0.5%. Thus, we decided to follow-up randomly selected 30 overtly hypothyroid and 30 thyrotoxic patients from the aforementioned selected patient population. Thus, we decided to follow-up randomly selected 30 overtly hypothyroid and 30 hyperthyroid patients from the aforementioned selected patient population. They were followed up every 6 weeks. All hypothyroid patients were treated with levothyroxine. Six of the hyperthyroid patients opted for surgery and were excluded from the study. The rest of the hyperthyroid patients were treated with carbimazole therapy. HbA1c was rechecked after establishment and stabilization of euthyroid status for at least 3 months. It was at this point that HbA1c was rechecked and median HbA1c levels were compared with their own baseline values. Fasting plasma glucose, 2-h OGTT, hemoglobin, and reticulocyte count were also rechecked.
The baseline variables were compared using the unpaired Student's t-test and Mann–Whitney rank sum test as applicable. The paired Student's t-test and the Wilcoxon signed rank test were used to compare variables before and after treatment as applicable. Rates and proportions among categorical variables were calculated using Chi-square test. Pearson correlation analysis was conducted to assess associations between variables. P < 0.05 was considered statistically significant. Sigma stat 3.5 software (Jandel Scientific Software) was used for statistical analysis. Results were adjusted for potential confounders such as hemoglobin using the same software.
RESULTS
Fifty-nine hypothyroid and 58 hyperthyroid patients were initially screened, of whom 12 and 24 patients were excluded, respectively [Figure 1].
Figure 1.
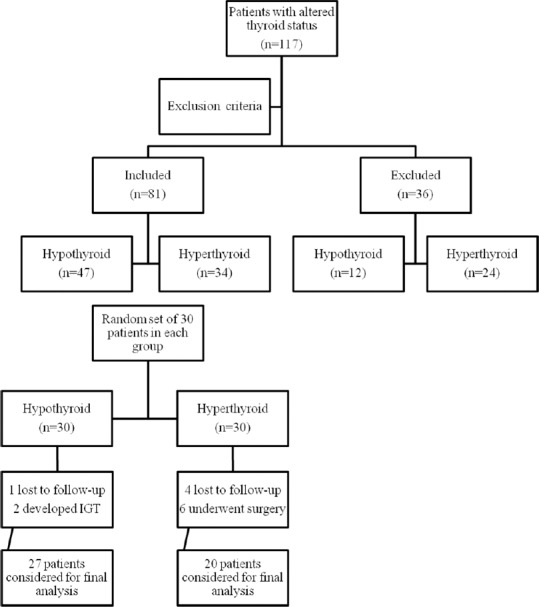
Consort diagram
Table 1 shows the baseline characteristics of patients initially selected. This shows that there was no significant difference in fasting and 2 h post 75 g glucose plasma glucose values between the groups.
Table 1.
Baseline characteristics

HbA1c in patients initially selected were found to be significantly higher in hypothyroid group – (median ± interquartile range 5.6 ± 0.07 [38 ± mmol/mol] [hypothyroid] vs. 5.2 ± 0.04 [33 ± 3 mmol/mol] [controls]; P < 0.001) [Figure 2]. HbA1c values in hyperthyroid patients were not significantly different from controls (median ± interquartile range 5.3 ± 0.5 [34 ± 4 mmol/mol] [hyperthyroid] vs. 5.2 ± 0.04 [33 ± 3 mmol/mol] [controls]; P = 0.174) [Figure 2]. These observations remained unaltered even after adjustment for hemoglobin.
Figure 2.
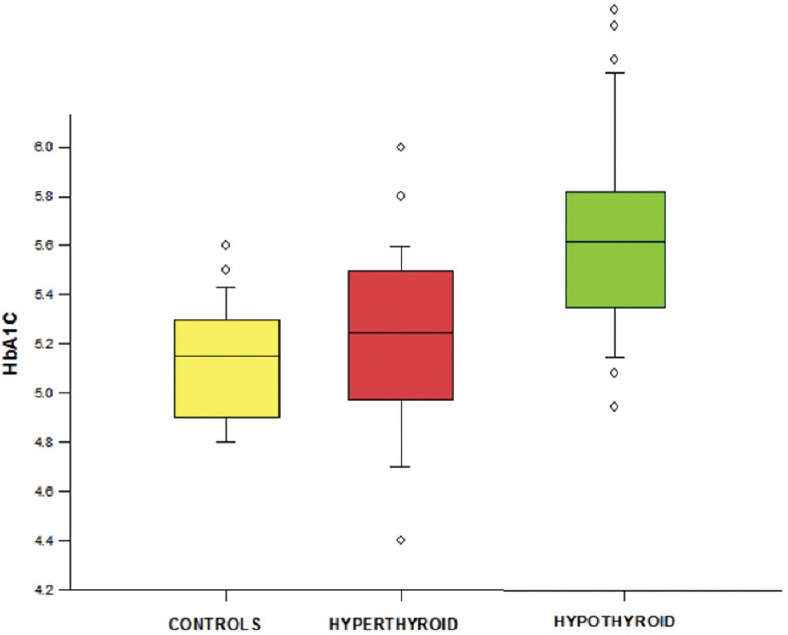
Comparison of baseline glycated hemoglobin between groups
Baseline mean reticulocyte count did not differ significantly between hyperthyroid (mean ± SD –1.48 ± 0.49) and control population (mean ± SD –1.33 ± 0.54). Mean reticulocyte count was lower in hypothyroid patients (mean ± SD –1.02 ± 0.5) than controls and the difference was tending toward significance (P = 0.07). Moreover, there was a significant inverse correlation of HbA1c with reticulocyte count in hypothyroid patients with a correlation coefficient of 0.502 and a P = 0.0003 [Figure 3].
Figure 3.
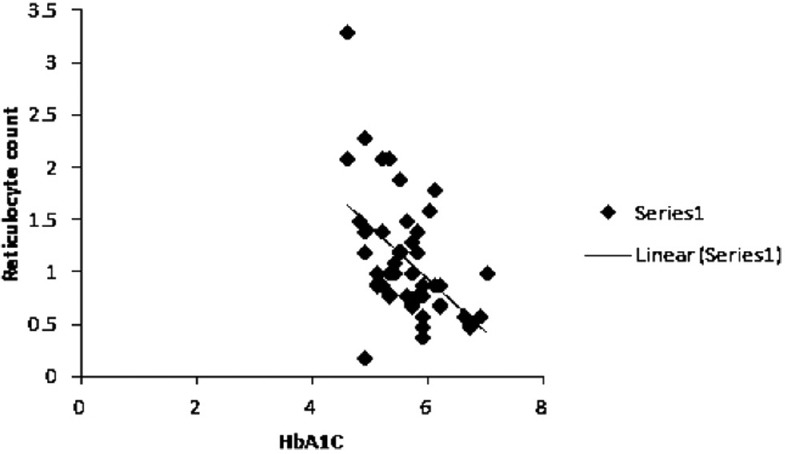
Correlation between glycated hemoglobin and reticulocyte count of hypothyroid patients at baseline
In the second part of the study, two patients in hypothyroid group developed IGT during follow-up and were excluded from analysis. One hypothyroid and four hyperthyroid patients were lost to follow-up. Twenty-seven hypothyroid and 20 hyperthyroid patients were considered for final analysis. Mean follow-up time was 21.3 ± 3.1 weeks for hypothyroid group and 22.6 ± 3.7 weeks for hyperthyroid group.
None of the groups had significantly different fasting and post 75 g OGTT plasma glucose values at baseline and posttreatment.
HbA1c reduction was significant in hypothyroid group following treatment and achievement of euthyroid state (median ± interquartile range 5.7 ± 0.75 [39 ± 8 mmol/mol] [pretreatment] vs. 5.4 ± 0.75 [36 ± 8 mmol/mol] [posttreatment]; P < 0.001) [Figure 4]. Reticulocyte count increased significantly following treatment in hypothyroid patients (0.9 ± 0.575 vs. 1.9 ± 0.77; P < 0.001).
Figure 4.
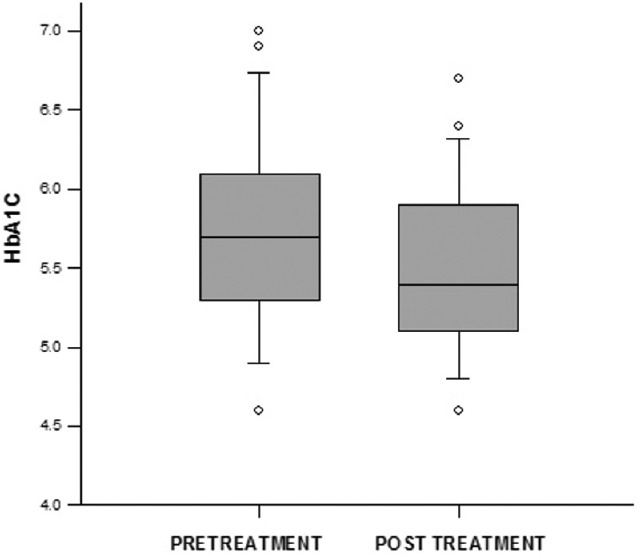
Glycated hemoglobin change following treatment of hypothyroidism
Change in HbA1c values in the hypothyroid group following achievement of euthyroid state was no longer statistically significant when adjusted for changes in reticulocyte count (5.58 vs. 5.74 [37 vs. 39 mmol/mol]; P = 0.37).
HbA1c did not change significantly following treatment in hyperthyroid group. (Median ± interquartile range 5.35 ± 0.45 [35 ± 4 mmol/mol] [pretreatment] vs. 5.35 ± 0.3 [35 ± 3 mmol/mol] [posttreatment]; P = 0.323) [Figure 5]. The reticulocyte count, however, decreased significantly after treatment in hyperthyroid group, (1.485 ± 0.56 vs. 1.035 ± 0.39; P < 0.001).
Figure 5.
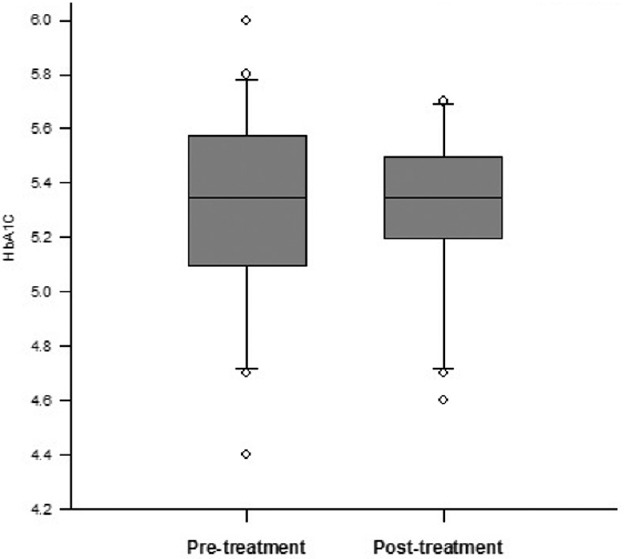
Glycated hemoglobin change following treatment of hyperthyroidism
At baseline, 23 out of 47 (48.9%) of our hypothyroid patient showed HbA1c level of ≥5.7 (39 mmol/mol) whereas 2 out of 34 (5.9%) patient of hyperthyroid group and 1 out of 46 (2.2%) among controls had HbA1c ≥5.7 (i.e., HbA1c criterion for prediabetes). Among 27 hypothyroid patients who were followed up, 17 had HbA1c ≥5.7 at the baseline. Six of those 17 patients had values <5.7 at the end of the study.
DISCUSSION
In our study, median baseline HbA1c level was found to be significantly higher in overt hypothyroid patients in comparison to matched control population despite having similar glycemic status. Median HbA1c value was decreased significantly following replacement of thyroid hormone. Our findings were in keeping with the observations by Kim et al.[1] This effect was possibly due to low RBC turnover in hypothyroid patient.[2] The difference of HbA1c between control and hypothyroid patients at baseline was higher in our study than the study by Kim et al. This may be due to the shorter duration of hypothyroidism in their patients (4 weeks postthyroidectomy) than ours (most of whom had possibly longer natural history of disease). A study by Anantarapu et al. also demonstrated false elevation of HbA1c values in patients with hypothyroidism which was lowered by thyroid hormone replacement without any change in fasting or OGTT values.[3]
The reticulocyte count increased following replacement of thyroid hormone. Even though there was a difference in HbA1c in hypothyroid patients before and after achievement of stable euthyroidism, this difference was no longer statistically significant when adjusted for reticulocyte count, suggesting that altered RBC turnover is responsible for altered HbA1c levels in hypothyroid patients.
In contrast, hyperthyroid patients had similar median HbA1c value in comparison to controls at the baseline. We propose that this could possibly be due to promotion of glycation by malondialdehyde which is produced by lipid peroxidation induced by excessive thyroid hormones.[4,5] This phenomenon might have counterbalanced an increased RBC turnover seen in hyperthyroid patients. Median HbA1c value did not change significantly after treatment of hyperthyroidism despite significant change in reticulocyte count.
A limitation of our study was that we could not measure RBC turnover directly with investigation like Chromium 51 tagged RBC assay and used reticulocyte count for indirect estimation of RBC turnover. We also could not measure malondialdehyde level.
HbA1c is an important tool for monitoring of glycemic status in diabetic patients. Recently, ADA has proposed its use in diagnosis of diabetes and prediabetes.[6] 48.9% of our hypothyroid patient showed discrepant result for diagnosis of prediabetes using plasma glucose (fasting and after 75 g oral glucose load) and HbA1c level of ≥5.7 (39 mmol/mol). In contrast, 5.9% patient of hyperthyroid group and 2.2% among controls showed this discrepancy. In the second part of the study (who were followed up), 17 out of 27 patients in hypothyroid group had HbA1c ≥5.7 at the baseline. Six of those 17 patients had values <5.7 at the end of the study. Findings of our study suggest that we should be cautious while interpreting HbA1c data in patients with hypothyroidism.
CONCLUSION
Baseline HbA1c levels were found to be significantly higher in hypothyroid patients compared to control individuals despite similar glucose levels. HbA1c reduced significantly with treatment in hypothyroid patients without a significant change in glucose levels. Significant baseline or posttreatment change was not observed in hyperthyroid patients. Our study suggests that HbA1c data should be interpreted with caution in patients with hypothyroidism.
Financial support and sponsorship
Nil.
Conflicts of interest
There are no conflicts of interest.
Acknowledgment
We acknowledge the grant provided by Research Society for the Study of Diabetes in India, West Bengal, Chapter for this study.
REFERENCES
- 1.Kim MK, Kwon HS, Baek KH, Lee JH, Park WC, Sohn HS, et al. Effects of thyroid hormone on A1C and glycated albumin levels in nondiabetic subjects with overt hypothyroidism. Diabetes Care. 2010;33:2546–8. doi: 10.2337/dc10-0988. [DOI] [PMC free article] [PubMed] [Google Scholar]
- 2.Fein HG, Rivlin RS. Anemia in thyroid diseases. Med Clin North Am. 1975;59:1133–45. doi: 10.1016/s0025-7125(16)31963-0. [DOI] [PubMed] [Google Scholar]
- 3.Anantarapu S, Vaikkakara S, Sachan A, Phaneendra BV, Suchitra MM, Reddy AP, et al. Effects of thyroid hormone replacement on glycated hemoglobin levels in non diabetic subjects with overt hypothyroidism. Arch Endocrinol Metab. 2015;59:495–500. doi: 10.1590/2359-3997000000065. [DOI] [PubMed] [Google Scholar]
- 4.Mohan Kumar KM, Bobby Z, Selvaraj N, Kumar Das A, Chandra Koner B, Sen SK, et al. Possible link between glycated hemoglobin and lipid peroxidation in hyperthyroidism. Clin Chim Acta. 2004;342:187–92. doi: 10.1016/j.cccn.2003.12.027. [DOI] [PubMed] [Google Scholar]
- 5.Jain SK, Palmer M. The effect of oxygen radicals metabolites and Vitamin E on glycosylation of proteins. Free Radic Biol Med. 1997;22:593–6. doi: 10.1016/s0891-5849(96)00377-2. [DOI] [PubMed] [Google Scholar]
- 6.American Diabetes Association. Clinical practice recommendations 2012. Diabetes Care. 2012;35:S11–63. [Google Scholar]


