
Fig. 5.
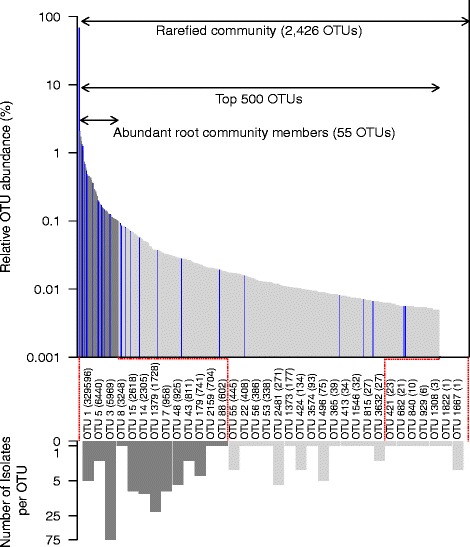
Mapping of reference stock bacteria to root microbiome OTUs. The upper bar graph represents the relative abundance of the 2426 OTUs in the root-associated bacteria community of Trifolium, with the 500 most abundant OTUs shown in gray bars. The dark gray bars indicate the 55 most abundant root OTUs (mean RA >0.1%). The blue bars indicate OTUs for which at least one isolate is present in the reference stock. The lower, inverted bar graph indicates the number of isolates in the reference stock mapping to an OTU in the community profile. Bars are shaded the same as in the upper graph to indicate the relative abundance of each OTU. Bars are labeled with the representative OTU name and its total number of sequences in the community profile in parentheses