Significance
The absence of fully reproducible protein aggregation assays has contributed to the systematic failures in clinical trials for Alzheimer’s disease (AD) of compounds targeting the aggregation process of the amyloid-β peptide (Aβ). To address this problem, we report the identification of a library of compounds against Aβ aggregation using a drug discovery strategy based on highly quantitative aggregation rate measurements. We then demonstrate, both in Caenorhabditis elegans and human cerebrospinal fluid, that this approach can systematically provide a rich variety of related small molecules to take forward into a drug discovery process. We therefore report an approach that should substantially help overcome the very high level of attrition associated with drug discovery programs for AD.
Keywords: Alzheimer’s disease, amyloid-β peptide, protein misfolding, drug discovery, protein aggregation
Abstract
The aggregation of the 42-residue form of the amyloid-β peptide (Aβ42) is a pivotal event in Alzheimer’s disease (AD). The use of chemical kinetics has recently enabled highly accurate quantifications of the effects of small molecules on specific microscopic steps in Aβ42 aggregation. Here, we exploit this approach to develop a rational drug discovery strategy against Aβ42 aggregation that uses as a read-out the changes in the nucleation and elongation rate constants caused by candidate small molecules. We thus identify a pool of compounds that target specific microscopic steps in Aβ42 aggregation. We then test further these small molecules in human cerebrospinal fluid and in a Caenorhabditis elegans model of AD. Our results show that this strategy represents a powerful approach to identify systematically small molecule lead compounds, thus offering an appealing opportunity to reduce the attrition problem in drug discovery.
Alzheimer’s disease (AD) is, to date, an incurable neurodegenerative disorder that imposes substantial social and economic costs worldwide (1). According to the amyloid hypothesis, the aggregation of the amyloid-β peptide (Aβ) initiates a cascade of molecular events leading eventually to neuronal death (2–11). Because the presence of abnormal Aβ metabolism can be detected 10–20 years before the onset of AD (12, 13), early interventions may be possible before widespread and irreversible neurodegeneration has occurred. Although targeting Aβ accumulation has been pursued as a major potential therapeutic strategy against AD (14–17), no compound selected for this purpose has yet entered clinical use (18, 19).
Although these failures have raised doubts about the amyloid hypothesis (20), they can also be attributed to an incomplete knowledge of the molecular mechanisms by which the compounds tested so far affect the nucleation and growth of Aβ aggregates. Indeed, it has been shown that inhibiting Aβ aggregation without a detailed understanding of the underlying microscopic processes could affect the toxicity in unexpected ways (21, 22). For example, the inhibition of nucleation events may delay or decrease toxicity, whereas the inhibition of elongation may lead to an overall increase in toxicity (21, 22). Therefore, effective therapeutic strategies must be aimed at targeting precise microscopic steps during the Aβ aggregation process (21, 23–25).
We describe here the development of a systematic pipeline based on chemical kinetics to identify a pool of candidate molecules directed against the aggregation of the 42-residue form of Aβ (Aβ42), and to understand the key chemical features responsible for their inhibitory activity.
Results and Discussion
A Quasi-Structure–Based Drug Discovery Strategy.
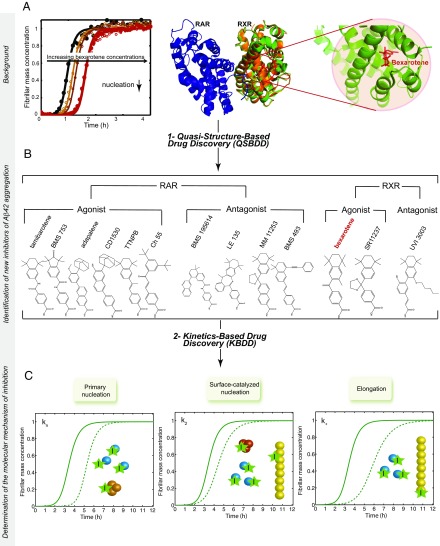
We introduce first a quasi-structure–based drug discovery (QSBDD) strategy, which builds on the recent finding that the small molecule bexarotene delays primary nucleation in Aβ42 aggregation (22) (Fig. 1A). Because primary nuclei form only transiently during the aggregation process (21, 23, 24), it is extremely challenging to characterize their structures experimentally, making it difficult to apply to them structure-based drug discovery strategies. The structural features of these transient nuclei, however, may be shared with other biological targets of bexarotene, which was initially identified as a retinoid X receptor (RXR) agonist and approved by the US Food and Drug Administration for the treatment of cutaneous T-cell lymphoma (26). Ligands that bind RXRs and their partners, the retinoid A receptors (RARs), modulate the communication of these receptors with their intracellular environments (27, 28). The mechanisms of binding of the ligands to the RAR and RXR ligand-binding domains (LBDs) are well understood and are exploited for pharmaceutical purposes (27, 29). We took advantage of the data available on the atomic structures of the LBDs and the chemical properties of the known agonists and antagonists of RARs and RXRs, and applied QSBDD by presuming that, like bexarotene, other RXR and RAR ligands may inhibit the aggregation of Aβ42. We thus collected a group of 12 small molecules (Fig. 1B), including five RAR agonists (tamibarotene, BMS753, adapalene, CD1530, TTNPB, and Ch55), four RAR antagonists (BMS195614, LE135, MM11253, and BMS493), two RXR agonists (bexarotene and SR11237), and one RXR antagonist (UVI3003). We tested these compounds in a thioflavin-T (ThT)-based chemical kinetics assay and compared their effects on the different microscopic steps in the Aβ42 aggregation reaction (Fig. 1C).
Fig. 1.
Schematic illustration of the drug discovery strategy targeting Aβ42 aggregation described in this work. The strategy consists of two main steps: (i) a QSBDD step and (ii) a kinetics-based drug discovery (KBDD) step. QSBDD consists of identifying potential molecules against Aβ42 aggregation based on the structure of a receptor (here, RXR) of a small molecule (here, bexarotene) shown preferentially to inhibit a microscopic step in Aβ42 aggregation (here, primary nucleation). The rationale behind this strategy is that the instability and transient nature of Aβ42 oligomers make their characterization and, subsequently, the structure-based drug development very challenging. In this study, we considered known agonists and antagonists of RXR based on the possibility that structural similarities could exist between the binding pockets of RXR and Aβ42 oligomers. The strategy was extended to include agonists and antagonists of RAR, given the high structural similarities with RXR. In total, 13 molecules were tested, including bexarotene. (A) This panel is adapted from a study by Habchi et al. (22) and shows the kinetics of 5 μM Aβ42 aggregation (black) in the presence of increasing concentrations of bexarotene (i.e., 1–5 M eq). The structure [Protein Data Bank (PDB) ID code 1XDK] of the RAR receptor (blue) is shown as a dimer with the RXR receptor (orange). The RXR subunit is superimposed onto the subunit of RXR with bexarotene in the binding pocket (green; PDB ID code 4K6I). An enlarged image of the binding pocket is also shown. (B) Structures of all the molecules tested in this study. (C) The KBDD step assesses the effect of a small molecule at the microscopic level. (C) A given molecule can bind monomers, primary oligomers, secondary oligomers, fibrils, or a combination of species, and accordingly affects different microscopic steps that can be characterized quantitatively by global fitting of the aggregation kinetics. The solid lines correspond to the aggregation kinetics of Aβ42 in the absence of an inhibitor. The dotted lines correspond to the kinetics of Aβ42 in the presence of inhibitors that affect a single microscopic step.
RAR and RXR Ligands Inhibit Aβ42 Aggregation to Different Extents.
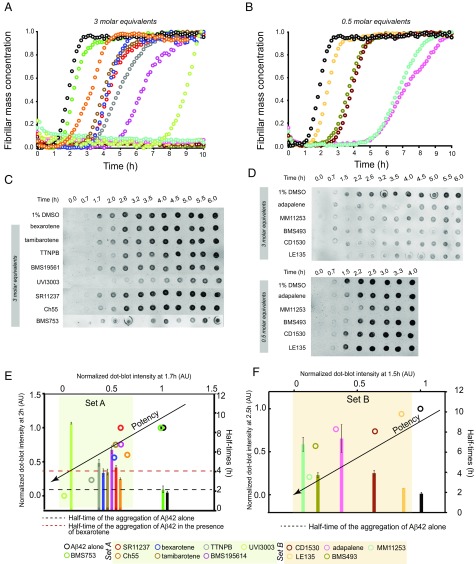
We monitored Aβ42 fibril formation in vitro for 2 μM Aβ42 in the absence and presence of these small molecules. For Aβ42 alone the half-time of aggregation was about 2 h under the buffer conditions used. For each compound except BMS753, we observed substantial delays in Aβ42 aggregation when the compounds were included at a concentration of 6 μM [3 molar equivalents (M eq)] (Fig. 2A). In most cases, the delays were greater than those assessed for bexarotene, and five of the 12 molecules (MM11253, BMS493, adapalene, CD1530, and LE135) inhibited the aggregation of Aβ42 completely over 10 h of observation (Fig. 2A). These five compounds were very effective in delaying the aggregation of Aβ42 even at substoichiometric ratios (0.5 M eq; Fig. 2B). To investigate these effects further and to exclude possible interferences of the compounds with ThT binding to Aβ42 fibrils and the fluorescence measurements, we probed the quantities of Aβ42 fibrils at 12 time points during the aggregation reaction in the absence and presence of the small molecules using a dot-blot assay with an Aβ42 fibril-specific antibody (OC; see Methods) (Fig. 2 C and D and Fig. S1). The delay induced by the small molecules in the dot-blot assay was found to be identical within experimental error to the delay observed in the ThT-based assay.
Fig. 2.
RAR and RXR ligands affect Aβ42 aggregation to different extents. (A) Kinetic profiles of the aggregation of a 2 μM solution of Aβ42 in the absence and presence of 3 M eq of RAR and RXR ligands, shown in different colors. Note that Aβ42 did not aggregate within 10 h in the presence of five of the 13 molecules, seen as flat lines. (B) Kinetic profiles of 2 μM Aβ42 aggregation in the absence and presence of substoichoimetric ratios of the five molecules that are shown as flat lines in A. (C and D) Comparative time course of the formation of 2 μM Aβ42 fibrils in the absence and presence of 3 M eq of the small molecules using a dot-blot assay. Aβ42 in (D, Top) did not aggregate in the presence of 3 M eq of adapalene, MM11253, BMS493, CD1530, and LE135; therefore, the aggregation kinetics of 2 μM Aβ42 were repeated in the presence of substoichiometric quantities of the same molecules (0.5 M eq) (D, Bottom). The plots show, as histograms, the half-times of the aggregation reactions of Aβ42 from A and B and, as open circles, the correlation between the normalized dot-blot intensities with respect to the correlation in the presence of 1% DMSO at 1.6 h and 2 h (E) and 1.5 h and 2.5 h (F) of the aggregation reactions from C and D. The molecules were separated into two sets according to their potency, which was evaluated based on the extent of the delay that they induced in Aβ42 aggregation. (E) Set A (highlighted in light green) contains the molecules showing an effect similar to or greater than that of bexarotene (the half-time of Aβ42 aggregation in the absence and presence of bexarotene are highlighted with dotted black and red lines, respectively). AU, arbitrary units. (F) Molecules classified as set B (highlighted in light orange) inhibited the aggregation of Aβ42 completely within 10 h in the presence of 3 M eq of the small molecules.
Fig. S1.
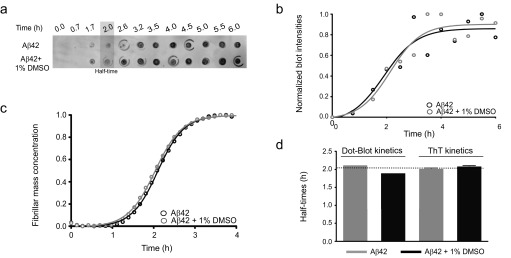
Characterization of the effects of DMSO on Aβ42 aggregation by ThT-based kinetics and immunochemistry. (A) Time course of the formation of 2 μM Aβ42 fibrils as assessed by the fibril-specific OC antibody in the absence and the presence of 1% DMSO. The OC antibody probes fibrillar structures that have started to form roughly around 2 h. (B) Quantitative time course showing the evolution of the fibril formation of 2 μM Aβ42 based on the intensities of the dot-blot assay from A in the absence and presence of 1% DMSO. (C) ThT-based kinetics of 2 μM Aβ42 in the absence and presence of 1% DMSO as a function of time. (D) Comparative analysis between the half-times derived from either the dot-blot intensities (B) or the ThT-based kinetics (C) showing similar values (i.e., 2 h), and thus excluding an effect of 1% DMSO on the aggregation kinetics.
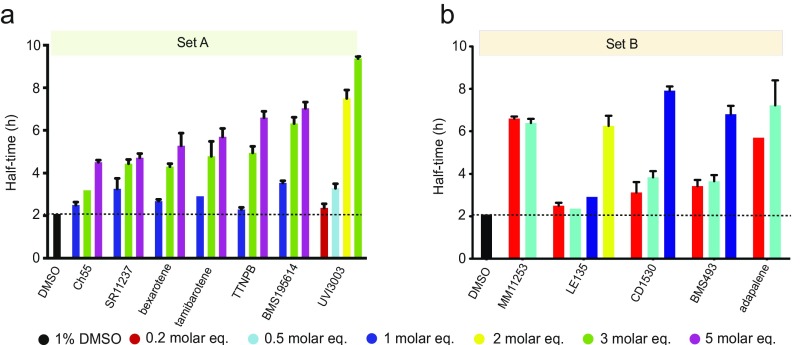
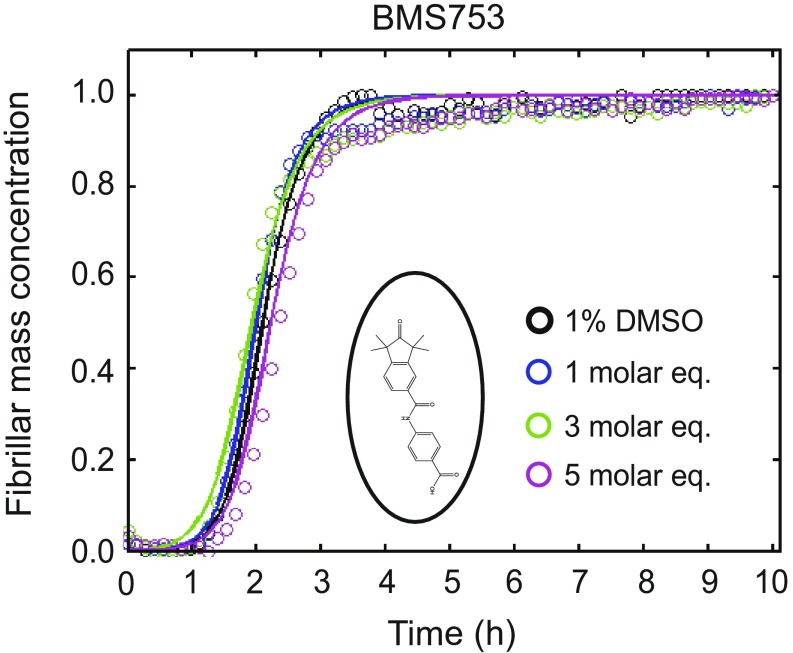
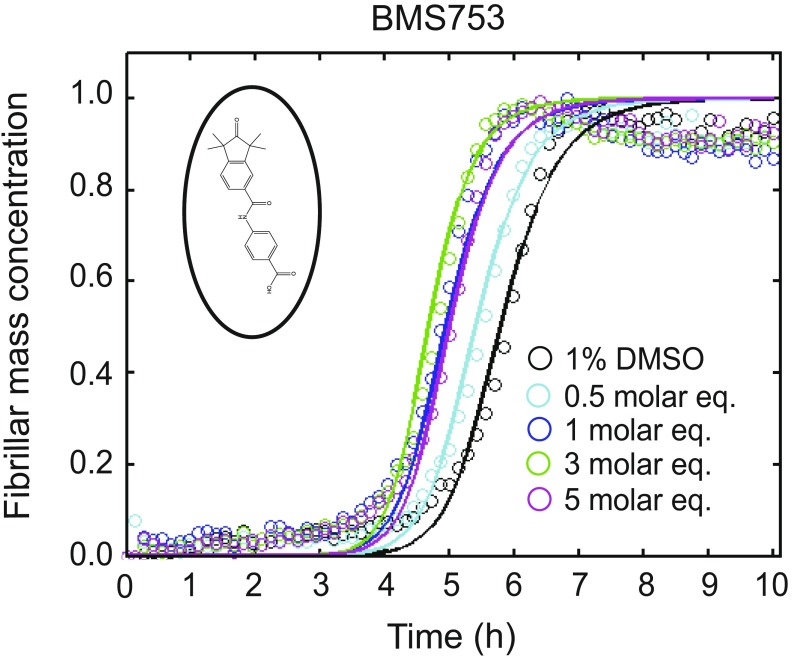
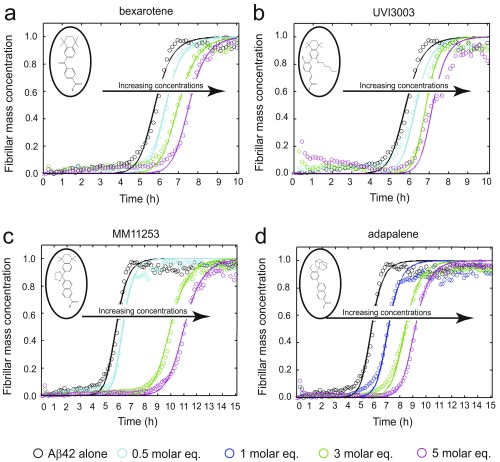
We subsequently classified these molecules according to their efficacy in inhibiting Aβ42 aggregation. The intensities of the dot blots (Fig. 2 C and D) were quantified and normalized against the intensity of Aβ42 alone. The values at two early time points were plotted against the half-times derived from the ThT-based kinetics (Fig. 2 E and F), resulting in a linear correlation, showing the high degree of consistency between the two assays. This analysis allowed the classification of the RAR and RXR ligands in two sets according to the extent of the delay induced in Aβ42 aggregation (Fig. 2 E and F). Set A consists of seven molecules showing an effect at 3 M eq similar to or greater than the effect of bexarotene (Fig. 2E, light green), and set B consists of five molecules that completely inhibited Aβ42 aggregation for at least 10 h at 3 M eq. We then analyzed the effects of these molecules at substoichiometric concentrations by both assays (Fig. 2F, light orange). UVI3003 was identified as the most effective molecule within set A, delaying by more than fourfold the aggregation reaction, whereas MM11253 and adapalene were found to be the most effective molecules within set B, because the aggregation of 2 μM Aβ42 was delayed by at least threefold at a concentration half of the concentration of Aβ42. Furthermore, RAR and RXR ligands inhibited Aβ42 reaction in a concentration-dependent manner, with set B molecules showing efficacy at concentration ratios as low as 0.2 (Fig. S2). The only molecule that did not show any effect on Aβ42 aggregation was BMS753, even when present at 5 M eq (Fig. S3).
Fig. S2.
Dose-dependent effects of set A (A) and set B (B) molecules on the half-times of the aggregation reaction of Aβ42.
Fig. S3.
Effect of BMS753 on Aβ42 aggregation. Kinetic profiles of the aggregation of a 2 μM Aβ42 solution in the absence and presence of either 1% DMSO (black) or 1 (blue), 3 (green), and 5 (purple) M eq of BMS753. BMS753, the structure of which is shown in an open circle, did not show any effect on the aggregation of Aβ42 similar to the results obtained with the dot-blot assay (Fig. 1).
RAR and RXR Ligands Inhibit Primary and Secondary Pathways.
We next carried out a quantitative analysis of the effects of the molecules by matching the experimental aggregation profiles to kinetic curves obtained by using the rate laws derived from a master equation that relates the time evolution of fibril formation to the rate constants of the different microscopic events (21, 24, 25). In this approach, the aggregation profiles in the presence of an inhibitor are described by introducing into the rate laws suitable perturbations to each of the microscopic rate constants evaluated in the absence of the inhibitor. The modifications of the rate constants required to describe the aggregation profiles in the presence of different concentrations of inhibitor are then indicative of the specific process affected by the presence of the compound (21).
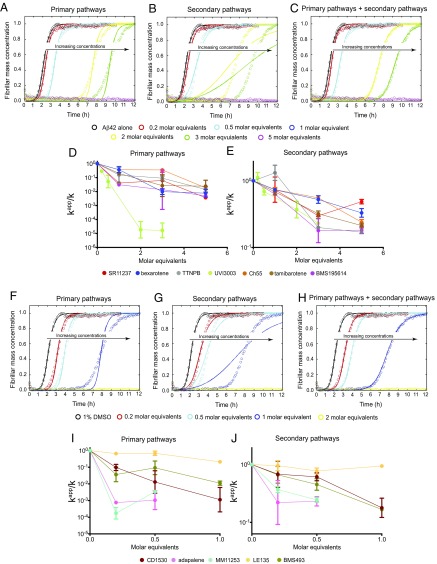
At low concentrations of small molecules, the data are extremely well described when the primary pathways [as expressed by the product of the of primary nucleation and rate of elongation (knk+)] are specifically decreased at less than a 3 M eq of set A and less than 0.5–1 M eq of set B molecules, where k+ is the rate constant of fibril elongation and kn is the rate constant for primary nucleation (Fig. 3 A–C and F–H and Figs. S4 and S5). By contrast, at higher concentrations of small molecules, the data are consistent with a decrease in the rate constants of both primary (knk+) and secondary (k2k+) pathways, where k2 is the rate constant of surface-catalyzed secondary nucleation. All kinetic curves were then compared with simulations where both primary and secondary pathways were decreased concomitantly, and the rates of both pathways were plotted against the concentration of small molecules (Fig. 2 A–J and Figs. S4 and S5). This analysis revealed that set A and set B molecules can affect both nucleation pathways in Aβ42 aggregation (Fig. 2 A–J and Figs. S4 and S5).
Fig. 3.
Characterization of the effects of set A and set B molecules on Aβ42 aggregation using quantitative chemical kinetics. (A–C) Kinetic profiles of the aggregation of 2 μM Aβ42 in the absence and presence of either 1% DMSO (black) or 0.2 (red), 0.5 (cyan), 1 (blue), 2 (yellow), 3 (green), or 5 (magenta) M eq of UVI3003, a representative molecule of set A. The solid lines show predictions for the resulting reaction profiles when primary pathways (A, knk+), secondary pathways (B, k2k+), or both pathways (C) are inhibited by UVI3003. The abbreviation kn is the rate of primary nucleation, k+ is the rate of elongation, and k2 is the rate of secondary nucleation. Only predictions when both pathways are inhibited fit the experimental data well. The dependence of the apparent reaction rate constants (kapp) of primary pathways (D, knk+), and secondary pathways (E, k2k+), as derived from Fig. S4, is shown with increasing concentrations of small-molecule inhibitors. In each case, k represents either knk+ (primary pathways) or k2k+ (secondary pathways). (F–H) Kinetic profiles of the aggregation of a 2 μM Aβ42 solution in the absence and presence of either 1% DMSO (black) or 0.2 (red), 0.5 (cyan), 1 (blue), or 2 (yellow) M eq of CD1530, a representative molecule of set B. The solid lines show predictions for the resulting reaction profiles when primary pathways (F, knk+), secondary pathways (G, k2k+), or both pathways (H) are inhibited by CD1530. Only predictions when both pathways are inhibited fit the experimental data well. Dependences of the apparent reaction rate constants of primary pathways (I, knk+) and secondary pathways (J, k2k+), as derived from Fig. S5, is shown with increasing concentrations of small-molecule inhibitors.
Fig. S4.
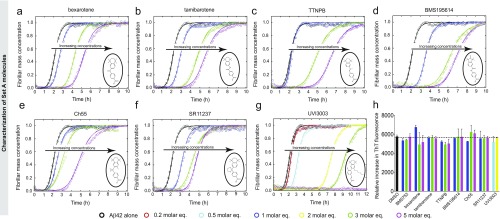
Effect of set A molecules on Aβ42 aggregation. Kinetic profiles of the aggregation of a 2 μM Aβ42 solution in the absence and presence of either 1% DMSO (black) or 0.2 (red), 0.5 (cyan), 1 (blue), 2 (yellow), 3 (green), or 5 (magenta) M eq of bexarotene (A), tamibarotene (B), TTNPB (C), BMS195614 (D), Ch55 (E), SR11237 (F), and UVI3003 (G). The solid lines represent the integrated rate law for Aβ42 aggregation fitted to the experimental data. All set A molecules, the structures of which are shown in open circles, have induced significant delay in Aβ42 aggregation similar to the results obtained with the dot-blot assay (Fig. 1). (H) Relative increase in the raw data values of the ThT fluorescence intensities in the absence and presence of small molecules.
Fig. S5.
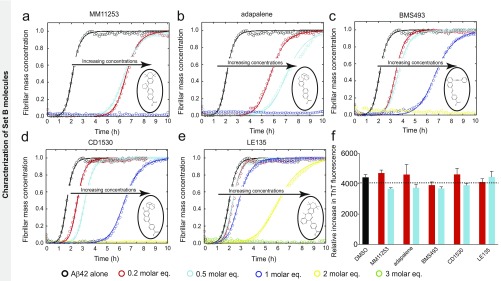
Effect of set B molecules on Aβ42 aggregation. Kinetic profiles of the aggregation of a 2 μM Aβ42 solution in the absence and presence of either 1% DMSO (black) or 0.2 (red), 0.5 (cyan), 1 (blue), 2 (yellow), and 3 (green) M eq of MM11253 (A), adapalene (B), BMS493 (C), CD1530 (D), and LE135 (E). The solid lines represent the integrated rate law for Aβ42 aggregation fitted to the experimental data. All set B molecules, the structures of which are shown in open circles, have induced significant delay in Aβ42 aggregation at substoichiometric amounts similar to the results obtained with the dot-blot assay (Fig. 1). (F) Relative increase in the raw data values of the ThT fluorescence intensities in the absence and presence of small molecules.
To quantify the effects of the small molecules on Aβ42 aggregation further, we examined the increase in ThT fluorescence at the end of the reaction, finding similar values in all cases (Figs. S4H and S5F). These results suggest that a similar fibril mass concentration is formed irrespective of whether or not the small molecules are present, in agreement with the dot-blot assays. In addition, the effect of the small molecules on the aggregation kinetics of Aβ42 was found to be mainly determined by the molar ratio of the small molecules with respect to Aβ42 rather than by its total absolute concentration (Fig. S6 A–C), thus implying that our experiments are conducted above the Kd for the relevant interactions. Based on these results, given that the concentration of Aβ42 is much lower in vivo than that used here in vitro, we would expect that much lower concentrations of the compounds could be required to affect the rate constants of Aβ42 aggregation to the same extent, although the molar ratio might need to be increased in the concentration range below the value of Kd.
Fig. S6.
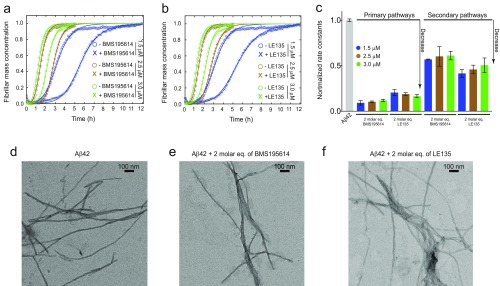
Aggregation reactions of different concentrations of Aβ42 in the presence of 2 M eq of BMS195614 (set A) (A) and LE135 (set B) (B) molecules. (C) Normalized rate constants as derived from the fitted curves in A and B; these results show that at different Aβ42 monomer concentrations, the decrease in the rate constants depends on the fold-excess of the small molecules. TEM images of Aβ42 amyloid fibrils at the end points of the aggregation reactions in the absence (D) or presence of 2 M eq of either BMS195614 (E) or LE135 (F) are shown.
Furthermore, to rule out any possible interference of the small molecules on the aggregation pathway of Aβ42, such as a stabilization of nonfibrillar aggregates, we used transmission electron microscopy (TEM) to image the Aβ42 species formed at the end of the aggregation reactions in the absence and presence of two representative molecules from sets A and B, namely, BMS195614 and LE135 (Fig. S6 E and F). In agreement with our previous atomic force microscopy findings on the effect of bexarotene on the aggregation kinetics of Aβ42 (22), the TEM images showed that similar Aβ42 fibrillar species are formed at the end of the aggregation reactions.
RAR and RXR Ligands Inhibit Secondary Pathways to Different Extents.
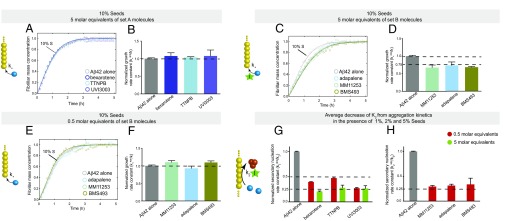
To explore further the effects of the molecules on distinct steps of the secondary pathways further (i.e., on the surface-catalyzed secondary nucleation and elongation steps), we carried out an additional series of kinetic measurements in the presence of the different compounds and various concentrations of preformed fibril seeds. For about 10% of preformed fibrils, the primary and secondary nucleation steps are bypassed and the formation of mature fibrils is greatly accelerated by elongation reactions promoted by the fibril seeds (Fig. S7). Under these conditions, set A molecules did not affect the aggregation kinetics of 2 μM Aβ42 even at a concentration of 5 M eq relative to the peptide (Fig. 4A), whereas the corresponding aggregation process under unseeded conditions was slowed by at least a factor of 3 (Fig. 2A), strongly indicating that the set A compounds have no effect on elongation. This interpretation was confirmed quantitatively by deriving the growth rate constants from the kinetic curves in the absence and presence of each of the set A molecules (Fig. 4B). The molecules in set B decreased the growth rate constants by about 25% at a concentration fivefold greater than the peptide (Fig. 4 C and D), thus explaining the increased delay in Aβ42 aggregation in the presence of set B molecules with respect to Aβ42 aggregation in set A molecules. Additionally, at substoichiometric concentrations (e.g., a concentration ratio of 0.5 compared with the peptide), no effects were observed with any of the set B molecules on the elongation of Aβ42 fibrils, thus indicating that the inhibition of the elongation step requires higher concentrations of small molecules than the nucleation steps (Fig. 4 E and F).
Fig. S7.
Analysis of the effects of increasing amount of preformed seed fibrils on Aβ42 aggregation kinetics. (A) Aggregation kinetics of 2 μM Aβ42 solution in the absence (black) and presence of 1% (purple), 2% (red), 5% (green), and 10% (cyan) of preformed seed fibrils. Note the gradual increase in the half-time of the aggregation kinetics with increasing seed concentrations. (B) Simulated time evolution of the secondary nucleation rates corresponding to the reactions in A with increasing seed concentrations. (C) Fraction of the fibrils generated by secondary nucleation processes with respect to the total fibril amount at the different seed concentrations corresponding to the simulations in B. The continuous line represents calculations according to Eq. S1.
Fig. 4.
Characterization of the effects of set A and set B molecules on the secondary pathways of Aβ42 aggregation. (A) Kinetic aggregation profiles of a 2 μM Aβ42 solution in the presence of 10% of preformed seeds in the absence (gray) or presence of 5 M eq of bexarotene (blue), TTNPB (cyan), and UVI3003 (orchid). Under these conditions, elongation of the fibrils is the dominant mechanism. (B) Normalized growth rate constants derived from the fitted curves in A in the presence of 10% of preformed seed fibrils; these results show that set A molecules do not detectably affect the elongation rates of Aβ42 aggregation. (C) Kinetic profiles of the aggregation of a 2 μM Aβ42 solution in the presence of 10% of preformed seeds in the absence (gray) or presence of 5 M eq of MM11253 (green), adapalene (blue), and BMS493 (moss green); under these conditions, elongation of the fibrils is the dominant mechanism. (D) Normalized growth rate constants derived from the fitted curves in C in the presence of 10% of preformed seed fibrils; these results show that set B molecules affect the elongation rates of Aβ42 aggregation at 5 M eq. (E) Kinetic profiles of the aggregation of a 2 μM Aβ42 solution in the presence of 10% of preformed seeds in the absence (gray) or presence of 0.5 M eq of MM11253 (green), adapalene (blue), and BMS493 (moss green); under these conditions, elongation of the fibrils is the dominant mechanism. (F) Normalized growth rate constants derived from the fitted curves in E in the presence of 10% of preformed seed fibrils; these results show that set B molecules at 0.5 M eq do not affect the elongation rates of Aβ42 aggregation. Effect of 0.5 and 5 M eq of set A (G; bexarotene, TTNPB, and UVI3003) and set B (H; MM11253, adapalene, and BMS493) on the rates of the surface-catalyzed secondary nucleation (k2). The rate constants were obtained from the aggregation kinetics of a 2 μM Aβ42 solution in the presence of 1%, 2%, and 5% of preformed seeds (Figs. S8 and S9), where primary nucleation is negligible and surface-catalyzed secondary nucleation contributes ∼35%, 60%, and 80%, respectively, of the total quantity of fibrils formed, according to the simulations shown in Fig. S7. The quantitative parameters were obtained from the fitted curves in Figs. S7 and S8. The observed effects could only be due to decreasing the rate constants of surface-catalyzed secondary nucleation because elongation is not affected by the compounds under these conditions.
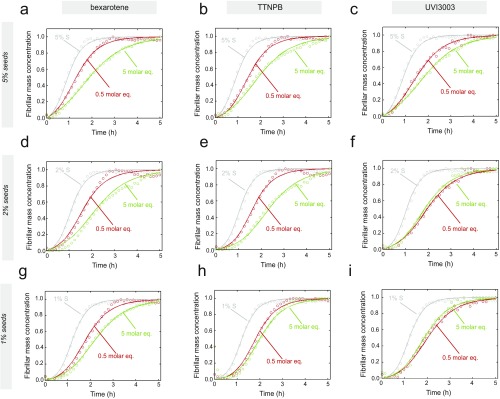
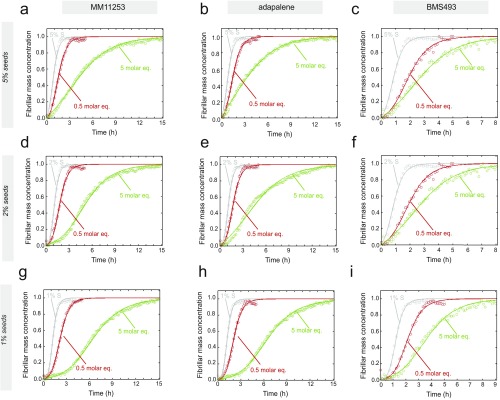
To obtain a more complete comparative assessment on the effects of set A and set B molecules on the secondary pathways of Aβ42 aggregation, we measured the aggregation kinetics of a 2 μM Aβ42 sample in the presence of 1%, 2%, and 5% of fibril seeds (Figs. S7 and S8). Simulations based on the experimental kinetic curves show that primary nucleation is completely bypassed when even the smallest ratios (1%) of preformed seeds are introduced in the solution. By contrast, surface-catalyzed secondary nucleation and elongation contribute in different ways to the overall kinetics, with the contribution of elongation becoming more significant with increasing seed concentrations (Fig. S7). Hence, following the aggregation kinetics of Aβ42 using different seed concentrations allows decoupling of the secondary pathways into the surface-catalyzed secondary nucleation and elongation steps. Such decoupling is crucial to characterize the effects of the small molecules on the individual microscopic steps; these effects might not otherwise be detected directly from the aggregation kinetics in the absence of preformed seeds (23, 25). Data at 1% and 5% of seeds showed a concentration-dependent inhibition of secondary pathways (i.e., a reduction of k2k+) of Aβ42 aggregation in the presence of both sets A and B of compounds (Fig. 4 G and H and Figs. S8 and S9). In the case of set A molecules, the decrease at 0.5 and 5 M eq could be attributed solely to a decrease in the rate constant of the surface-catalyzed secondary nucleation (i.e., k2) because no effect could be observed on the elongation of the fibrils (i.e., k+) at molar equivalents as high as 5 (Fig. 4 A and B). The rate constants could be derived quantitatively from the kinetic curves and were found to be decreased by about 50% and 75% in the presence of 0.5 and 5 M eq of set A molecules, respectively.
Fig. S8.
Analysis of the effects of set A molecules on Aβ42 aggregation kinetics in the presence of 1%, 2%, and 5% of preformed seed fibrils. (A–C) Kinetic profiles of the aggregation of a 2 μM Aβ42 solution in the presence of increasing concentrations of preformed fibril seeds in the presence of either 1% DMSO (gray) or 0.5 (red) and 5 (green) M eq of bexarotene (A, D, and G), TTNPB (B, E, and H), and UVI3003 (C, F, and I). Note the concentration-dependent effects of the set A molecules on the aggregation kinetics of Aβ42 under seeding conditions.
Fig. S9.
Analysis of the effects of set B molecules on Aβ42 aggregation kinetics in the presence of 1%, 2%, and 5% of preformed seed fibrils. (A–C) Kinetic profiles of the aggregation of a 2 μM Aβ42 solution in the presence of increasing concentrations of preformed fibril seeds in the presence of either 1% DMSO (gray) or 0.5 (red) and 5 (green) M eq of MM11253 (A, D, and G), adapalene (B, E, and H), and BMS493 (C, F, and I). Note the concentration-dependent effect of the set B molecules on the aggregation kinetics of Aβ42 under seeding conditions.
Although the elongation of fibrils is essentially unaffected by the set A molecules, these compounds have large effects on the nucleation steps in Aβ42 aggregation. The effects on secondary nucleation were very pronounced in the presence of low concentrations of the molecules, further supporting the key role of this process in promoting the catalytic cycle in Aβ42 aggregation (24). By contrast, for set B molecules, the effects on the secondary nucleation rate constant could be quantified only under the conditions where elongation was not affected (i.e., in the presence of 0.5 M eq of the small molecules). Set B molecules were found to be significantly more effective in inhibiting secondary nucleation in Aβ42 aggregation than set A molecules, with the decrease being as high as 75% at 0.5 M eq, thus further confirming the higher potency of set B molecules with respect to the potency of set A molecules.
Characteristic Chemical Features of Small Molecules Are Required to Inhibit Specific Microscopic Steps in Aβ42 Aggregation.
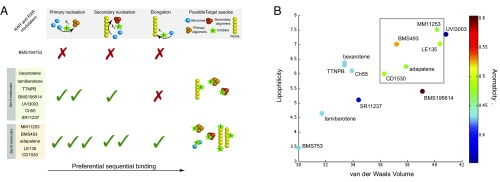
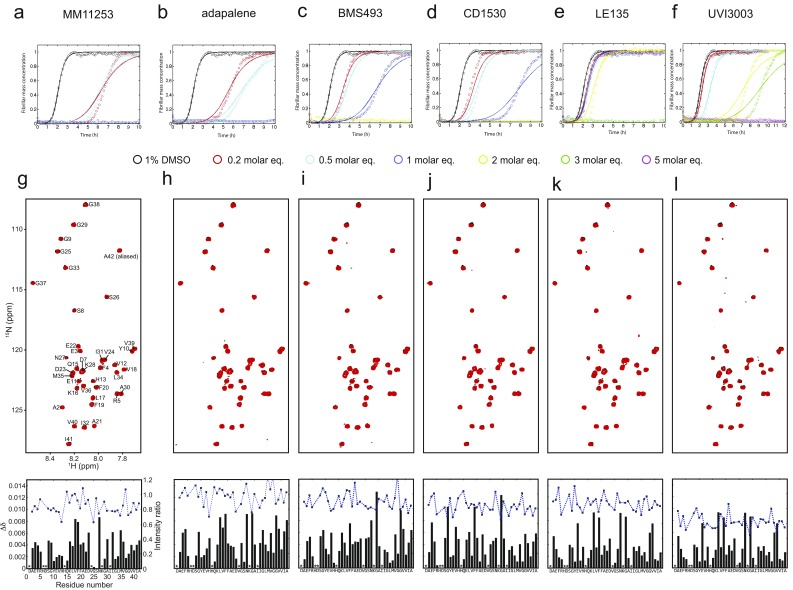
The observation that set A and set B molecules affect different microscopic steps in the aggregation of Aβ42 could result from the interactions of the small molecules with different Aβ42 species formed along the aggregation pathway (Fig. 5A), because inhibiting both primary and secondary nucleation could result from binding of the small molecules to primary and secondary nuclei and/or, in the latter case, fibril surfaces. On the other hand, considering the qualitative correlation between the inhibited processes and the target species, one might expect that the inhibition of Aβ42 aggregation by set B molecules may, in principle, originate mainly from interactions with Aβ42 monomers. Indeed, because the monomeric species of Aβ42 are involved in all microscopic events that underlie its aggregation, as seen in Fig. 5A (i.e., primary nucleation, surface-catalyzed secondary nucleation, elongation), one possible scenario, in which the small molecule inhibits all three steps, is that it binds to the common species (i.e., the monomer in all cases). We examined the likelihood of this scenario in a quantitative manner by attempting a description of the kinetic data where the small molecules sequester monomeric species of Aβ42. In this case, the kinetic curves in the presence of increasing concentrations of the small molecules would correspond to a decreased concentration of Aβ42 available to aggregate. We found, however, that this assumption is incorrect because the kinetic data could not be accurately described (Fig. S10 A–F). Furthermore, NMR spectroscopy measurements showed no significant perturbations of the chemical shifts and the resonance intensities in the heteronuclear single quantum coherence spectra of a 25 μM sample of 15N-labeled monomeric Aβ42 before and after the addition of each of the set B molecules and of UVI3003, the most effective molecule of set A, as a control (Fig. S10 G–L). These observations indicate that set B molecules are likely to bind both primary and secondary nuclei, and the fibril surfaces and ends, but not monomers.
Fig. 5.
Characteristic chemical features of the small molecules found in this study to inhibit Aβ42 aggregation. (A) Summary of the effects of the tested molecules on the microscopic steps of Aβ42 aggregation and of the possible target species. (B) Correlation between lipophilicity, van der Waals volume, and aromaticity of the small molecules and their contribution to the relative potency of the molecules. The box in the figure includes the molecules from set B.
Fig. S10.
Lack of binding of the small molecules to monomeric Aβ42 structures. (A–F) Reaction profiles in the presence of increasing molecule concentrations are not compatible with binding to the monomeric species of Aβ42 as judged from the theoretical fitting (Methods). (G–L, Top) Superimposition of the 1H -15N HSQC spectra of 25 μM monomeric 15N-Aβ42 in the presence of either 1% DMSO (black) or a 1 M excess of all set B molecules and UVI3003 (i.e., set A). The spectra were obtained at a 1H frequency of 700 MHz and 278 K. (G–L, Bottom) Chemical shifts (bar graph) and normalized intensity (dotted line) of 25 μM monomeric 1H-15N-Aβ42, as derived from the spectra, are similar to the chemical shifts and normalized intensity observed for Aβ42 in the presence of 1% DMSO.
Unlike set A molecules, set B molecules were found to inhibit all three major steps in Aβ42 aggregation, with the effects on the primary and secondary nucleation steps being greater than the effects of the set A molecules. It is thus of great significance to identify the chemical features responsible for these differences, because such features can at least in principle enable the rational design of molecules against specific microscopic steps in Aβ42 aggregation. From an analysis of the molecular properties of the small molecules, we selected two parameters: the lipophilicity, defined as the Ghose–Crippen octanol/water coefficient (30), and the steric bulk, defined as the sum of the atomic van der Waals volumes (31). We identified a linear correlation between these two parameters that largely accounts for the efficacy of all of the small molecules (Fig. 5B). The greater the lipophilicity and the steric bulk, the higher is the potency of the small molecule, with very low values of their sum corresponding to the complete abolition of the effects of a molecule, as in the case of BMS753. Strikingly, UVI3003, the most potent molecule in set A, was found to possess similar lipophilicity and steric bulk values to those values in set B molecules, and, accordingly, a similar potency is predicted from the correlation in Fig. 5B. Although no effect was observed on the elongation step, UVI3003 inhibits both the primary and secondary nucleation steps to a similar degree to the molecules in set B. These results suggest that the lipophilicity and steric bulk describe well the effects of small molecules on the primary and secondary nucleation steps, but not on the elongation step. To decipher the chemical features of the small molecules responsible for inhibiting the elongation step, we considered an additional parameter: the value of the relative aromaticity of the small molecules, defined as the ratio of the number of aromatic atoms to the total number of atoms. We thus found that a high aromaticity value confers the ability to inhibit the elongation of Aβ42 fibrils (Figs. 4 C and D and 5B). Indeed, all of the set B molecules have aromaticity values greater than the aromaticity values of the set A molecules.
RAR and RXR Ligands Inhibit Aβ42 Aggregation in CSF Solutions and Rescue Aβ42-Mediated Dysfunction in a C. elegans Model.
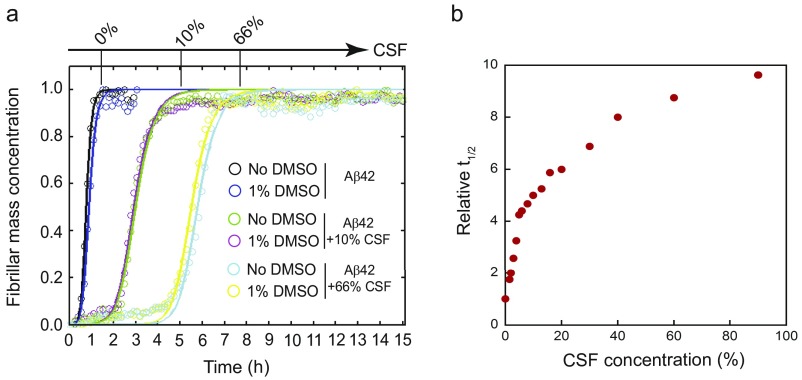
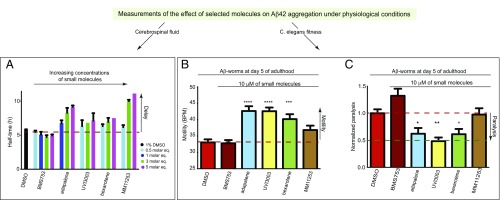
We next explored if the small molecules retard Aβ aggregation under more physiologically relevant conditions. We therefore monitored these effects on the aggregation kinetics of Aβ42 in human cerebrospinal fluid (CSF). CSF caused a concentration-dependent retardation of Aβ42 aggregation, suggesting that Aβ42 aggregation is slower in this fluid, in line with previous results (32) (Fig. S11A). We then investigated the effects of selected small molecules from set A (bexarotene and UVI3003) and set B (MM11253 and adapalene), and from BMS753 as a negative control, under conditions where the effect of CSF is close to maximal (i.e., 66%) (Fig. S11B). We found that under these conditions, all selected small molecules, except for BMS753 (Fig. S12), significantly delayed the aggregation kinetics in a concentration-dependent manner similar to what has been observed in buffer (Fig. 6A and Fig. S13).
Fig. S11.
Retardation of Aβ42 aggregation in CSF. The aggregation of Aβ42 in 20 mM Hepes, 1 mM CaCl2, and 150 mM NaCl (pH 8.0) was studied using ThT fluorescence in the absence and presence of several concentrations of CSF. (A) Representative curves of the effect of 10% and 66% CSF on the aggregation kinetics of a 2 μM Aβ42 solution in the absence and presence of 1% DMSO. (B) Half-time (t1/2), the time at which the ThT fluorescence was half-way between the starting baseline and the final plateau, was extracted from each curve and normalized against the value obtained for Aβ42 alone.
Fig. S12.
Effects of BMS753 on Aβ42 aggregation in 66% CSF. Kinetic profiles of the aggregation of a 2 μM Aβ42 solution in the absence and presence of either 1% DMSO (black) or 0.5 (cyan), 1 (blue), 3 (green), and 5 (purple) M eq of BMS753. BMS753 did not retard the aggregation of Aβ42 similar to the results obtained in phosphate buffer (Fig. S3).
Fig. 6.
Characterization of the effects of small molecules in CSF solutions and in a C. elegans model of Aβ42-mediated cytotoxicity. (A) Dose-dependent effects of selected molecules from set A and set B on the half-times of the aggregation reaction of Aβ42 in 66% CSF solutions. Measurements of the effects of a 10 μM solution of selected molecules from set A and set B in 0.6% DMSO on the frequency of body bends (B) and the paralysis rate (C) at day 5 of adulthood of the Aβ42-worm model. Experimental data are averaged over three separate experiments (ntot ≅ 800 worms). The efficacy of these compounds was determined based on their ability to increase the fitness of the worms with respect to untreated Aβ42 worms. Statistics were determined using one-way ANOVA against 0.6% DMSO motility: *P < 0.05; **P < 0.01; ***P < 0.001; ****P < 0.0001. Error bars represent the SEM. BPM, bends per minute.
Fig. S13.
Effects of representative molecules from sets A and B on Aβ42 aggregation in 66% CSF. Kinetic profiles of the aggregation of a 2 μM Aβ42 solution in the absence and presence of either 1% DMSO (black) or 0.5 (cyan), 1 (blue), 3 (green), and 5 (purple) M eq of bexarotene (A), UVI3003 (B), MM11253 (C), and adapalene (D). All molecules have induced significant delay in Aβ42 aggregation in CSF.
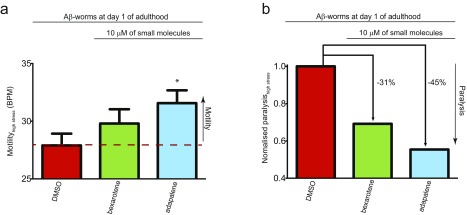
We further evaluated the effects of the same small molecules in a C. elegans model of Aβ42-mediated dysfunction, denoted GMC101 (termed the Aβ-worm model) (22). In this model, Aβ42 is expressed in body wall muscle cells, where it forms aggregates and results in progressive paralysis (22). We assessed the effects of the small molecules on the fitness of the worms in terms of the frequency of body bends (i.e., motility) and the rate of their paralysis. Because all molecules from both sets A and B have significant effects on the nucleation steps of Aβ42 aggregation, we added them at the larval stages of the C. elegans life cycle (i.e., L4), where no aggregation of Aβ42 has occurred yet. At day 5 of worm adulthood, where the fitness of the Aβ-worms was significantly decreased compared with the control-worms (Fig. S14A), the selected small molecules restored the motility of the worms substantially, except for the negative control BMS753 (Fig. 6B), in a concentration-dependent manner (Fig. S14B). These results are similar to the results observed in vitro and in human CSF. In addition, no selected molecules showed any significant effect in a wild-type worm model that does not express Aβ42, N2 (termed the control-worm model) (Fig. S14C). These data suggest that the small molecules restore the motility of the Aβ-worms by specifically inhibiting the aggregation of Aβ42. Indeed, the level of aggregates was measured in Aβ-worms in the absence and presence of bexarotene using the fluorescence intensity of the amyloid-specific dye NIAD-4, and was found to be similar to the level of aggregates of the control-worms in the presence of bexarotene, where no aggregates could be detected (22). We found that all selected small molecules decreased the rate of paralysis of the Aβ worms, except for MM11253. This finding is in agreement with the unexpected lower increase in the motility of the Aβ-worms in the presence of MM11253, which was found to be extremely potent in vitro. Because no MM11253-related toxicity could be observed, as judged from the absence of any effect on the fitness of control worms (Fig. S14C), this finding is likely to be due to a lower half-life of this molecule in worms compared with adapalene, bexarotene, and UVI3003 (Fig. 6C). In any case, all molecules that have shown an effect on the aggregation of Aβ42 in vitro are also able to restore the fitness of the Aβ-worms, thus further supporting the power of the kinetic assay in drug discovery. The effects of the small molecules are also readily detectable under stress conditions, because bexarotene (set A) and adapalene (set B) restore the fitness, in terms of motility (Fig. S15A) and paralysis (Fig. S15B), of Aβ-worms that were exposed to temperature-induced stress (Fig. S15).
Fig. S14.
Effects of representative molecules from sets A and B on Aβ42 aggregation in C. elegans. (A) Measurements of the effect of a 10 μM solution of the selected molecules in 0.6% DMSO on the frequency of body bends at days 1, 3, and 5 of adulthood of the Aβ42-worm model. The measurement of the motility at day 5 is represented with black bars and was used for Fig. 4, because it shows the most significant difference in phenotype with respect to the control-worms. Measurements of the effect of increasing concentrations of selected small molecules ranging from 1 to 10 μM on the frequency of body bends of either Aβ42-worms (B) or control-worms (C) are shown. Note that the presence of small molecules did not show any effect on the motility of the control-worms, but they induced a significant increase in the fitness of the Aβ42-worms at day 5 of adulthood in a concentration-dependent manner. Both plots show one representative dataset of three independent experiments that gave consistent results. Error bars represent the SEM. *P < 0.05; **P < 0.01; ***P < 0.001; ****P < 0.0001. BPM, bends per minute.
Fig. S15.
Effects of representative molecules from sets A and B on Aβ42 aggregation in C. elegans under high-stress conditions. Measurements of the effect of a 10 μM solution of bexarotene or adapalene in 0.6% DMSO on the frequency of body bends (A) and the rate of paralysis (B) at day 1 of adulthood of the Aβ42-worm model. Error bars represent the SEM. *P < 0.05.
Methods
Preparation of Aβ Peptides.
The recombinant Aβ(M1–42) peptide (MDAEFRHDSGY EVHHQKLVFF AEDVGSNKGA IIGLMVGGVV IA), here called Aβ42, was expressed in the Escherichia coli BL21 Gold (DE3) strain (Stratagene) and purified as described previously with slight modifications (33). Briefly, the purification procedure involved sonication of E. coli cells, dissolution of inclusion bodies in 8 M urea, and ion exchange in batch mode on diethylaminoethyl cellulose resin and lyophilization. The lyophilized fractions were further purified using a Superdex 75 HR 26/60 column (GE Healthcare), and eluates were analyzed using SDS/PAGE for the presence of the desired protein product. The fractions containing the recombinant protein were combined, frozen using liquid nitrogen, and lyophilized again.
Isotopically labeled 15N-Aβ42 was prepared by growing transformed E. coli BL21 Gold (DE3) strain in 1-L flasks at 37 °C with 500 mL of minimal M9 batch medium. Briefly, a 20-mL preculture grown overnight to saturation in LB containing 100 μg/L ampicillin was diluted at a 1/25 ratio in 2YT medium supplemented with 100 μg/L ampicillin and grown at 37 °C. When the OD at 600 nm reached 0.5, the cells were harvested, washed in minimal medium, and inoculated in one-fourth of the initial culture volume of minimal M9 medium containing 100 μg/L ampicillin and supplemented with 2 g/L 15NH4Cl (Cambridge Isotopes Laboratories). Cells were grown at 37 °C for 2 h before induction. Isopropyl β-d-1-thiogalactopyranoside was then added to a final concentration of 1 mM, and cells were grown at 37 °C overnight. Purification of 15N-Aβ42 was performed as described above.
Bexarotene, SR11237, tamibarotene, TTNPB, BMS753, adapalene, BMS493, and LE135 were obtained from Sigma–Aldrich; BMS195614, MM11253, CD1530, UVI3003, and Ch55 were obtained from Tocris Bioscience. All chemicals were of the highest purity available.
Preparation of Samples for Kinetic Experiments.
Solutions of monomeric peptides were prepared by dissolving the lyophilized Aβ42 peptide in 6 M GuHCl. Monomeric forms were purified from potential oligomeric species and salt using a Superdex 75 10∕300 GL column (GE Healthcare) at a flow rate of 0.5 mL⋅min−1, and were eluted in 20 mM sodium phosphate buffer (pH 8) supplemented with 200 μM EDTA and 0.02% NaN3. The center of the peak was collected, and the peptide concentration was determined from the absorbance of the integrated peak area using ε280 = 1,490 L⋅mol−1⋅cm−1. The obtained monomer was diluted with buffer to the desired concentration and supplemented with 20 μM ThT from a 1 mM stock. All samples were prepared in low-binding Eppendorf tubes on ice using careful pipetting to avoid introduction of air bubbles. Each sample was then pipetted into multiple wells of a 96-well half-area, low-binding, clear-bottomed PEG coating plate (Corning 3881), at 80 μL per well.
For the seeded experiments, preformed fibrils were freshly prepared just before the experiment without sonication because it has been shown previously that sonicating the fibrils for 10 min in a sonicator bath to delump the fibrils has no effect on their capacity to accelerate secondary nucleation (34). Kinetic experiments were set up just as above for 4 μM Aβ42 samples in 20 mM sodium phosphate buffer (pH 8) with 200 μM EDTA, 0.02% NaN3, and 20 μM ThT. The ThT fluorescence was monitored for 3 h to verify the formation of fibrils. Samples were then collected from the wells into low-binding tubes. Under the considered conditions (i.e., 4 μM Aβ42), the monomer concentration is negligible at equilibrium (24). The final concentration of fibrils, in monomer equivalents, was considered equal to the initial concentration of monomer. Fibrils were then added to freshly prepared monomer to reach a 1%, 2%, 5%, or 10% final concentration of seeds.
For the experiments of Aβ42 aggregation kinetics in CSF, monomeric solutions of Aβ42 were prepared similar to above with the only exception that the buffer was 20 mM Hepes (pH 8) supplemented with 1 mM CaCl2 at 150 mM NaCL. The obtained monomer was diluted with the buffer to reach a 66% final concentration of CSF, in which the effect of CSF is close to maximum (Fig. S11). Deidentified CSF samples were obtained from individuals undergoing lumbar puncture as part of the clinical routine diagnostic workup at the Memory Clinic, Skåne University Hospital. The subjects provided written informed consent allowing the use of the CSF samples for research, and the procedure is approved by the Ethical Review Board of Lund University, Lund, Sweden.
In all cases, the small molecules were first solubilized in 100% DMSO to a concentration of 5 mM, and then diluted in the peptide solution to reach a final DMSO concentration of 1% maximum. We verified that the addition of 1% DMSO in the reaction mixture has no effect on Aβ42 aggregation using two nonrelated assays (Fig. S1).
Kinetic Assays.
Assays were initiated by placing the 96-well plate at 37 °C under quiescent conditions in a plate reader (Fluostar Omega, Fluostar Optima, or Fluostar Galaxy; BMGLabtech). The ThT fluorescence was measured through the bottom of the plate with a 440-nm excitation filter and a 480-nm emission filter. The ThT fluorescence was followed for three repeats of each sample.
Theoretical Analysis.
The time evolution of the total fibril mass concentration, M(t), is described by the following integrated rate law (24, 25):
| [S1] |
where the kinetic parameters B±, C±, k, , and are functions of the two combinations of the microscopic rate constants k+k2 and knk2, where kn, k+, and k2 are the primary nucleation, elongation, and secondary nucleation rate constants, respectively.
Inhibitors can interfere with the aggregation process by inhibiting one or more of the individual microscopic reactions. We can identify the microscopic events that are inhibited by the chemical compounds by applying the above equation to describe the macroscopic aggregation profiles shown in Figs. S4 and S5, and comparing the set of microscopic rate constants k+k2 and k+kn required to describe the time evolution of the fibril formation in the absence and presence of small molecules.
The numerical simulations reported in Fig. S7 were performed as described by Arosio et al. (34) by varying seed concentrations with fixed k+, k2, and kn parameters. Individual nucleation rates were calculated to determine the proportion of nuclei generated for each nucleation process.
The theoretical fits used in Fig. S10 attempt to describe the kinetic data in a case where the molecule is binding to the monomer, and hence sequestering it in a state that is no longer potent to form fibrils. In the presence of increasing concentrations of the small molecules, the aggregation profiles were described by allowing only the monomer concentration to vary, whereas the Aβ42 rate constants were kept fixed.
Dot-Blot Assay.
Blotting was performed using Aβ42 fibril-specific antibody (OC; Millipore). During the time course of the aggregation of 2 μM Aβ42 in the absence and presence of either 0.5 or 3 M eq of the small molecules (Fig. 2 A and B), 4-μL Aβ42 aliquots were removed from the mixture at different time points for blotting with OC. Aβ42 aliquots were spotted onto a nitrocellulose membrane (0.2 μm; Whatman), and the membranes were dried and then blocked with Blocking One (Nacalai Tesque) before immunodetection. OC was used according to the manufacturer’s instructions. Alexa Fluor 488-conjugated secondary antibodies (Life Technologies) were subsequently added, and fluorescence detection was performed using a Typhoon Trio Imager (GE Healthcare). DMSO-solubilized small molecules were added to Aβ42 at a final concentration of 1% DMSO.
NMR Experiments.
For NMR analyses, 15N-Aβ42 was purified as described above except that the buffer of the gel filtration was 50 mM ammonium acetate (pH 8.5). Lyophilized powder of 15N-Aβ42 was dissolved at an approximate concentration of 1 mM in 0.2% (vol/vol) ammonium solution and then collected and stored in aliquots at −80 °C until use. NMR samples were prepared by dissolving the lyophilized powder in 20 mM sodium phosphate buffer (pH 7.4) at a concentration of 25 μM containing 10% (vol/vol) 2H2O in the presence and absence of equimolar concentrations of the small molecules in 1% DMSO. The pH of the mixture was checked for possible pH variations that could occur from the addition of the small molecules and was adjusted to pH 7.4. NMR spectral measurements were made on a Bruker AVANCE 700-MHz spectrometer equipped with a cryogenic probe. The probe temperature was set to 278 K. 1H-15N heteronuclear single-quantum correlation (HSQC) spectra were recorded at a 1H observation frequency of 700 MHz with 64 (t1) × 1,024 (t2) complex points and 32 scans per t1 increment. The spectral width was 1,631 Hz for the 15N dimension and 10,504 Hz for the 1H dimension. Chemical shift perturbation (CSP) and intensity changes were monitored using 1H-15N HSQC spectra. A reference sample of DMSO without compound was also titrated into Aβ42 samples. The CSP and intensity ratio due to the addition of DMSO were subtracted from values observed during titrations with compound. CSP was calculated as Δδ = ((ΔδN/5)2 + (ΔδH)2)1/2. All NMR spectra were processed by NMRPipe (35), and resonance assignment and intensity calculations were performed by the program Sparky (https://www.cgl.ucsf.edu/home/sparky/). The sample preparation protocol and the low NMR probe temperature (5 °C) were chosen to ensure that the Aβ42 peptide remained monomeric during the entire data acquisition process. The HSQC spectra are typical of intrinsically disordered peptides with a very low dispersion of resonant frequencies (Fig. S10).
TEM.
Samples for TEM were prepared on 400-mesh, 3-mm copper grid carbon support film (EM Resolutions Ltd.) and stained with 2% uranyl acetate (wt/vol). The samples were imaged on an FEI Tecnai G2 transmission electron microscope (Cambridges Advanced Imaging Centre). Images were analyzed using the SIS Megaview II Image Capture system (Olympus).
Determination of the Chemical Features of the Small Molecules.
Constitutional descriptors and molecular properties were calculated using E-Dragon version 1.0 software (36). The lipophilicity of the molecules was expressed through the Ghose–Crippen octanol/water coefficient, the volume of the molecules was expressed through the sum of atomic van der Waals volumes, and the overall aromaticity of the molecules was expressed through the aromaticity ratio.
Caenorhabditis elegans Experiments.
Strains.
Two strains were used for this experiment. The temperature-sensitive human Aβ-expressing strain dvIs100 [unc-54p::A-beta-1–42::unc-54 3′-UTR + mtl-2p::GFP] (GMC101) was used, where mtl-2p::GFP causes intestinal GFP expression and unc-54p::A-beta-1–42 expresses the human full-length Aβ42 peptide in the muscle cells of the body wall. Raising the temperature above 20 °C at the L4 or adult stage causes paralysis due to Aβ42 aggregation in body wall muscle. The N2 strain was used for wild-type worms (37, 38).
Worm procedures.
Strictly sterile techniques were used at all points of worm preparation. Briefly, an age-synchronized population of worms was generated via hypochlorite bleaching, followed by overnight starved hatching in M9 (3 g/L KH2PO4, 6 g/L Na2HPO4, 5 g/L NaCl, and 1 μM MgSO4). Worms were then transferred to seeded (OP50 E. coli) Petri dishes containing nematode growth medium [NGM; 1 mM CaCl2, 1 mM MgSO4, 5 μg/mL cholesterol, 250 μM KH2PO4 (pH 6), 17 g/L agar, 3 g/L NaCl, and 7.5 g/L casein] and incubated at 20 °C. S basal was prepared using conventional methods (5.85 g/L NaCl, 1 g/L KHPO4, 6 g/L KH2PO4, and 1 mL of cholesterol per liter from 5 mg/mL stock in ethanol, in H2O). Liquid media S complete was prepared by adding the following autoclaved aliquots to 1 L of autoclaved S basal: 10 mL of 1 M potassium citrate (pH 6), 10 mL of trace metals solution (1.86 g of disodium EDTA, 0.69 g of FeSO4 • 7 H2O, 0.2 g of MnCl2 • 4 H2O, 0.29 g of ZnSO4 • 7 H2O, and 0.025 g of CuSO4 • 5 H2O, all in 1 L of H2O), 3 mL of 1 M CaCl2, and 3 mL of 1 M MgSO4. On day 3 after synchronization, worms were washed from NGM plates and suspended in S medium at 75 worms per milliliter containing 5 mg/mL OP50. One hundred twenty microliters of seeded worm solution was then transferred to each well of many multiwell plates. At the L4 stage, worms were sterilized with 30 μL of 0.6 mM 5-fluoro-2′deoxy-uridine (FUDR) (39). On the following morning just before adulthood, worms were treated with the various compounds of interest suspended in 0.6% DMSO and plates were incubated at 75% humidity and 23.5 °C. The induction of aggregation was shown to begin after raising the temperature. On days 1 through 5 of adulthood, worms were scored for motility using an in-house developed Nematode Tracking Platform.
In the experiments where the worms are stressed by increasing the temperature, worms were transferred from NGM plates at the L4 stage to fresh plates seeded with 10 μM compound and 75 μM sterilization agent FUDR. To seed plates, aliquots of small molecules were prepared at a final concentration of 10 μM in 1% DMSO. The surface of each plate was seeded with 2.2 mL of the solutions of the small molecules, and plates were then dried in a laminar flow hood at room temperature. On the following day after overnight incubation at 25 °C (i.e., day 1 of adulthood), worms were transferred to unseeded NGM plates with M9 buffer to monitor motility.
Automated motility assay on multiwell plates.
For screening the multiwells, worms were stored at 20 °C before the L4 stage and 23.5 °C thereafter, which was found to be a sufficient temperature to induce the aggregation of Aβ in GMC101 worms. Before screening, worms were mixed on a bench-top plate shaker at 750 rpm for 1 min to distribute sedimented OP50 evenly and induce full worm motility (model no. 13687708, Fisher Scientific). Immediately after shaking, worms were staged on an automated screening platform. File collection was initiated 60 s after shaking. For screenings of worms grown in agar plates, at different ages, the animals were washed off the plates with M9 buffer and spread over an OP-50 unseeded 9-cm plate. Worm movements were recorded using a homemade microscopic setup. The swimming worms were visualized by using a high performance imaging lens and a machine vision camera. The videos of the swimming worms were taken at a high number of frames per second (fps) for 30 s or 1 min. Body bends were quantified using a custom-tracking algorithm. Briefly, after an initial background subtraction, a second (nonadaptive) thresholding procedure was performed and worms were identified and labelled. The eccentricity, a measure of the ratio of the minor and major ellipse axes, of each tracked worm was then used to estimate the worm bending as a function of time. Day 5 was selected for final analysis because a prominent phenotype was seen with high reproducibility. On average, up to 300 worms were analyzed per experiment, with circa 800 analyzed per drug in total.
Conclusions
We have described a drug discovery approach based on quantitative chemical kinetics to identify small molecules that target specific microscopic steps in Aβ42 aggregation. The results that we have obtained suggest that this approach is highly effective for drug discovery against protein misfolding diseases because, unlike other available approaches not based on chemical kinetics, it provides quantitative descriptions of the inhibitory process, thus making it possible to control and modulate the onset of the aggregation in vitro. In addition, the molecules that we have described, particularly those in set B, are expected to have a greater effect not only on the onset of aggregation but also on the proliferation of the Aβ42 oligomers produced through surface-catalyzed secondary nucleation. Therefore, targeting such a process, which is largely responsible for the production of toxic Aβ42 species (23, 24), should provide an effective means for the development of treatments against the progression of AD. Given the connection between the aggregation of Aβ42 and AD, and the fact that the typical age for the onset of sporadic AD is around 65 years, even a small delay in Aβ aggregation may postpone the onset by long enough to reduce the risk of developing AD significantly. Thus, inhibiting the nucleation steps in Aβ42 aggregation should result in a delay and reduction in the formation of toxic Aβ42 oligomers (22, 23), which are considered central to the pathology of AD; therefore it is likely to be a promising route to preventing AD. We anticipate that the combination of QBSDD and kinetics-based drug discovery will allow the screening of databases for the identification of pools of potent small molecules against Aβ42 aggregation. This approach will also enable the rational design of candidate molecules bearing the chemical features that are crucial for inhibiting specific microscopic steps of the protein aggregation reaction, and that possess good drug pharmacokinetic characteristics.
Footnotes
Conflict of interest statement: Part of the work described in this paper has been the subject of a patent application filed by Cambridge Enterprise, a wholly owned subsidiary of the University of Cambridge (now licensed to Wren Therapeutics Ltd., where M.V. is Chief Scientific Officer; S.I.A.C., C.M.D., and M.V. are members of the Board of Directors; and S.I.A.C., S.L., C.M.D., and T.P.J.K. are consultants).
This article is a PNAS Direct Submission.
This article contains supporting information online at www.pnas.org/lookup/suppl/doi:10.1073/pnas.1615613114/-/DCSupplemental.
References
- 1.Alzheimer’s Association 2012 Alzheimer’s disease facts and figures. Alzheimers Dement. 2012;8(2):131–168. doi: 10.1016/j.jalz.2012.02.001. [DOI] [PubMed] [Google Scholar]
- 2.Hardy J, Selkoe DJ. The amyloid hypothesis of Alzheimer’s disease: Progress and problems on the road to therapeutics. Science. 2002;297(5580):353–356. doi: 10.1126/science.1072994. [DOI] [PubMed] [Google Scholar]
- 3.Selkoe DJ. Folding proteins in fatal ways. Nature. 2003;426(6968):900–904. doi: 10.1038/nature02264. [DOI] [PubMed] [Google Scholar]
- 4.Haass C, Selkoe DJ. Soluble protein oligomers in neurodegeneration: Lessons from the Alzheimer’s amyloid beta-peptide. Nat Rev Mol Cell Biol. 2007;8(2):101–112. doi: 10.1038/nrm2101. [DOI] [PubMed] [Google Scholar]
- 5.Dobson CM. Protein folding and misfolding. Nature. 2003;426(6968):884–890. doi: 10.1038/nature02261. [DOI] [PubMed] [Google Scholar]
- 6.Knowles TP, Vendruscolo M, Dobson CM. The amyloid state and its association with protein misfolding diseases. Nat Rev Mol Cell Biol. 2014;15(6):384–396. doi: 10.1038/nrm3810. [DOI] [PubMed] [Google Scholar]
- 7.Holtzman DM, Morris JC, Goate AM. Alzheimer’s disease: The challenge of the second century. Sci Transl Med. 2011;3(77):77sr1. doi: 10.1126/scitranslmed.3002369. [DOI] [PMC free article] [PubMed] [Google Scholar]
- 8.Tanzi RE, Bertram L. Twenty years of the Alzheimer’s disease amyloid hypothesis: a genetic perspective. Cell. 2005;120(4):545–555. doi: 10.1016/j.cell.2005.02.008. [DOI] [PubMed] [Google Scholar]
- 9.Karran E, Mercken M, De Strooper B. The amyloid cascade hypothesis for Alzheimer’s disease: An appraisal for the development of therapeutics. Nat Rev Drug Discov. 2011;10(9):698–712. doi: 10.1038/nrd3505. [DOI] [PubMed] [Google Scholar]
- 10.Huang Y, Mucke L. Alzheimer mechanisms and therapeutic strategies. Cell. 2012;148(6):1204–1222. doi: 10.1016/j.cell.2012.02.040. [DOI] [PMC free article] [PubMed] [Google Scholar]
- 11.Selkoe DJ, Hardy J. The amyloid hypothesis of Alzheimer’s disease at 25 years. EMBO Mol Med. 2016;8(6):595–608. doi: 10.15252/emmm.201606210. [DOI] [PMC free article] [PubMed] [Google Scholar]
- 12.Bateman RJ, et al. Dominantly Inherited Alzheimer Network Clinical and biomarker changes in dominantly inherited Alzheimer’s disease. N Engl J Med. 2012;367(9):795–804. doi: 10.1056/NEJMoa1202753. [DOI] [PMC free article] [PubMed] [Google Scholar]
- 13.Buchhave P, et al. Cerebrospinal fluid levels of β-amyloid 1-42, but not of tau, are fully changed already 5 to 10 years before the onset of Alzheimer dementia. Arch Gen Psychiatry. 2012;69(1):98–106. doi: 10.1001/archgenpsychiatry.2011.155. [DOI] [PubMed] [Google Scholar]
- 14.Bieschke J. Natural compounds may open new routes to treatment of amyloid diseases. Neurotherapeutics. 2013;10(3):429–439. doi: 10.1007/s13311-013-0192-7. [DOI] [PMC free article] [PubMed] [Google Scholar]
- 15.Chen J, Armstrong AH, Koehler AN, Hecht MH. Small molecule microarrays enable the discovery of compounds that bind the Alzheimer’s Aβ peptide and reduce its cytotoxicity. J Am Chem Soc. 2010;132(47):17015–17022. doi: 10.1021/ja107552s. [DOI] [PMC free article] [PubMed] [Google Scholar]
- 16.Lansbury PT, Lashuel HA. A century-old debate on protein aggregation and neurodegeneration enters the clinic. Nature. 2006;443(7113):774–779. doi: 10.1038/nature05290. [DOI] [PubMed] [Google Scholar]
- 17.Necula M, Kayed R, Milton S, Glabe CG. Small molecule inhibitors of aggregation indicate that amyloid beta oligomerization and fibrillization pathways are independent and distinct. J Biol Chem. 2007;282(14):10311–10324. doi: 10.1074/jbc.M608207200. [DOI] [PubMed] [Google Scholar]
- 18.Cummings JL, Morstorf T, Zhong K. Alzheimer’s disease drug-development pipeline: Few candidates, frequent failures. Alzheimers Res Ther. 2014;6(4):37. doi: 10.1186/alzrt269. [DOI] [PMC free article] [PubMed] [Google Scholar]
- 19.Karran E, Hardy J. A critique of the drug discovery and phase 3 clinical programs targeting the amyloid hypothesis for Alzheimer disease. Ann Neurol. 2014;76(2):185–205. doi: 10.1002/ana.24188. [DOI] [PMC free article] [PubMed] [Google Scholar]
- 20.De Strooper B, Karran E. The cellular phase of alzheimer’s disease. Cell. 2016;164(4):603–615. doi: 10.1016/j.cell.2015.12.056. [DOI] [PubMed] [Google Scholar]
- 21.Arosio P, Vendruscolo M, Dobson CM, Knowles TP. Chemical kinetics for drug discovery to combat protein aggregation diseases. Trends Pharmacol Sci. 2014;35(3):127–135. doi: 10.1016/j.tips.2013.12.005. [DOI] [PubMed] [Google Scholar]
- 22.Habchi J, et al. An anticancer drug suppresses the primary nucleation reaction that initiates the production of the toxic Aβ42 aggregates linked with Alzheimer’s disease. Sci Adv. 2016;2(2):e1501244. doi: 10.1126/sciadv.1501244. [DOI] [PMC free article] [PubMed] [Google Scholar]
- 23.Cohen SI, et al. A molecular chaperone breaks the catalytic cycle that generates toxic Aβ oligomers. Nat Struct Mol Biol. 2015;22(3):207–213. doi: 10.1038/nsmb.2971. [DOI] [PMC free article] [PubMed] [Google Scholar]
- 24.Cohen SI, et al. Proliferation of amyloid-β42 aggregates occurs through a secondary nucleation mechanism. Proc Natl Acad Sci USA. 2013;110(24):9758–9763. doi: 10.1073/pnas.1218402110. [DOI] [PMC free article] [PubMed] [Google Scholar]
- 25.Cohen SI, Vendruscolo M, Dobson CM, Knowles TP. From macroscopic measurements to microscopic mechanisms of protein aggregation. J Mol Biol. 2012;421(2-3):160–171. doi: 10.1016/j.jmb.2012.02.031. [DOI] [PubMed] [Google Scholar]
- 26.Boehm MF, et al. Design and synthesis of potent retinoid X receptor selective ligands that induce apoptosis in leukemia cells. J Med Chem. 1995;38(16):3146–3155. doi: 10.1021/jm00016a018. [DOI] [PubMed] [Google Scholar]
- 27.le Maire A, et al. Retinoid receptors and therapeutic applications of RAR/RXR modulators. Curr Top Med Chem. 2012;12(6):505–527. doi: 10.2174/156802612799436687. [DOI] [PubMed] [Google Scholar]
- 28.Pérez E, Bourguet W, Gronemeyer H, de Lera AR. Modulation of RXR function through ligand design. Biochim Biophys Acta. 2012;1821(1):57–69. doi: 10.1016/j.bbalip.2011.04.003. [DOI] [PubMed] [Google Scholar]
- 29.Altucci L, Leibowitz MD, Ogilvie KM, de Lera AR, Gronemeyer H. RAR and RXR modulation in cancer and metabolic disease. Nat Rev Drug Discov. 2007;6(10):793–810. doi: 10.1038/nrd2397. [DOI] [PubMed] [Google Scholar]
- 30.Ghose AK, Crippen GM. Atomic physicochemical parameters for three‐dimensional structure‐directed quantitative structure‐activity relationships. I. Partition coefficients as a measure of hydrophobicity. J Comput Chem. 1986;7(4):565–577. doi: 10.1021/ci00053a005. [DOI] [PubMed] [Google Scholar]
- 31.Leach AR. Molecular Modelling: Principles and Applications. Pearson Education; Essex, UK: 2001. [Google Scholar]
- 32.Padayachee ER, et al. Cerebrospinal fluid-induced retardation of amyloid β aggregation correlates with Alzheimer’s disease and the APOE ε4 allele. Brain Res. 2016;1651:11–16. doi: 10.1016/j.brainres.2016.09.022. [DOI] [PMC free article] [PubMed] [Google Scholar]
- 33.Hellstrand E, Boland B, Walsh DM, Linse S. Amyloid β-protein aggregation produces highly reproducible kinetic data and occurs by a two-phase process. ACS Chem Neurosci. 2010;1(1):13–18. doi: 10.1021/cn900015v. [DOI] [PMC free article] [PubMed] [Google Scholar]
- 34.Arosio P, Cukalevski R, Frohm B, Knowles TP, Linse S. Quantification of the concentration of Aβ42 propagons during the lag phase by an amyloid chain reaction assay. J Am Chem Soc. 2014;136(1):219–225. doi: 10.1021/ja408765u. [DOI] [PubMed] [Google Scholar]
- 35.Delaglio F, et al. NMRPipe: A multidimensional spectral processing system based on UNIX pipes. J Biomol NMR. 1995;6(3):277–293. doi: 10.1007/BF00197809. [DOI] [PubMed] [Google Scholar]
- 36.Tetko IV, et al. Virtual computational chemistry laboratory--design and description. J Comput Aided Mol Des. 2005;19(6):453–463. doi: 10.1007/s10822-005-8694-y. [DOI] [PubMed] [Google Scholar]
- 37.McColl G, et al. Utility of an improved model of amyloid-beta (Aβ1−42) toxicity in Caenorhabditis elegans for drug screening for Alzheimer’s disease. Mol Neurodegener. 2012;7:57. doi: 10.1186/1750-1326-7-57. [DOI] [PMC free article] [PubMed] [Google Scholar]
- 38.Brenner S. The genetics of Caenorhabditis elegans. Genetics. 1974;77(1):71–94. doi: 10.1093/genetics/77.1.71. [DOI] [PMC free article] [PubMed] [Google Scholar]
- 39.Solis GM, Petrascheck M. Measuring Caenorhabditis elegans life span in 96 well microtiter plates. J Vis Exp. 2011;49:2496. doi: 10.3791/2496. [DOI] [PMC free article] [PubMed] [Google Scholar]


