Significance
Parkinson’s disease is a devastating neurodegenerative disorder that can be inherited through mutations in genes encoding the kinase PTEN-induced kinase 1 (PINK1) or the ubiquitin ligase parkin. Parkin exhibits neuroprotective properties by ubiquitinating proteins on damaged mitochondria, leading to their turnover. However, parkin exists in an inactive state that must be alleviated by PINK1 phosphorylation. Therefore, the molecular interpretation of the phosphorylation signal is immensely valuable to our understanding of parkin’s role in mitochondrial maintenance and neuronal fidelity. We present the 3D structure of the phosphorylated inhibitory domain of parkin and describe the structural changes that lead to activation of the enzyme. Alongside the available phosphoubiquitin structure, this study completes a structural picture of PINK1-orchestrated parkin activation in impaired mitochondria.
Keywords: E3 ligase, Parkinson’s disease, conformational change, phosphorylation, ubiquitin
Abstract
Mutations in PARK2 and PARK6 genes are responsible for the majority of hereditary Parkinson’s disease cases. These genes encode the E3 ubiquitin ligase parkin and the protein kinase PTEN-induced kinase 1 (PINK1), respectively. Together, parkin and PINK1 regulate the mitophagy pathway, which recycles damaged mitochondria following oxidative stress. Native parkin is inactive and exists in an autoinhibited state mediated by its ubiquitin-like (UBL) domain. PINK1 phosphorylation of serine 65 in parkin’s UBL and serine 65 of ubiquitin fully activate ubiquitin ligase activity; however, a structural rationale for these observations is not clear. Here, we report the structure of the phosphorylated UBL domain from parkin. We find that destabilization of the UBL results from rearrangements to hydrophobic core packing that modify its structure. Altered surface electrostatics from the phosphoserine group disrupt its intramolecular association, resulting in poorer autoinhibition in phosphorylated parkin. Further, we show that phosphorylation of both the UBL domain and ubiquitin are required to activate parkin by releasing the UBL domain, forming an extended structure needed to facilitate E2–ubiquitin binding. Together, the results underscore the importance of parkin activation by the PINK1 phosphorylation signal and provide a structural picture of the unraveling of parkin’s ubiquitin ligase potential.
Posttranslational modifications are sophisticated biological “switches,” relaying molecular signals to govern cellular processes and respond to external stimuli. Under conditions of oxidative stress, two modifications in particular, phosphorylation and ubiquitination, cooperate to regulate mitochondrial dynamics and restore homeostasis (well reviewed in ref. 1). The ubiquitin (Ub) ligase parkin (encoded by the PARK2 gene) and Ser/Thr kinase PTEN-induced kinase 1 (PINK1, encoded by PARK6) are important regulators of mitochondrial dynamics and mutations in either gene are causative of familial forms of Parkinson’s disease (2, 3). Multiple studies show that in response to mitochondrial oxidative stress parkin activity is stimulated through phosphorylation by PINK1 (4, 5). This in turn facilitates parkin-mediated ubiquitination of several proteins at the outer mitochondrial membrane and signals the turnover of damaged mitochondria through the mitophagy pathway (6–8). Some mutations in parkin cause its dysfunction, leading to an accumulation of mitochondrial damage that appears to be especially detrimental in neurons, a potential cause for Parkinson’s disease.
Parkin belongs to the RBR subfamily of E3 ubiquitin ligases (9) that function by transferring Ub from an E2-conjugating enzyme to a substrate through an E3–Ub intermediate (10). These enzymes are structurally autoinhibited in their native states by unique accessory domains (11–13), indicating that RBR ligases must be activated to carry out their full ubiquitination potential. Specifically, parkin contains an N-terminal ubiquitin-like (UBL) domain shown to inhibit Ub ligase activity (11). Three-dimensional structures of parkin show UBL associates with the C-terminal region (R0RBR) through both ionic and hydrophobic interactions, blocking the proposed E2 recognition site (14, 15).
PINK1 stimulates parkin activity through phosphorylation of both Ub and parkin’s UBL domain at an equivalent serine 65 position in sequence and structure (16–21). Whereas each phosphorylation event can increase parkin activity independently, maximal activity is obtained when both parkin and Ub are phosphorylated (18, 19). Phosphorylation of parkin at S65 increases parkin’s affinity for phosphoubiquitin (pUb) (14, 15, 22, 23). Three-dimensional structures show this optimizes a pUb binding site, remote from the UBL site (15), and computational models predict local structural changes occur in the UBL domain upon phosphorylation (24). Further, binding of pUb allosterically induces a conformational change in parkin, liberating parkin from its autoinhibited state (14, 15, 22, 25).
Although the functional effect of PINK1 on parkin activity is well reported, the molecular interpretation of the UBL phosphorylation signal especially in conjunction with pUb is less clear. In this work, we present the solution structure of PINK1-phosphorylated UBL (pUBL) from human parkin. We find that altered thermodynamic stability and surface potential in pUBL disrupt the autoinhibitory association in parkin. Further, we show phosphorylation of both UBL and Ub is needed to release the UBL domain and form an extended structure where the E2-binding site is unprotected, allowing its recruitment during the ubiquitination cascade.
Results and Discussion
Phosphorylation of Parkin UBL Decreases Its Stability.
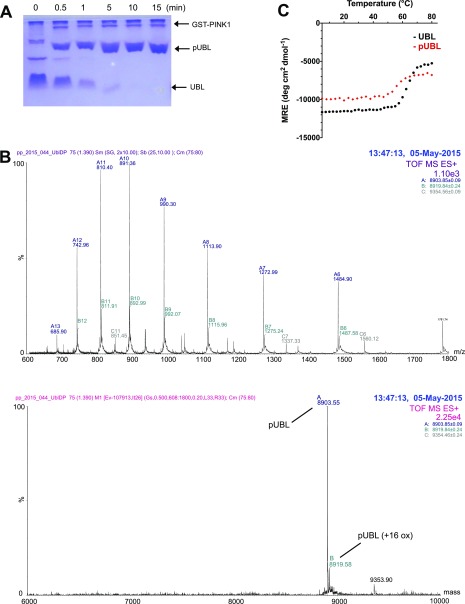
We produced the human parkin UBL domain fully phosphorylated at S65, using a catalytically active insect orthologue of PINK1 (26) (Fig. S1 A and B). Compared with UBL, pUBL had decreased solubility and was more prone to precipitation. We hypothesized that phosphorylation negatively impacted the stability of the UBL fold, as has been reported for several disease forms of the UBL (27). Circular dichroism (CD) spectra for UBL and pUBL showed similar spectral signatures with minima observed near 205 nm and 222 nm (Fig. 1A), characteristic of the -grasp ubiquitin fold. However, thermally treated pUBL showed a lower transition temperature than UBL (Fig. 1A and Fig. S1C) and chemical denaturation experiments confirmed pUBL was significantly less stable than UBL, undergoing a much earlier unfolding transition in urea (Fig. 1B). Because pUBL is less stable and more susceptible to aggregation than UBL, we used 4,4’-bis-1-anilinonapthalene-8-sulfonate (bis-ANS) fluorescence to probe for changes in hydrophobicity upon phosphorylation. Interestingly, bis-ANS showed markedly greater fluorescence in the presence of pUBL compared with UBL (Fig. 1C), suggesting the hydrophobic surface of pUBL is altered. These results show that phosphorylation of UBL results in structural changes that perturb its folding pathway and thermodynamic stability.
Fig. S1.
Generation of homogenous pUBL. (A) Coomassie-stained Zn2+ PhosTag showing phosphorylation of UBL by P. humanus PINK1 (GST tagged). (B) Mass spectrum of pUBL after phosphorylation and subsequent removal of GST-PINK1. Raw and deconvoluted spectra are shown. MWcalculated: 8,904 Da (8,824 Da + PO4). (C) Thermal denaturation profile of UBL and pUBL as monitored by CD ellipticity at 205 nm.
Fig. 1.
S65 phosphorylation destabilizes the UBL domain of parkin. (A) CD spectra of UBL (black) and pUBL (red), showing native (solid line) and thermally denatured states (dashed line), collected at C and C, respectively. (B) Unfolding profile of UBL and pUBL by urea denaturation as measured at C by CD ellipticity at 222 nm. Observed denaturation midpoint SE is indicated beside each curve. (C) Bis-ANS fluorescence in the presence of UBL and pUBL. An increased fluorescence for pUBL indicates a greater exposed hydrophobic surface than for UBL.
Solution NMR Structure of Phosphorylated Parkin UBL.
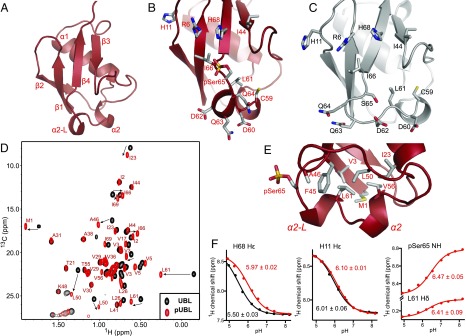
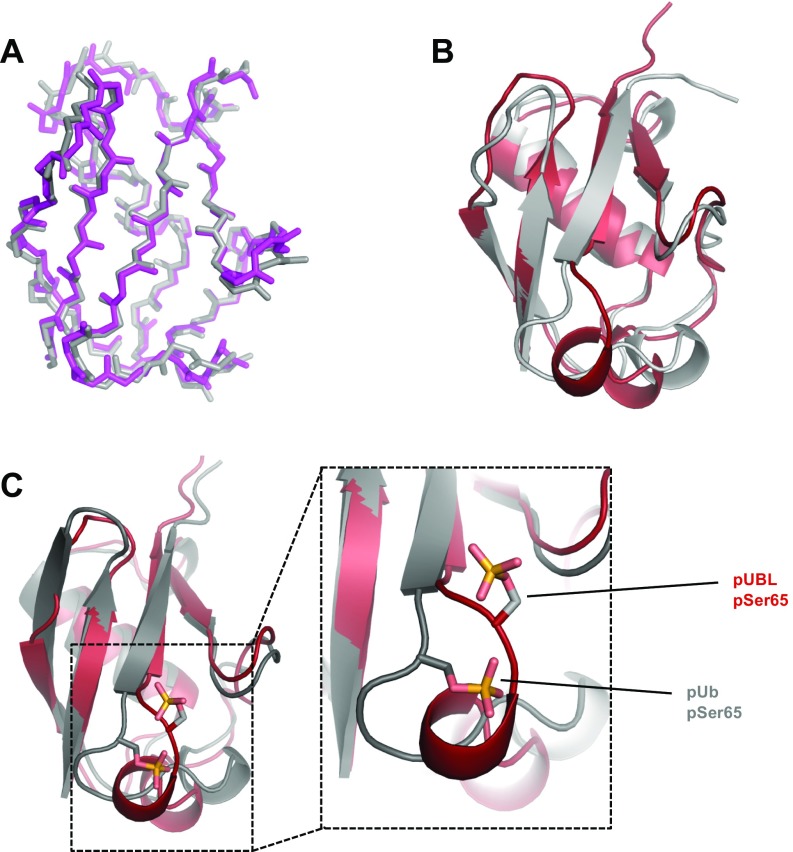
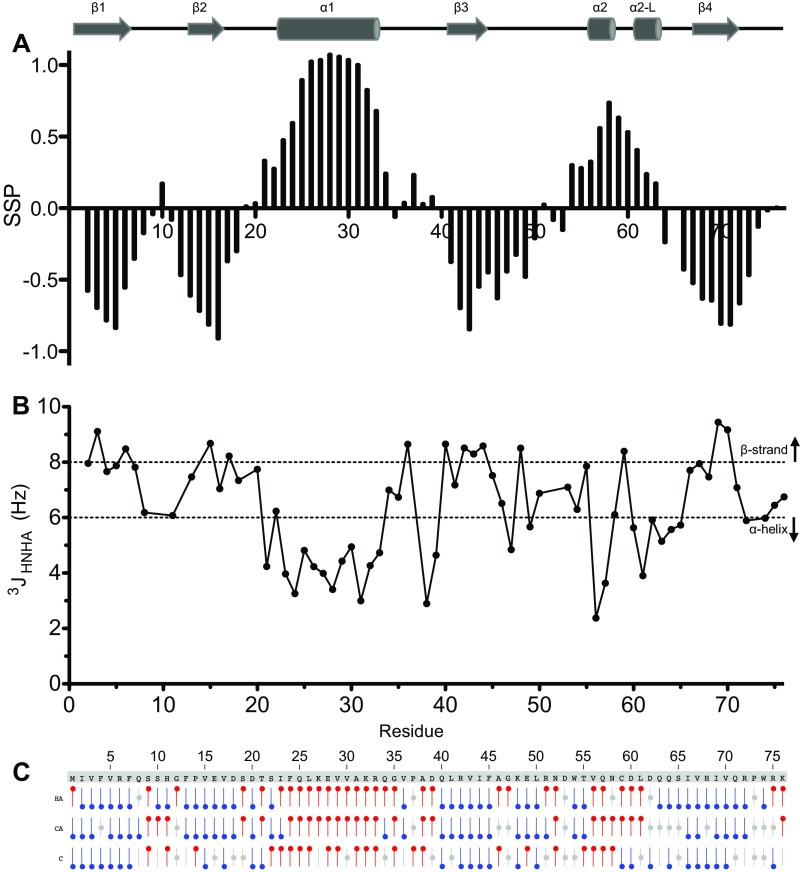
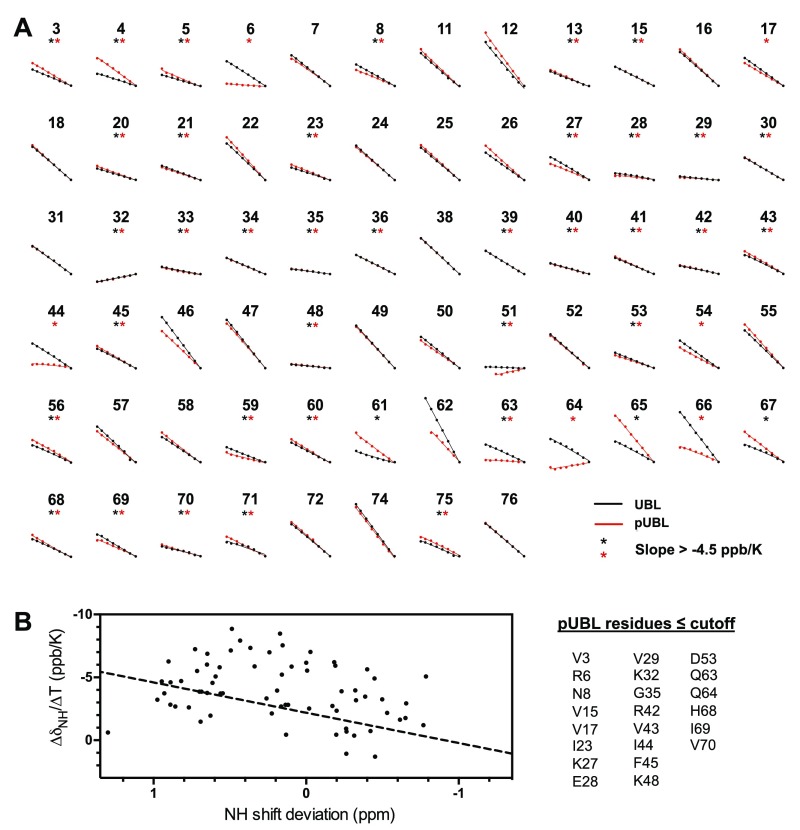
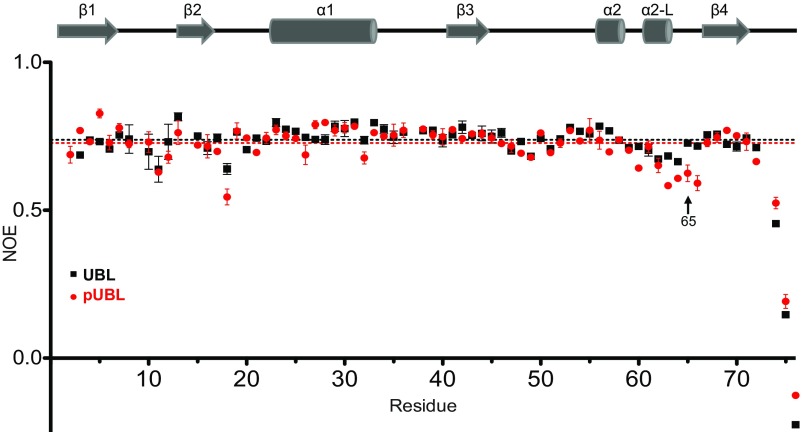
To identify the structural effects of phosphorylation and establish how this modifies the UBL association with parkin, we determined the solution structure of pUBL, using NMR spectroscopy (Fig. 2A and Table S1). Our 25 lowest-energy structures form a canonical -grasp ubiquitin-like fold: a four-strand -sheet (1, M1–R6; 2, F13–V17; 3, L41–I44; and 4, V67–Q71) and two -helices (1, I23–Q34; and 2, V56–C59). In comparison with the human and mouse UBL crystal structures (Fig. S2 A and B), obvious structural changes occur near the S65 phosphorylation site where the protein backbone is rotated and exposes the sidechain of phosphoserine 65 (pSer65). This conformational change eliminates a hydrogen bond between the S65 hydroxyl group and the backbone amide of D62. The reorganization is translated to the upstream residues, L61–I66 (Fig. 2 A–C), forming a new -helix–like structural element (2-L, L61–Q64) that was supported by backbone coupling constants, secondary structure propensity, and chemical shift analysis (Fig. S3). Amide temperature coefficients (T) for pUBL also showed large decreases near the S65 phosphorylation site compared with UBL, including Q63 and Q64 in the 2-L structural element (Fig. S4) indicative of amide hydrogen bonding (28, 29). In contrast, the amide of pSer65 showed increased temperature dependency, reflecting the loss of hydrogen bonds with F4 in 1, shortening the terminal 4 strand. As a result of these structural changes in pUBL, sidechain atoms of D62, Q63, and Q64 are oriented away from the backbone into solvent, whereas the aliphatic sidechain of L61 is buried into the protein core. This was confirmed by 1H-15N heteronuclear NOE measurements that showed phosphorylation increases flexibility in the D62–Q64 loop and releases pSer65 and I66 from 4 (Fig. S5).
Fig. 2.
Solution structure of pUBL. (A) Structure of Ser65-phosphorylated pUBL determined by NMR spectroscopy. Structure closest to average is represented as a cartoon with secondary structure as described in the text. (B) Expanded view of pUBL structure around pSer65. (C) UBL structure (extracted from PDB ID 5C1Z) is shown for comparison. (D) Chemical shift perturbations in methyl (CH3) resonances upon Ser65 phosphorylation. Resonance assignments for methyl groups in pUBL are indicated (red spectrum), reporting changes to the hydrophobic core upon phosphorylation. (E) Expanded view of pUBL structure showing hydrophobic residues affected by phosphorylation. (F) Chemical shifts observed during the pH titration of UBL (black curves) and pUBL (red curves). 1H chemical shifts were measured at each pH and fitted to a modified Henderson–Hasselbalch equation by nonlinear regression to determine pKa SE (indicated beside the curve). Titration of S65 and L61 in UBL was not observed.
Table S1.
Statistics for 25 lowest-energy pUBL structures
| Completeness of resonance assignments | |
| Backbone (N, CA) | (147/149), 98.7% |
| Sidechain (C, H) | (663/679), 96.4% |
| HN | (71/73), 97.3% |
| HA | (79/79), 100.0% |
| HB | (122/122), 100.0% |
| NMR distance and dihedral constraints | |
| Distance constraints | |
| Total | 1,014 |
| Intraresidue | 299 |
| Interresidue | |
| Sequential (i − j = 1) | 258 |
| Medium range () | 152 |
| Long range () | 305 |
| Intermolecular | 0 |
| Hydrogen bonds | 52 |
| Dihedral angle restraints (phi, psi)* | 38 |
| Structure statistics† | |
| Violations (mean and SD) | |
| Distance constraints, Ň | 0 |
| Dihedral angles constraints, | |
| Maximum dihedral angle violation, | 1.82 |
| Maximum distance constraint violation, Ň | 0 |
| Deviations from idealized geometry | |
| Bond lengths, Å | |
| Bond angles, | |
| Impropers, | |
| Ramachandran statistics§ | |
| Most favored | 85.1% |
| Additionally favored | 14.2% |
| Generously favored | 0.2% |
| Disallowed | 0.6% |
| rmsd to mean structure, Ŷ | |
| Heavy | |
| Backbone | |
Talos-derived phi/psi angles.
As reported by X-PLOR-NIH, using all residues.
No distance violation Å.
As reported by Procheck, using all residues.
rmsd to averaged coordinates using residues 1–71.
Fig. S2.
Comparisons of existing structures. (A) Backbone atom overlay of existing, unphosphorylated UBL structures. Gray, mouse UBL crystal structure (PDB ID 2ZEQ) (55); magenta, human UBL crystal structure (PDB ID 5C1Z, residues 1–76) (15). Sequence identity between mouse and human orthologues is 89% and backbone RMSD between structures is Å. (B) Superposition of solved pUBL structure (red) and UBL crystal structure (gray, PDB ID 5C1Z). The backbone rmsd between structures is Å. (C) Superposition of solved pUBL structure (red) and pUb crystal structure (gray, PDB ID 4WZP) (21). An expanded view around the phosphorylation site is shown to demonstrate the significant conformational changes observed in UBL vs. Ub upon phosphorylation. pSer65 in ubiquitin maintains a hydrogen to the backbone amide of Q62, whereas pSer65 in UBL is oriented into solvent and facing H68.
Fig. S3.
Secondary structure propensity in phosphorylated parkin UBL. Secondary structure map from the solved pUBL structure is displayed for reference. (A) Secondary structure propensity for pUBL. Positive values are indicative of -helical propensity and negative values indicate a propensity to structure. SSP was determined from CA and CB chemical shift assignments, using the software “SSP” (47). pSer65 was omitted from analysis. (B) Residue plot of coupling constants obtained from quantitative correlation experiments. Secondary structure thresholds are indicated by dashed lines (51). (C) Chemical shift index analysis using HA, CA, and CO chemical shifts (48). A red symbol indicates an -helical chemical shift propensity. A blue symbol indicates -strand propensity.
Fig. S4.
Amide temperature coefficients in parkin UBL. (A) Residue plots demonstrating the effect of temperature on chemical shift in UBL (black) and pUBL (red) backbone amides. Only residues observed in both UBL and pUBL experiments were selected for analysis (note several residues are near-perfectly overlapped). Amide proton chemical shifts were plotted against temperature and fitted by linear regression. The x axis of each plot spans 279–313 K and the y axis spans 0.5 ppm (1H). Residues with slope (/T, the temperature coefficient) less negative than −4.5 ppb/K are indicated by an asterisk in each plot. (B) Plot of temperature coefficient vs. chemical shift deviation for amide protons in pUBL. A cutoff line identified in Andersen et al. (29), , to include hydrogen-bonding amides is indicated by a dashed line. Residues that fall on or below the cutoff are listed.
Fig. S5.
Backbone dynamics in UBL and pUBL: - heteronuclear NOE measurements for UBL (black squares) and pUBL (red circles) (53). The values plotted are an average of two independent experiments at 600 MHz, indicated by error bars. The average NOE for data within 1 SD of the mean is indicated by a dashed line for each species. The S65/pSer65 data point is indicated for reference.
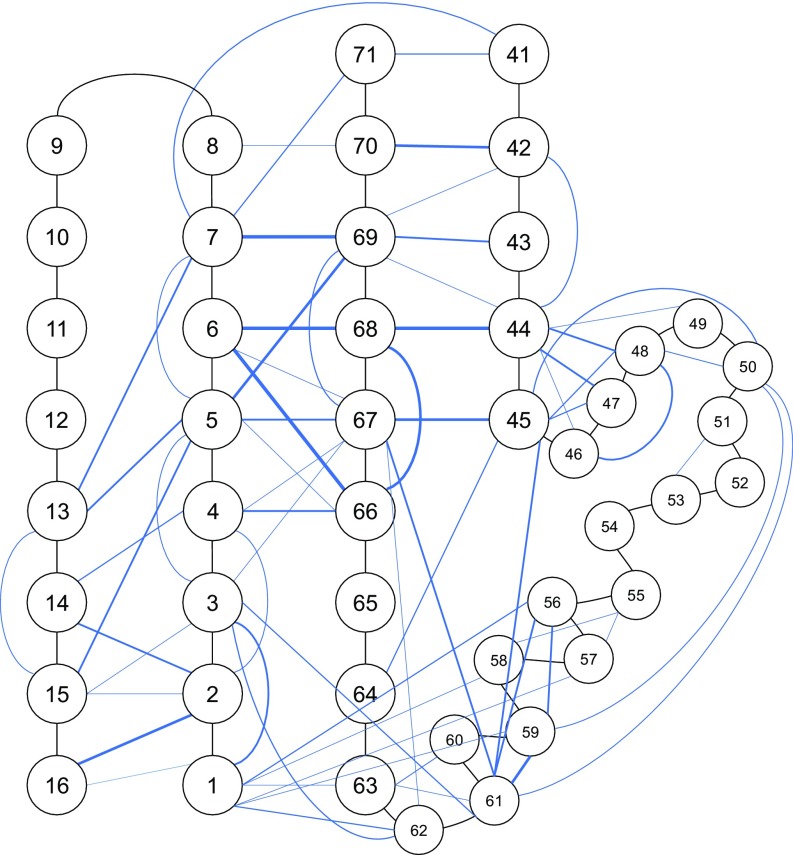
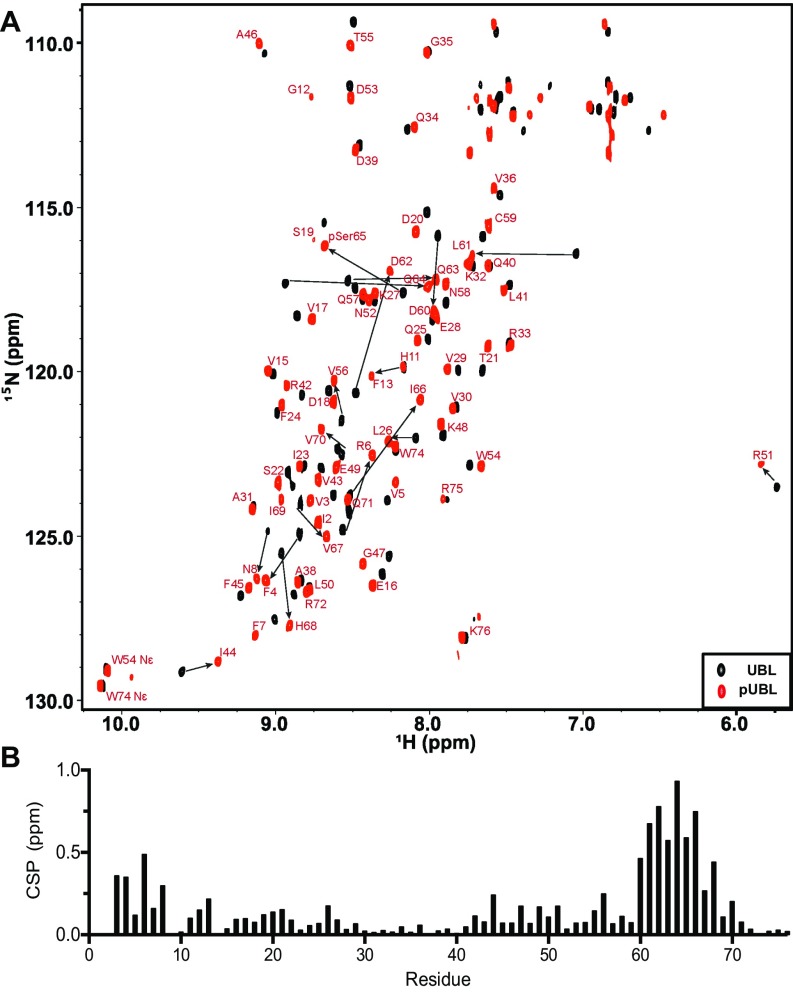
A hydrophobic core comprising residues M1, V3, V5, I23, F45, A46, L50, V56, and V67 and centered around L61 exists in pUBL as supported by extensive backbone and sidechain NOEs between these aliphatic residues (Fig. 2E and Fig. S6). The movement of pSer65 into the bulk solvent uncovers a portion of this hydrophobic core close to the region suggested to be important for cleft widening with the linker region in parkin during activation (24). Whereas 1H-15N heteronuclear single-quantum coherence (HSQC) data report several large chemical shift changes upon phosphorylation (22), these do not report this change to the hydrophobic core (Fig. S7). In contrast, 1H-13C HSQC spectra demonstrate extensive changes in the methyl resonance positions of M1, V3, I23, A46, L50, and L61 upon phosphorylation (Fig. 2D) despite being distant in space from the phosphate group in our structure. In addition, large chemical shift changes to the sidechain methyl atoms of I66 are observed. These structural changes reaffirm the bis-ANS experiments that showed modified hydrophobicity in pUBL upon phosphorylation.
Fig. S6.
Graphical representation of medium- and long-range (interresidue) NOEs observed from and NOESY experiments. pUBL residues are indicated by circles and connected by black lines. Blue lines indicate observed interresidue NOEs. Darker blue lines represent more unique NOEs observed. Sequential NOEs are excluded for simplicity. Residues V17–Q40 were also excluded in this representation for simplicity and due to a lack of structural change in this region relative to UBL.
Fig. S7.
Chemical shift perturbations of backbone amides in parkin UBL upon phosphorylation. (A) - HSQC spectra showing backbone amide resonances in parkin UBL (UBL, black spectrum) and following phosphorylation (pUBL, red spectrum). Resonance assignments are labeled in red for pUBL. Where large chemical shift changes occur, an arrow is indicated to show the chemical shift from UBL upon phosphorylation. (B) Weighted chemical shift perturbations in pUBL relative to WT UBL. CSP is calculated as .
The structure of pUBL stands in stark contrast to the pUb crystal structure, where the overall structure of pUb is nearly identical to the unphosphorylated state (Fig. S2C) (21). In pUb the structural hydrogen bond from pSer65 to the backbone amide of Q62 is preserved, maintaining the orientation of the surrounding backbone residues. These observations provide an explanation for the key differences in physical and functional properties between pUb and pUBL.
pSer65 Modifies the Ionization Network in pUBL.
In pUBL, the pSer65 phosphate is directed toward R6 and H68 in most of the calculated structures (average distance: 4.8 Å), owing to multiple NOEs observed between I66, R6, and H68 (Fig. 2B and Fig. S6). We hypothesized that a transient ionic interaction may exist between the negative phosphate group on pSer65 and the basic sidechains of R6 or H68. Consistent with this idea, chemical shift analysis confirmed the N2-protonated tautomer of H68, with N2 oriented toward pSer65 in all calculated structures. To further investigate this, we performed pH titrations to measure the pKa of H11 and H68 in UBL and pUBL by tracking the H signals in 1H-13C HSQC spectra. Whereas phosphorylation has no effect on the pKa of H11, the pKa of H68 increased by 0.5 unit to 5.97 (Fig. 2F). We noted that in addition to H68, sidechain methyl groups of L61 in pUBL (but not UBL) titrated with pH, suggesting their chemical environment is also affected by ionization. Fitting of the L61 titration data results in a pKa of 6.41 (Fig. 2F). Because L61 is distant from H68 in our pUBL structures, we suspected this might be reporting ionization of the pSer65 phosphate from the −1 to −2 charge state. We confirmed this by measuring the titration of the pSer65 amide proton, calculating a similar pKa value of 6.47, consistent with observations for phosphoproteins (30, 31). These experiments indicate that the ionization network in pUBL is altered upon S65 phosphorylation and provide evidence that pSer65 partially neutralizes the H68 positive charge.
Phosphorylation Alters the UBL Association in Parkin.
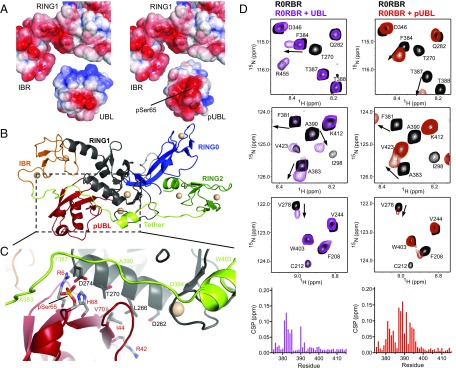
Given that parkin autoinhibition is maintained through intramolecular interactions with the -sheet face and I44-patch of UBL, we sought to examine how phosphorylation might directly perturb this binding interface. We previously observed that S65 phosphorylation results in ∼10-fold weaker binding of pUBL vs. UBL when measured in trans (26 M vs. M Kd) (15). To investigate the structural basis of the weakened affinity, we calculated the surface electrostatic potential of the UBL–R0RBR binding interface (32). On its parkin-interacting surface, UBL has an overall positive surface that interacts with an overall negative surface on R0RBR (Fig. 3A, Left). Upon phosphorylation, the predominantly −2 charge of the O-phosphate group changes the surface to a more negative state by partially neutralizing charges on the -sheet face of pUBL (Fig. 3A, Right). The additional negative potential on the pUBL surface is unfavorably brought into close proximity to the negative binding pocket on R0RBR. We generated a model of pUBL-bound parkin, maintaining the I44-centered binding interface observed in crystal structures (14, 15) (Fig. 3 B and C). In this model, I44 and V70 maintain contact with L266, as their aliphatic sidechains show minimal change in structure and chemical environment upon phosphorylation (Fig. 2D). However, pSer65 is brought into close proximity of the RING1 domain, specifically the carboxylate group of D274, resulting in electrostatic repulsion and disruption of the polar interactions of D274 with R6 and H68 (Fig. 3C). These changes to electrostatic interactions in the binding pocket provide a rationale for the poorer autoinhibition observed in phosphorylated parkin.
Fig. 3.
Changes to surface electrostatic potential upon phosphorylation of UBL disrupt autoinhibitory interactions with R0RBR. (A) Surface charge is indicated by color in red (negative), white (neutral), and blue (positive). R0RBR, UBL (Left), and pUBL (Right) were calculated separately, using the online programs PDB2PQR and APBS (32), and visualized in PyMOL. (B) Overall domain architecture of parkin R0RBR (PDB ID 5C1Z, residues 142–465) with pUBL aligned in the UBL binding region. Unresolved tether residues (A383–A390) were modeled using Modeler in UCSF Chimera. (C) Expanded view of B, showing proposed pUBL binding interface. Residue numberings are colored according to their respective domains. pSer65 is brought into close proximity of D274 ( Å), a possible source of charge repulsion. (D) Selected 600-MHz 1H-15N TROSY HSQC spectra of 2H,15N-labeled parkin R0RBR highlighting differences in UBL (purple, Left) and pUBL (red, Right) interactions with the tether domain. UBL and pUBL interactions were ∼96% and ∼92% saturated, respectively, according to affinities in ref. 15. Chemical shift perturbation (CSP) plots for amide resonances of tether residues (G375–T415) are shown beneath spectra and colored for the respective experiment. CSPs were calculated as . Full CSP plots are found in Fig. S8.
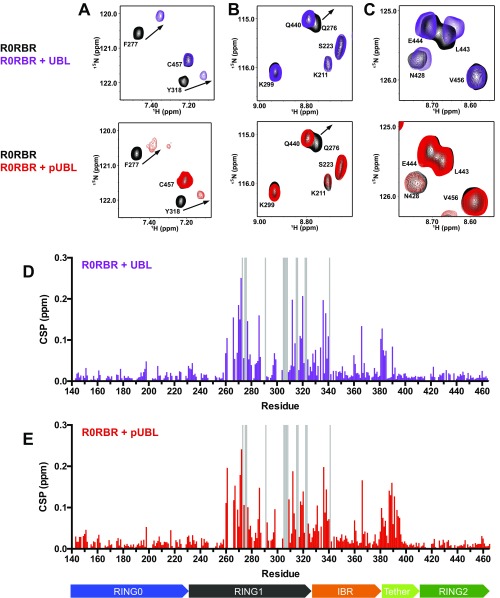
To further examine how phosphorylation of the UBL domain modulates its interaction with parkin, we probed the pUBL–R0RBR interaction by transverse relaxation optimized spectroscopy (TROSY) from the perspective of R0RBR. Consistent with the calorimetric data, NMR experiments showed pUBL is still able to bind parkin in trans, despite the weakened affinity. Many of the perturbed residues in RING1 and IBR are affected in a similar fashion for binding of pUBL and UBL, indicating that the RING1/IBR interface is still used for pUBL recruitment (Fig. 3D and Fig. S8). Further, we did not observe chemical shift changes in RING0 or RING2 upon binding of pUBL, indicating the arrangement of these domains is not modified nor does pUBL interact specifically with either domain (Fig. S8). The most significant changes in chemical shift upon phosphorylation occur in the tether region (residues F381–T415) connecting the IBR and RING2 domains (Fig. 3D). Much of this region is flexible based on heteronuclear NOE experiments (15) and is unresolved in crystal structures (15, 35). Chemical shift perturbations show that a portion of this tether (residues F381–E385) lies near the UBL domain in the autoinhibited state. However, phosphorylation of UBL leads to more pronounced changes in the magnitude and direction of chemical shifts for several residues in the tether when pUBL is titrated into R0RBR parkin (Fig. 3D and Fig. S8). These differences when pUBL is bound, especially in residues G385–E395, suggest these are specifically reporting the phosphate moiety and indicate that pSer65 is likely near this portion of the tether. Notably, we do not observe chemical shift changes beyond R396, a region that includes W403 and is proposed to suppress ligase activity by blocking the E2 binding site (35, 36). Therefore, it is conceivable that UBL phosphorylation serves a dual purpose: It optimizes the pUb-binding site (15) and primes the upstream region of the tether for remodeling to accommodate the incoming E2–Ub conjugate.
Fig. S8.
Interaction of UBL and pUBL with R0RBR parkin. Shown are selected regions of 600-MHz - TROSY HSQC spectra of , -labeled parkin R0RBR with 1.5 molar equivalents UBL (purple spectra, A–C, Top, ∼96% saturated) or 2.5 molar equivalents pUBL (red spectra, A–C, Bottom, ∼92% saturated). Level of saturation was determined from affinities in Kumar et al. (15). (A) UBL and pUBL use similar modes to bind parkin through RING1 and IBR domains. (B and C) UBL and pUBL do not interact with sulfate-binding pockets in RING0 and RING2. (D and E) Full chemical shift perturbation plots for the R0RBR domain. Gray bars indicate resonances that broaden or shift beyond assignment in the bound form. Domain map is included below the x axis and colored as in Fig. 3B.
pUb Activation Leads to an Extended Parkin Structure.
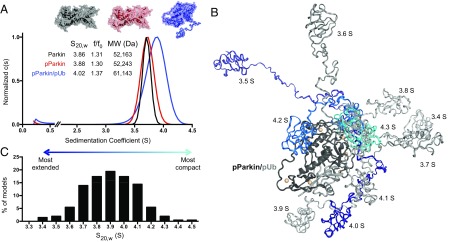
Most biophysical experiments to evaluate the impact of S65 phosphorylation have been conducted in trans, using pUBL and R0RBR constructs of parkin. To examine how phosphorylation might alter the structure of full-length parkin in cis and to identify how pUb activation further modulates this, we used analytical ultracentrifugation (AUC) to probe the hydrodynamic shape of parkin in solution. We purified native, fully S65-phosphorylated parkin (pParkin), and homogenous pParkin/pUb complexes by size exclusion chromatography (15, 23). Both parkin and pParkin displayed similar sedimentation profiles and rates ( 3.86 S and 3.88 S, respectively), indicating both forms of parkin are monomeric and retain the same compact shape under the conditions tested where the UBL (pUBL) domain is associated with the R0RBR domains (Fig. 4A, black and red). To complement these studies, we calculated hydrodynamic properties of autoinhibited parkin, using available 3D structures (15, 21, 34). Results from this approach (3.86 S, RG = 27 Å) matched nearly perfectly with the experimental data for parkin and pParkin (Fig. 4A). In contrast, pParkin/pUb was reproducibly found to sediment faster by ultracentrifugation at 4.02 S (Fig. 4A, blue). Whereas an increase in sedimentation coefficient is expected due to the addition of pUb (∼9 kDa), the modest increase in the sedimentation rate must be offset by a change in hydrodynamic shape, reflected in the frictional coefficient (f/f0). Indeed, f/f0 increased from 1.30 to 1.37 with the addition of pUb, indicating pParkin/pUb adopts a more extended conformation in solution. Hydrodynamic calculations using the autoinhibited structure (15) with pUb bound to the observed pUb binding site (22) yielded a sedimentation coefficient of 4.56 S, much larger than observed experimentally (4.02 S). Together these results show that pParkin/pUb does not maintain a compact structure.
Fig. 4.
Hydrodynamic shape analysis of PINK1-activated parkin. (A) Sedimentation velocity experiments show little change in hydrodynamic shape upon UBL phosphorylation. A more extended conformation is observed only in the presence of pUb (higher f/f0). Example surface representations for the given hydrodynamic shapes are shown. (B) Ten representative pParkin/pUb models with a “displaced” pUBL domain. Two hundred models were generated using the ensemble optimization method (33), allowing pUBL linker to sample random conformations relative to R0RBR/pUb complex. R0RBR/pUb complex is represented as dark/light gray according to PDB ID 5CAW. Modeled pUBL-linker structures are shown according to their sedimentation coefficients as in C. (C) Distribution of sedimentation coefficients of 200 generated models of activated pParkin/pUb and autoinhibited pParkin/pUb. S20,w values were determined by HYDROPRO, using a residue-level shell model (34). Histogram x axis shows calculated S20,w values grouped by 0.05 S.
To determine the position of pUBL in the pParkin/pUb complex, we generated 200 models where pUBL is randomly displaced from R0RBR by its disordered 65-residue linker (residues G77–I142) (33). Visual inspection shows that pUBL samples the available conformational space surrounding R0RBR in different models (Fig. 4B) and occupies a Gaussian distribution of sedimentation coefficients that averages 3.89 S (Fig. 4C). The most extended model had a sedimentation coefficient of 3.36 S, reflecting pUBL displaced by a near-linear linker (RG = 54 Å). In contrast, the most compact model observed was autoinhibited pParkin/pUb (4.56 S, RG = 27 Å). These observations are consistent with molecular dynamics calculations for compact and extended forms of parkin (24). Taking all calculated structures into account, the observed sedimentation coefficient (4.02 S) for pParkin/pUb is most consistent with an average structure whereby pUBL is displaced from R0RBR with RG ≈ 32 Å, occupying a range of positions dictated by the configuration of the disordered linker.
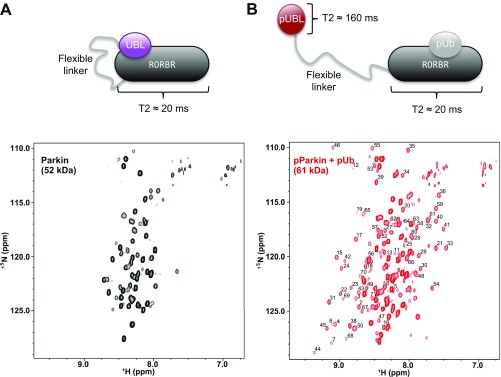
To support our model that phosphorylation of parkin and engagement by pUb are needed to release the pUBL domain, we collected a series of T2-filtered 1H-15N HSQC experiments for parkin, pParkin, and pParkin/pUb. Because backbone 15N atoms in parkin have a short bulk T2 (20 ms) consistent with its 52-kDa size, we used a short T2 relaxation period to effectively suppress most signals arising from the structured domains of parkin. As expected, the resulting 1H-15N HSQC spectrum of parkin showed only a series of sharp signals arising from the flexible linker (residues K76–R140), the tether region (E382–T414), and multiple loops in the protein (Fig. S9A). Remarkably, the addition of pUb to pParkin resulted in the complete appearance of amide resonances assigned to pUBL (Fig. S9B) due to a much longer T2 of these atoms after displacement from R0RBR. This result supports our sedimentation velocity experiments that show the full extrusion of the UBL domain occurs only upon PINK1 phosphorylation and recruitment of pUb.
Fig. S9.
pUb displaces pUBL in full-length, phosphorylated parkin. Shown are - CPMG, T2-filtered HSQC spectra of (A) -labeled full-length parkin and (B) -labeled full-length pSer65 phosphorylated parkin after addition of excess, unlabeled pUb. The spectra are scaled identically and residue assignments for pUBL are indicated. The T2 (transverse relaxation) time of full-length parkin was determined to be 20 ms, owing to its large molecular mass. Conversely, the T2 of isolated UBL was determined to be 160 ms. HSQC experiments were collected with a 30-ms spin-echo period to attenuate signals from the fastest-relaxing component. The much slower decay of free UBL signal compared with parkin can therefore serve as a reporter for release of autoinhibition (54). In parkin’s autoinhibited state, only signals from flexible loops and linkers are visible (A). After activation by PINK1 phosphorylation and pUb binding, pUBL is released from R0RBR and relaxes as a smaller molecular mass entity, enabling its detection beyond the applied spin-echo period (B).
Conclusion
Autoinhibition of parkin activity by its UBL domain is a fascinating evolutionary result to suppress substrate binding in a ubiquitin ligase enzyme. Parkin’s UBL shares high sequence and structural conservation with Ub, yet is significantly less thermodynamically stable (27). We show PINK1 phosphorylation further destabilizes the UBL by modifying its secondary structure, hydrogen bonding, and hydrophobicity, creating a new secondary structural element (2-L) near the phosphorylation site proposed to be important for interactions with the linker based on computational studies (24, 37). The significant structural differences in pUBL compared with pUb show why it cannot compete for the pUb-binding site, yet can independently increase parkin activity, if only partially. We show the orientation of the phosphate group toward H68 and the R0RBR binding interface alters the autoinhibitory interaction and provides a rationale for the weakened affinity observed in trans (14, 15, 22). Further, our results add to the growing consensus that it is primarily the pUb signal that is responsible for the conformational change that relieves UBL-mediated autoinhibition (14, 15, 18, 22, 38). Although the specific order of phosphorylation events in cells remains controversial, parkin has evolved such that each phosphorylation signal induces a positive effect on activity and the receptors for each signal are physically distinct. Therefore, the proposed mechanism of activation is consistent with a feed-forward model to rapidly induce parkin ubiquitination at any stage in the mitophagy cascade (23). The pUBL structure solved here and the model of phosphorylation-activated UBL release provide a unique understanding of parkin’s complex function.
Materials and Methods
Full methods are provided in SI Materials and Methods. Proteins were expressed and purified as described in ref. 15. NMR data were collected on a Varian Inova 600-MHz spectrometer. Structure of pUBL was determined using manual and automatic NOE assignments in CYANA (39), using standard protocols and water refined in X-PLOR-NIH (40). Electrostatic calculations were performed using APBS (32). Interaction experiments of (p)UBL and R0RBR parkin were performed as described in ref. 15. AUC experiments were analyzed in Sedfit (41). Models of pParkin/pUb with unstructured residues 77–142 were generated using the ensemble optimization method (33). Radii of gyration and sedimentation coefficients were calculated in HYDROPRO (34).
SI Materials and Methods
Protein Expression and Purification.
Human parkin (1–465) and UBL domain (1–76) constructs were expressed as His-Smt3 fusion proteins in Escherichia coli BL21(DE3) cells and purified as previously described (15). Briefly, cells were inoculated in LB or minimal media (supplemented with 500 M ZnCl2 for full-length parkin) and grown at 37 °C until an OD600 of 0.8 was reached. Cells were induced at 16 °C overnight with 25 M or M isopropyl -d-1-thiogalactopyranoside (IPTG) for parkin and UBL constructs, respectively. Cells were harvested in buffer containing 50 mM Tris, 400 mM NaCl, and 0.5 mM tris(2-carboxyethyl)phosphine (TCEP), pH 8.0, and lysed, and proteins were purified by Ni2+ affinity. A final purification step by gel filtration was performed on a HiLoad Superdex75 preequilibrated in 25 mM Hepes, 100 mM NaCl, and 0.5 mM TCEP, pH 7.0.
Pediculus humanus GST-PINK1 (128–575) was expressed in E. coli BL21(DE3) cells and purified as previously described by GST affinity capture (15). Purified GST-PINK1 was used to phosphorylate parkin and UBL as follows. Proteins were dialyzed into 50 mM Tris, 50 mM NaCl, and 1 mM DTT, pH 7.5. A PINK1:parkin ratio of 1:2(1:30) was used to phosphorylate full-length parkin(UBL domain). Phosphorylation was initiated by addition of 20 mM MgCl2, 10 mM ATP, pH 7.5, and allowed to proceed at 25 C. The reaction was monitored to completion, using Phos-Tag SDS/PAGE, and confirmed by mass spectrometry. Phosphorylated parkin species were further purified by a second GST affinity capture and gel filtration chromatography to remove GST-PINK1.
NMR Spectroscopy.
All NMR data were collected on a Varian Inova 600-MHz NMR spectrometer. All experiments were performed in NMR buffer [25 mM Hepes, 100 mM NaCl, 0.5 mM TCEP, pH 7.0, 10% (vol/vol) D2O] at 25 °C unless otherwise specified. A total of 200 M 4,4-dimethyl-4-silapentane-1-sulfonic acid (DSS) was used as an internal reference and M imidazole was used as an internal pH indicator. All data were processed using NMRPipe (42) and analyzed using NMRViewJ (43).
pUBL Structure Determination.
Triple-resonance experiments for assignment were collected with /-labeled UBL samples at concentrations of 200–600 M. Backbone and side-chain atom assignments were obtained from HNCA, HNCACB, HNCO, C(CO)NH, HCCH-TOCSY, and (HB)CB(CGCD)HD experiments. -NOESY and -NOESY experiments were collected to define distance restraints. Histidine tautomers and protonation states were determined by C chemical shifts and N chemical shifts in - HSQC and 1H-15N heteronuclear multiple bond correlation (HMBC) experiments (44, 45). Structures were calculated in CYANA, using manual and automatic NOE assignments and dihedral (, ) angle restraints from TALOS+ (39, 46). TALOS+ restraints were not used for residues A46–I66. The standard CYANA protocol was used with eight cycles of structure generation and refinement (100 structures per round). The final 50 structures were water refined using a modified force field in X-PLOR-NIH (40). The 25 structures with the lowest NOE energies were chosen as representative of the calculation. SSP scores were calculated using CA and CB chemical shifts (47). CSI scores were calculated using CA, HA, and CO chemical shifts (48).
Amide Temperature Coefficients.
UBL and pUBL temperature coefficients were determined by collecting 1H-15N HSQC spectra of M 15N-labeled UBL and pUBL from 6 C to 40 C in 5 C increments. After each temperature change, samples were equilibrated for at least 30 min and the final temperature was verified by the chemical shift of water referenced to DSS (49). For each residue, was plotted against T and the slope of the line (temperature coefficient) determined by linear regression. Plots of temperature coefficient vs. chemical shift deviation were generated according to the method of Andersen et al. (29). Hydrogen bonds were confirmed by hydrogen–deuterium exchange. A PD-10 desalting column (GE Healthcare) preequilibrated with NMR buffer in 100% D2O was used according to the manufacturer’s instructions. The earliest fractions (containing D2O exchanged protein but not H2O buffer) were immediately loaded into NMR tubes and spectra recollected identically (∼20 min after exchange).
pKa Measurements.
1H-15N HSQC and 1H-13C HSQC experiments of 15N/13C-labeled UBL and pUBL at 200 M were collected over a range of pH 4.7–8.8. To adjust the pH, ∼1 mL of protein in NMR buffer was mixed with L increments of 1 M HCl or NaOH and monitored by a micro-pH meter until the desired pH. The chemical shift of imidazole was used to verify the pH in the spectrometer (50). To calculate pKa of titrating residues, chemical shifts of residues over the pH range were plotted and fitted to a modified Henderson–Hasselbalch equation: .
Coupling Constants.
coupling constants for /-labeled pUBL (500 M) were determined by quantitative J-correlation (51). The HNHA experiment was collected in three dimensions (HN, N, HA) with a - coupling period of 25 ms. Peak intensities were measured in NMRViewJ (43) and coupling constants determined according to the following equation: Iratio (52).
Heteronuclear NOE.
- NOEs were measured using -labeled UBL or pUBL (500 M) according to the method of Farrow et al. (53). Proton saturation was achieved through a 3-s irradiation period following a 3-s recycling delay. The equivalent nonsaturated experiment contained a 6-s recycling delay. Both saturated and nonsaturated experiments were conducted in duplicate. Peak intensities and heteronuclear NOEs were determined in NMRViewJ (43).
Full-Length Parkin Relaxation Experiments.
T2 relaxation times of -labeled full-length parkin and -labeled UBL were determined by arraying the CPMG period and measuring the envelope of signal intensities at 8.75–9.25 ppm in the first increments of 15N T2 spectra. Two-dimensional - HSQC spectra were collected with a 30-ms delay period (2 × of full-length parkin) as a measure to distinguish short vs. long T2 species (54). The concentration of -labeled parkin was 200 M. The concentration of -labeled pParkin was 150 M with an excess of unlabeled pUb.
Circular Dichroism.
Thermal and chemical denaturation experiments were performed using a JASCO J-810 CD spectropolarimeter equipped with a Peltier temperature control. Data points were collected as an average of three replicate scans. A 1-mm path-length cuvette was used. For all experiments, purified protein samples were dialyzed against three changes of 20 mM KH2PO4, pH 7.0, at 4 C to remove chloride ions. Protein concentrations were verified by measuring absorbance at 280 nm in 6 M Guanidine HCl. For thermal denaturation experiments, the temperature was increased from 5 C to 85 C at a rate of 10 C per hour. For chemical denaturation experiments, proteins were aliquoted into solutions of freshly prepared urea at various concentrations and allowed to reach equilibrium overnight at 4 C. CD spectra were collected the following day at 5 C. Data were fit by nonlinear regression, using GraphPad Prism to determine denaturation midpoint and SE as previously described (27).
Analytical Ultracentrifugation.
Sedimentation velocity experiments were performed on a Beckman XL-A analytical ultracentrifuge equipped with an An60-Ti rotor. Double sector cells (1.2 cm) with quartz windows were filled with 380 L sample and 400 L reference buffer. All data were collected in 25 mM Hepes, 100 mM NaCl, 0.5 mM TCEP, pH 7.0, at 20 C with 60+ min for temperature equilibration. Experiments with isolated UBL were performed at 55,000 rpm (236,000 × g). Experiments with full-length parkin and pUb-bound parkin were performed at 45,000 rpm (158,000 × g). Cells were scanned at equal intervals (60 or 90 scans total) and absorbance was measured at 280 nm. Data were processed by c(s) distribution analysis in SEDFIT v15.01 (39), accounting for equilibration and rotor acceleration times. Partial specific volume (vbar) was 0.719 mL/g, viscosity () was 0.0103 Poise, and density () was 1.0043 g/mL. Sedimentation coefficients observed in buffer were corrected for 20 C in water, and frictional coefficients (f/f0) were calculated from S20,w and known molecular weights of all species. All data were fitted to an rmsd < 0.005 in SEDFIT.
PINK1-Activated Parkin Models.
Randomized models of the flexible linker region in parkin (residues G77–I142) were generated using the ensemble optimization method (v2.1) (33), using coordinates for pUb-bound parkin (5CAW) and pUBL as rigid bodies. Two hundred structural models were generated with native-like CA angles for disordered proteins. Shell models were generated for all 200 structures, using residue-level primary models in HYDROPRO (34). The atomic elements radius (AER) was set at 4.8 Å for all simulations. Viscosity () and density () values were set to 0.01 and 0.99, respectively for 20 C in water. Partial specific volume was unchanged from SEDFIT analysis. Calculated radii of gyration and sedimentation coefficients were extracted for analysis. Visual representation of all 200 structures was done in PyMOL.
Acknowledgments
We thank Helen Walden, Atul Kumar, Viduth Chaugule, and Kathryn Barber for careful reading of the manuscript. We thank Lee-Ann Briere for AUC expertise and Michele Rusal for optimizing phosphorylation protocols. This work was funded by a Canadian Institutes of Health Research operating Grant MOP-14606 (to G.S.S.) and Canada Research Chairs (G.S.S.). J.D.A. thanks Parkinson Canada for support.
Footnotes
The authors declare no conflict of interest.
This article is a PNAS Direct Submission.
Data deposition: The atomic coordinates and structure factors have been deposited in the Protein Data Bank, www.pdb.org (PDB ID code 5TR5). The NMR chemical shifts and restraints have been deposited in BioMagResBank, www.bmrb.wisc.edu (accession no. 30197).
This article contains supporting information online at www.pnas.org/lookup/suppl/doi:10.1073/pnas.1613040114/-/DCSupplemental.
References
- 1.Pickrell AM, Youle RJ. The roles of PINK1, parkin, and mitochondrial fidelity in Parkinson’s disease. Neuron. 2015;85(2):257–273. doi: 10.1016/j.neuron.2014.12.007. [DOI] [PMC free article] [PubMed] [Google Scholar]
- 2.Valente EM, et al. Hereditary early-onset Parkinson’s disease caused by mutations in PINK1. Science. 2004;304(5674):1158–1160. doi: 10.1126/science.1096284. [DOI] [PubMed] [Google Scholar]
- 3.Kitada T, et al. Mutations in the parkin gene cause autosomal recessive juvenile parkinsonism. Nature. 1998;392(6676):605–608. doi: 10.1038/33416. [DOI] [PubMed] [Google Scholar]
- 4.Narendra D, Tanaka A, Suen DF, Youle RJ. Parkin is recruited selectively to impaired mitochondria and promotes their autophagy. J Cell Biol. 2008;183(5):795–803. doi: 10.1083/jcb.200809125. [DOI] [PMC free article] [PubMed] [Google Scholar]
- 5.Matsuda N, et al. PINK1 stabilized by mitochondrial depolarization recruits Parkin to damaged mitochondria and activates latent Parkin for mitophagy. J Cell Biol. 2010;189(2):211–221. doi: 10.1083/jcb.200910140. [DOI] [PMC free article] [PubMed] [Google Scholar]
- 6.Lazarou M, et al. The ubiquitin kinase PINK1 recruits autophagy receptors to induce mitophagy. Nature. 2015;524(7565):309–314. doi: 10.1038/nature14893. [DOI] [PMC free article] [PubMed] [Google Scholar]
- 7.Heo JM, Ordureau A, Paulo JA, Rinehart J, Harper JW. The PINK1-PARKIN mitochondrial ubiquitylation pathway drives a program of OPTN/NDP52 recruitment and TBK1 activation to promote mitophagy. Mol Cell. 2015;60(1):7–20. doi: 10.1016/j.molcel.2015.08.016. [DOI] [PMC free article] [PubMed] [Google Scholar]
- 8.Sarraf SA, et al. Landscape of the PARKIN-dependent ubiquitylome in response to mitochondrial depolarization. Nature. 2013;496(7445):372–376. doi: 10.1038/nature12043. [DOI] [PMC free article] [PubMed] [Google Scholar]
- 9.Spratt DE, Walden H, Shaw GS. RBR E3 ubiquitin ligases: New structures, new insights, new questions. Biochem J. 2014;458(3):421–437. doi: 10.1042/BJ20140006. [DOI] [PMC free article] [PubMed] [Google Scholar]
- 10.Wenzel DM, Lissounov A, Brzovic PS, Klevit RE. UBCH7 reactivity profile reveals parkin and HHARI to be RING/HECT hybrids. Nature. 2011;474(7349):105–109. doi: 10.1038/nature09966. [DOI] [PMC free article] [PubMed] [Google Scholar]
- 11.Chaugule VK, et al. Autoregulation of Parkin activity through its ubiquitin-like domain. EMBO J. 2011;30(14):2853–2867. doi: 10.1038/emboj.2011.204. [DOI] [PMC free article] [PubMed] [Google Scholar]
- 12.Stieglitz B, Morris-Davies AC, Koliopoulos MG, Christodoulou E, Rittinger K. LUBAC synthesizes linear ubiquitin chains via a thioester intermediate. EMBO Rep. 2012;13(9):840–846. doi: 10.1038/embor.2012.105. [DOI] [PMC free article] [PubMed] [Google Scholar]
- 13.Duda DM, et al. Structure of HHARI, a RING-IBR-RING ubiquitin ligase: Autoinhibition of an Ariadne-family E3 and insights into ligation mechanism. Structure. 2013;21(6):1030–1041. doi: 10.1016/j.str.2013.04.019. [DOI] [PMC free article] [PubMed] [Google Scholar]
- 14.Sauve V, et al. A ubl/ubiquitin switch in the activation of Parkin. EMBO J. 2015;34(20):2492–2505. doi: 10.15252/embj.201592237. [DOI] [PMC free article] [PubMed] [Google Scholar]
- 15.Kumar A, et al. Disruption of the autoinhibited state primes the E3 ligase parkin for activation and catalysis. EMBO J. 2015;34(20):2506–2521. doi: 10.15252/embj.201592337. [DOI] [PMC free article] [PubMed] [Google Scholar]
- 16.Kondapalli C, et al. PINK1 is activated by mitochondrial membrane potential depolarization and stimulates Parkin E3 ligase activity by phosphorylating Serine 65. Open Biol. 2012;2(5):120080. doi: 10.1098/rsob.120080. [DOI] [PMC free article] [PubMed] [Google Scholar]
- 17.Shiba-Fukushima K, et al. PINK1-mediated phosphorylation of the Parkin ubiquitin-like domain primes mitochondrial translocation of Parkin and regulates mitophagy. Sci Rep. 2012;2:1002. doi: 10.1038/srep01002. [DOI] [PMC free article] [PubMed] [Google Scholar]
- 18.Koyano F, et al. Ubiquitin is phosphorylated by PINK1 to activate Parkin. Nature. 2014;510(7503):162–166. doi: 10.1038/nature13392. [DOI] [PubMed] [Google Scholar]
- 19.Kazlauskaite A, et al. Parkin is activated by PINK1-dependent phosphorylation of ubiquitin at Ser65. Biochem J. 2014;460(1):127–139. doi: 10.1042/BJ20140334. [DOI] [PMC free article] [PubMed] [Google Scholar]
- 20.Kane LA, et al. PINK1 phosphorylates ubiquitin to activate Parkin E3 ubiquitin ligase activity. J Cell Biol. 2014;205(2):143–153. doi: 10.1083/jcb.201402104. [DOI] [PMC free article] [PubMed] [Google Scholar]
- 21.Wauer T, et al. Ubiquitin Ser65 phosphorylation affects ubiquitin structure, chain assembly and hydrolysis. EMBO J. 2015;34(3):307–325. doi: 10.15252/embj.201489847. [DOI] [PMC free article] [PubMed] [Google Scholar]
- 22.Wauer T, Simicek M, Schubert A, Komander D. Mechanism of phospho-ubiquitin-induced PARKIN activation. Nature. 2015;524(7565):370–374. doi: 10.1038/nature14879. [DOI] [PMC free article] [PubMed] [Google Scholar]
- 23.Ordureau A, et al. Quantitative proteomics reveal a feedforward mechanism for mitochondrial PARKIN translocation and ubiquitin chain synthesis. Mol Cell. 2014;56(3):360–375. doi: 10.1016/j.molcel.2014.09.007. [DOI] [PMC free article] [PubMed] [Google Scholar]
- 24.Caulfield TR, et al. Phosphorylation by PINK1 releases the UBL domain and initializes the conformational opening of the E3 ubiquitin ligase Parkin. PLoS Comput Biol. 2014;10(11):e1003935. doi: 10.1371/journal.pcbi.1003935. [DOI] [PMC free article] [PubMed] [Google Scholar]
- 25.Yamano K, et al. Site-specific interaction mapping of phosphorylated ubiquitin to uncover Parkin activation. J Biol Chem. 2015;290(42):25199–25211. doi: 10.1074/jbc.M115.671446. [DOI] [PMC free article] [PubMed] [Google Scholar]
- 26.Woodroof HI, et al. Discovery of catalytically active orthologues of the Parkinson’s disease kinase PINK1: Analysis of substrate specificity and impact of mutations. Open Biol. 2011;1(3):110012. doi: 10.1098/rsob.110012. [DOI] [PMC free article] [PubMed] [Google Scholar]
- 27.Safadi SS, Shaw GS. A disease state mutation unfolds the parkin ubiquitin-like domain. Biochemistry. 2007;46(49):14162–14169. doi: 10.1021/bi7016969. [DOI] [PubMed] [Google Scholar]
- 28.Baxter NJ, Williamson MP. Temperature dependence of 1H chemical shifts in proteins. J Biomol NMR. 1997;9(4):359–369. doi: 10.1023/a:1018334207887. [DOI] [PubMed] [Google Scholar]
- 29.Andersen NH, et al. Extracting information from the temperature gradients of polypeptide NH chemical shifts. 1. The importance of conformational averaging. J Am Chem Soc. 1997;119(36):8547–8561. [Google Scholar]
- 30.Lee S, Veis A, Glonek T. Dentin phosphoprotein: An extracellular calcium-binding protein. Biochemistry. 1977;16:2971–2979. doi: 10.1021/bi00632a026. [DOI] [PubMed] [Google Scholar]
- 31.Bienkiewicz EA, Lumb KJ. Random-coil chemical shifts of phosphorylated amino acids. J Biomol NMR. 1999;15(3):203–206. doi: 10.1023/a:1008375029746. [DOI] [PubMed] [Google Scholar]
- 32.Baker NA, Sept D, Joseph S, Holst MJ, McCammon JA. Electrostatics of nanosystems: Application to microtubules and the ribosome. Proc Natl Acad Sci USA. 2001;98(18):10037–10041. doi: 10.1073/pnas.181342398. [DOI] [PMC free article] [PubMed] [Google Scholar]
- 33.Tria G, Mertens HDT, Kachala M, Svergun DI. Advanced ensemble modelling of flexible macromolecules using X-ray solution scattering. IUCrJ. 2015;2:207–217. doi: 10.1107/S205225251500202X. [DOI] [PMC free article] [PubMed] [Google Scholar]
- 34.Ortega A, Amoros D, de la Torre JG. Prediction of hydrodynamic and other solution properties of rigid proteins from atomic- and residue-level models. Biophys J. 2011;101(4):892–898. doi: 10.1016/j.bpj.2011.06.046. [DOI] [PMC free article] [PubMed] [Google Scholar]
- 35.Riley BE, et al. Structure and function of Parkin E3 ubiquitin ligase reveals aspects of RING and HECT ligases. Nat Commun. 2013;4:1982. doi: 10.1038/ncomms2982. [DOI] [PMC free article] [PubMed] [Google Scholar]
- 36.Trempe JF, et al. Structure of Parkin reveals mechanisms for ubiquitin ligase activation. Science. 2013;340(6139):1451–1455. doi: 10.1126/science.1237908. [DOI] [PubMed] [Google Scholar]
- 37.Caulfield T, Fiesel F, Springer W. Activation of the E3 ubiquitin ligase Parkin. Biochem Soc Trans. 2015;43:269–274. doi: 10.1042/BST20140321. [DOI] [PMC free article] [PubMed] [Google Scholar]
- 38.Pao KC, et al. Probes of ubiquitin E3 ligases enable systematic dissection of parkin activation. Nat Chem Biol. 2016;12(5):324–331. doi: 10.1038/nchembio.2045. [DOI] [PMC free article] [PubMed] [Google Scholar]
- 39.Guntert P, Mumenthaler C, Wuthrich K. Torsion angle dynamics for NMR structure calculation with the new program DYANA. J Mol Biol. 1997;273(1):283–298. doi: 10.1006/jmbi.1997.1284. [DOI] [PubMed] [Google Scholar]
- 40.Schwieters CD, Kuszewski JJ, Clore GM. Using Xplor-NIH for NMR molecular structure determination. Prog Nucl Magn Reson Spectrosc. 2006;48:47–62. [Google Scholar]
- 41.Schuck P. Size-distribution analysis of macromolecules by sedimentation velocity ultracentrifugation and lamm equation modeling. Biophys J. 2000;78(3):1606–1619. doi: 10.1016/S0006-3495(00)76713-0. [DOI] [PMC free article] [PubMed] [Google Scholar]
- 42.Delaglio F, et al. NMRPipe: A multidimensional spectral processing system based on UNIX pipes. J Biomol NMR. 1995;6(3):277–293. doi: 10.1007/BF00197809. [DOI] [PubMed] [Google Scholar]
- 43.Johnson B, Blevins R. NMR View: A computer program for the visualization and analysis of NMR data. J Biomol NMR. 1994;4(5):603–614. doi: 10.1007/BF00404272. [DOI] [PubMed] [Google Scholar]
- 44.Sudmeier JL, et al. Identification of histidine tautomers in proteins by 2D 1H/13C(delta2) one-bond correlated NMR. J Am Chem Soc. 2003;125(28):8430–8431. doi: 10.1021/ja034072c. [DOI] [PubMed] [Google Scholar]
- 45.Pelton JG, Torchia DA, Meadow ND, Roseman S. Tautomeric states of the active-site histidines of phosphorylated and unphosphorylated III Glc, a signal-transducing protein from Escherichia coli, using two-dimensional heteronuclear NMR techniques. Protein Sci. 1993;2(4):543–558. doi: 10.1002/pro.5560020406. [DOI] [PMC free article] [PubMed] [Google Scholar]
- 46.Shen Y, Delaglio F, Cornilescu G, Bax A. TALOS+: A hybrid method for predicting backbone torsion angles from NMR chemical shifts. J Biomol NMR. 2009;44:213–223. doi: 10.1007/s10858-009-9333-z. [DOI] [PMC free article] [PubMed] [Google Scholar]
- 47.Marsh JA, Singh VK, Jia Z, Forman-Kay JD. Sensitivity of secondary structure propensities to sequence differences between alpha- and gamma-synuclein: Implications for fibrillation. Protein Sci. 2006;15(12):2795–2804. doi: 10.1110/ps.062465306. [DOI] [PMC free article] [PubMed] [Google Scholar]
- 48.Wishart DS, Sykes BD. The 13C chemical-shift index: A simple method for the identification of protein secondary structure using 13C chemical-shift data. J Biomol NMR. 1994;4(2):171–180. doi: 10.1007/BF00175245. [DOI] [PubMed] [Google Scholar]
- 49.Hindman JC. Proton resonance shift of water in gas and liquid states. J Chem Phys. 1966;44(12):4582–4592. [Google Scholar]
- 50.Baryshnikova OK, Williams TC, Sykes BD. Internal pH indicators for biomolecular NMR. J Biomol NMR. 2008;41(1):5–7. doi: 10.1007/s10858-008-9234-6. [DOI] [PubMed] [Google Scholar]
- 51.Vuister GW, Bax A. Quantitative J correlation: A new approach for measuring homonuclear three-bond J(HNHa) coupling constants in 15N-enriched proteins. J Am Chem Soc. 1993;115(17):7772–7777. [Google Scholar]
- 52.Grzesiek S, Bax A. Multiple-quantum line narrowing for measurement of Ha-Hb J couplings in isotopically enriched proteins. J Am Chem Soc. 1995;117(19):5312–5315. [Google Scholar]
- 53.Farrow NA, et al. Backbone dynamics of a free and phosphopeptide-complexed Src homology 2 domain studies by 15N NMR relaxation. Biochemistry. 1994;33(19):5984–6003. doi: 10.1021/bi00185a040. [DOI] [PubMed] [Google Scholar]
- 54.Campbell I, Dobson C, Williams R, Wright P. The simplification of protein NMR spectra. FEBS Lett. 1975;57(1):96–99. doi: 10.1016/0014-5793(75)80160-8. [DOI] [PubMed] [Google Scholar]
- 55.Tomoo K, et al. Crystal structure and molecular dynamics simulation of ubiquitin-like domain of murine Parkin. Biochim Biophys Acta. 2008;1784(7-8):1059–1067. doi: 10.1016/j.bbapap.2008.04.009. [DOI] [PubMed] [Google Scholar]


