Significance
Nucleosomes are fundamental protein–DNA structures through which eukaryotes package and organize DNA inside the nucleus. Nucleosomes are disassembled to gain access to the critical information stored in DNA. Here, we describe a new experimental approach that characterizes the kinetics of nucleosome disassembly and the synergy between DNA conformation and protein components. Using NaCl to disrupt electrostatic interactions, we identify kinetic pathways and transient intermediates that reveal how DNA unwrapping and protein dissociation are linked in this macromolecular complex. These dynamic structures may provide new insight into the regulation of DNA access during transcription, replication, and repair.
Keywords: contrast variation SAXS, FRET, nucleosomes, hexasome, time resolved
Abstract
The nucleosome core particle (NCP) is the basic structural unit for genome packaging in eukaryotic cells and consists of DNA wound around a core of eight histone proteins. DNA access is modulated through dynamic processes of NCP disassembly. Partly disassembled structures, such as the hexasome (containing six histones) and the tetrasome (four histones), are important for transcription regulation in vivo. However, the pathways for their formation have been difficult to characterize. We combine time-resolved (TR) small-angle X-ray scattering and TR-FRET to correlate changes in the DNA conformations with composition of the histone core during salt-induced disassembly of canonical NCPs. We find that H2A–H2B histone dimers are released sequentially, with the first dimer being released after the DNA has formed an asymmetrically unwrapped, teardrop-shape DNA structure. This finding suggests that the octasome-to-hexasome transition is guided by the asymmetric unwrapping of the DNA. The link between DNA structure and histone composition suggests a potential mechanism for the action of proteins that alter nucleosome configurations such as histone chaperones and chromatin remodeling complexes.
Genome access is highly regulated through the hierarchical organization of proteins and nucleic acids within the cell nucleus. The nucleosome core particle (NCP) is the first level of this hierarchy (1) and contains two dimers of H2A–H2B histones and an (H3–H4)2 tetramer that is assembled as a dimer of dimers. Around this symmetric octamer core, ∼146 base pairs of dsDNA are wrapped in ∼1.7 superhelical turns (1, 2). The NCP structure physically impedes access to DNA, but is dynamically modulated by numerous mechanisms: posttranslational modification (PTM) of histones, incorporation of histone variants, DNA sequence-dependent effects, and the actions of extrinsic protein factors (e.g., histone chaperones, ATP-dependent remodeling complexes, and histone PTM binding proteins) (3, 4).
Studies of the intrinsic properties and dynamics of NCPs are critical for understanding how nuclear machinery gains DNA access in vivo (3, 5, 6). Insight into the nature of partially unfolded NCP structures has been gleaned from in vitro studies of NCP assembly and disassembly. Intermediate species with partially unwrapped DNA (5, 7), disrupted histone–histone interfaces (8, 9), and dissociation of one (hexasomes) or two (tetrasomes) H2A–H2B dimers have been reported (10–12). Some of these NCP intermediates have been directly connected to chromatin function in vivo. For example, the hexasome is formed by the action of RNA Pol II (13) and the essential histone chaperone FACT (14).
In addition to equilibrium studies, the kinetics of nucleosome assembly and disassembly have been characterized by bulk and single-molecule methods, including Förster resonance energy transfer (FRET) (7, 8, 15–17), atomic force microscopy (AFM) (9, 18), force spectroscopy (19–21), and small-angle X-ray scattering (SAXS) (10, 22). Many studies focused primarily on specific DNA–histone contacts and local conformational changes. Few, if any studies, use complementary methods to directly compare, on similar kinetic time scales, the structural changes of the DNA and histone components of the NCP. A major gap in our understanding of NCP disassembly arises from our limited knowledge of the coordination between DNA conformation and histone core composition.
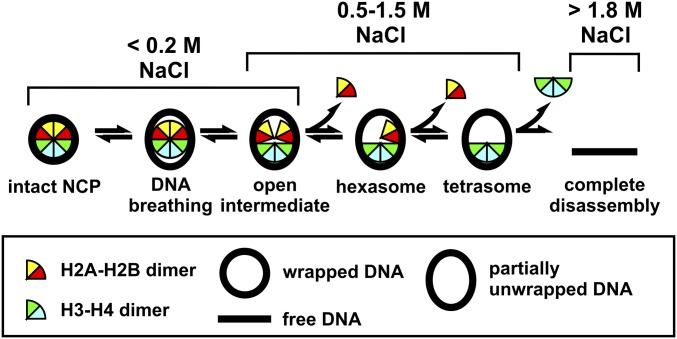
Because the NCP protein–DNA complex is stabilized predominantly by polycation–polyanion interactions, the in vitro equilibrium and kinetic properties can be manipulated by ionic solvent conditions. NaCl has been widely used to study partially assembled, biologically relevant NCP species that are marginally populated under physiological conditions (5, 16, 23, 24). The use of recombinant histones and the Widom 601 DNA sequence (selected for its ability to form stable, well-positioned nucleosomes) (25, 26) allows production of large amounts of homogeneous NCPs (601-NCP) for biophysical studies. Fig. 1 shows the NaCl-induced disassembly pathway for 601-NCPs (7, 8, 23, 24). Whereas the various species shown in Fig. 1 have been detected at equilibrium, much less is known about the kinetics of NCP disassembly, including the relevant transition times and pathways between states, or the potential for coordination between DNA unwrapping and disruption of histone–histone interfaces.
Fig. 1.
A schematic of NaCl-dependent disassembly for NCPs containing the 601-DNA (15), based on equilibrium studies ([NCP] ≥ 25 nM). At physiological ionic strength, NCP configurations reflect local dynamics [i.e., DNA breathing (6), and formation of an open intermediate (8)]. Above 0.5 M NaCl, H2A–H2B dimers begin to dissociate, allowing the formation of hexasomes and tetrasomes (23). Above 1.4 M NaCl, (H3–H4)2 tetramers begin to dissociate, allowing for complete disassembly (24). Although dimer dissociation is reversible, tetrasomes are the minimal configurations required to maintain a wrapped DNA structure.
Our recent time-resolved SAXS (TR-SAXS) study of salt-induced NCP dissociation revealed asymmetric DNA release from the histone octamer (22). In kinetic jumps from ∼0–1.9 M NaCl, a transient intermediate was observed with the DNA in a “J”-shaped conformation bound to a disrupted histone core. We applied contrast variation TR-SAXS to focus solely on the dynamic changes in DNA conformation (22). Information about the histone proteins was restricted to the “endpoint states” of intact or completely dissociated octamer.
Here, we report the coupling of TR-SAXS studies of DNA conformational changes with time-resolved FRET (TR-FRET) studies of H2A–H2B dimer dissociation during salt-induced NCP disassembly. Two conditions are characterized here: complete NCP disassembly following rapid increase from low salt (∼0) to 1.9 M NaCl (as in ref. 22), and partial disassembly upon increase to 1.2 M NaCl. The latter condition allowed observation of DNA conformations that facilitate release of the H2A–H2B dimers. The combination of TR-SAXS and TR-FRET provides insights into the conformational dynamics of open intermediate and hexasome formation (Fig. 1), with important implications for the biological function of the NCP in regulating DNA accessibility.
Results
DNA Unwrapping at 1.9 M NaCl Visualized by TR-SAXS.
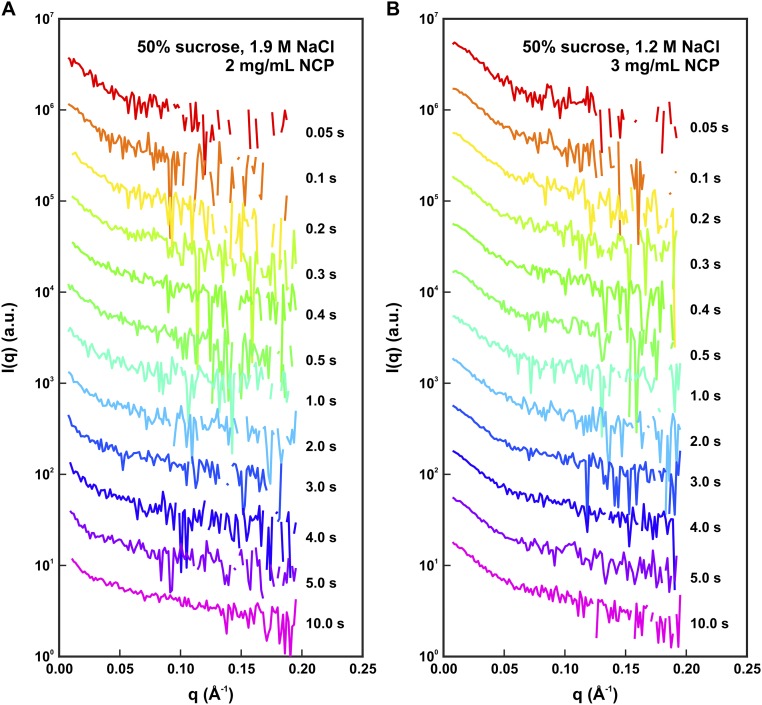
TR-SAXS with contrast variation was used to monitor the DNA conformations during complete NCP disassembly upon the rapid shift from ∼0–1.9 M NaCl by stopped-flow mixing (for SAXS profiles, see Fig. S1A). In standard SAXS measurements, both protein and DNA contribute to the scattering. Interpretation of these SAXS profiles is challenging and requires knowledge of how each component is distributed. Through contrast variation, scattering from the DNA is isolated by matching the electron density of the solvent to that of the protein. As illustrated in Fig. 2, this condition is achieved through the addition of 50% sucrose to the buffer. This contrast-matched condition allows for unambiguous analysis of the DNA conformation because only the DNA contributes to the SAXS signal. Sucrose is an effective contrast additive because it negligibly affects electrostatics (27) and NCP stability (22).
Fig. S1.
Time-resolved SAXS profiles for NCPs destabilized by NaCl in 50% sucrose. (A and B) Time course measured for NCPs in 1.9 M NaCl (A) and 1.2 M NaCl (B). SAXS profiles for the time points after 0.5 s were collected using an attenuated X-ray beam to reduce the effects of radiation damage. Similar signal-to-noise ratios were achieved for the data collected within each salt series by using longer time bins (1 s) for the time points collected with the attenuator (for details, see Materials and Methods). SAXS profiles were offset for enhanced visualization and negative values are not shown on the log plot.
Fig. 2.
Contrast variation SAXS isolates structural information for the DNA component of NCPs. (A) Color scale bar with typical electron density values for solvent (water), protein, and DNA. (B and C) NCP structures (PDB 1AOI) shown in buffers with electron densities that vary depending on the presence of 0% (B) or 50% (C) sucrose. We used contrast variation SAXS to monitor DNA conformations during NCP disassembly induced with a salt jump.
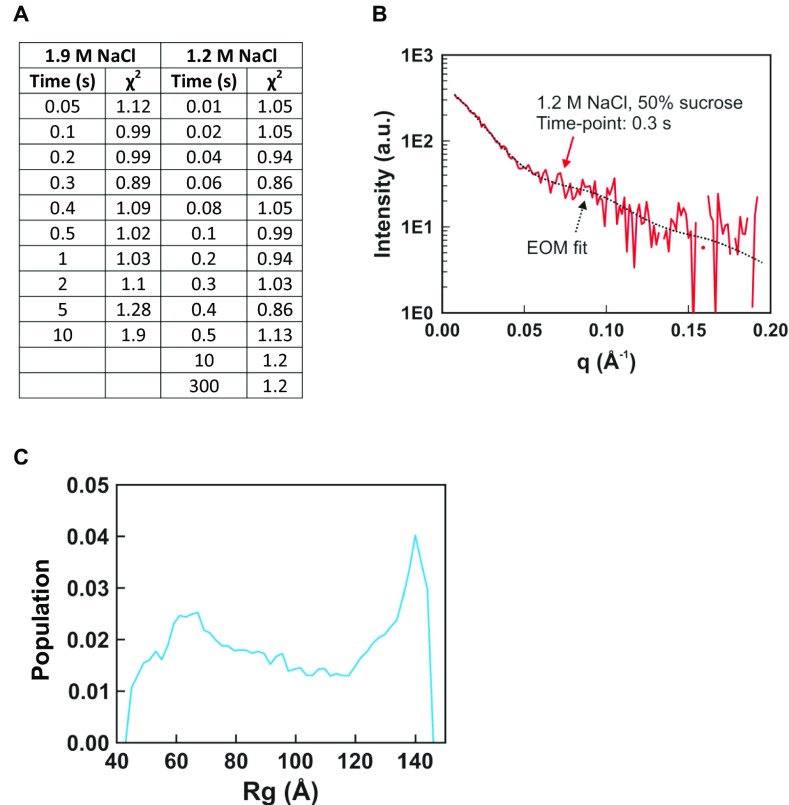
Because previous equilibrium and time-resolved SAXS studies of NCP disassembly revealed the presence of multiple structures, an ensemble optimization method (EOM) was applied to identify ensembles of DNA conformations that best recapitulate the SAXS profiles (22, 28, 29). An overview of this experimental strategy is summarized in Fig. 3. A pool of 9,182 nucleosomal DNA structures was generated with varying degrees of DNA unwrapping to create a large conformational space. For each time point, a genetic algorithm selected a subset of structures (or “ensemble”) that yields a theoretical SAXS profile that best fits the SAXS data (for details, see Materials and Methods; for χ2 values and example fit, see Fig. S2 A and B). The optimized ensemble consists of representative structures that closely approximate the conformations in solution.
Fig. 3.
Overview of the ensemble optimization method (EOM) used for determining structures. Ensemble optimization (step 3, red box) requires SAXS profiles (step 1) and a pool of DNA structures (step 2) that contains a large number of possible conformations. First, the theoretical SAXS profile for each structure in the pool is calculated using CRYSOL (step 3, Left). A genetic algorithm (GAJOE) randomly selects subsets of these structures, called ensembles, for comparison with the input SAXS data (step 3, Right). Structures from the best-fitting ensembles are propagated into the next generation of ensembles along with some new structures, and this process is repeated (10,000 times) until convergence is achieved. The entire ensemble optimization process is repeated (100 times) to confirm reproducibility and the final ensembles that best represent the data are used to generate histograms of the radius of gyration and to determine the most representative structures for the SAXS profiles (step 4). The example fit and results shown are for the 300-ms time point of NCPs in 1.2 M NaCl under contrast-matched conditions (proteins “invisible” in 50% sucrose).
Fig. S2.
Ensemble optimization method (EOM) analysis of TR-SAXS data. (A) Table of χ2 values for EOM fits to TR-SAXS data. (B) Representative fit of SAXS profile calculated for the ensemble of structures selected by EOM that best recapitulate the measured TR-SAXS profile. (C) Histogram of radius of gyration (Rg) values for the DNA pool (9,182 structures) used for EOM analysis. The Rg histograms for the time course of selected ensembles are shown in Figs. 4A and 5A. The pool of DNA structures used in this study was sufficiently large enough to create ensembles of structures that fit the data well.
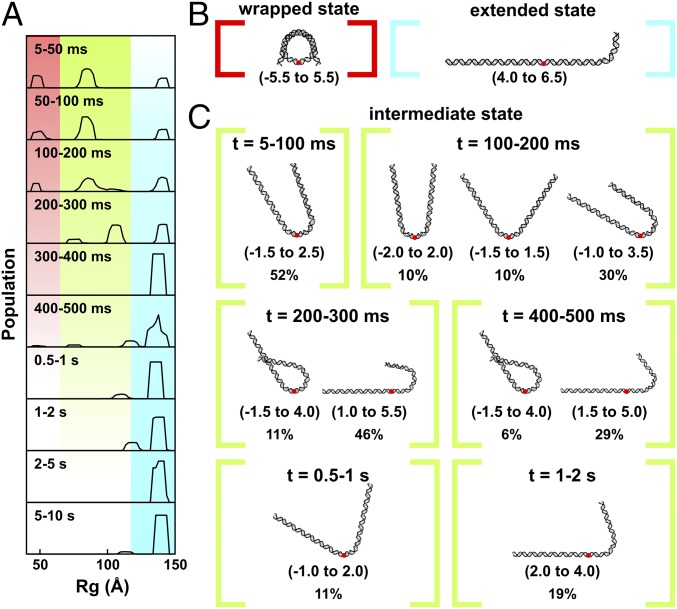
To visualize the ensembles, we calculated size distributions (radius of gyration, Rg) of the structures selected by EOM for each time point (Fig. 4A; for initial DNA pool, see Fig. S2C). Those with an Rg of ∼50 Å represent mostly wrapped DNA. The diminishing amplitude of this peak with time corresponds to the disruption of the canonical NCP structure and the population of other conformations. Population of a state with an Rg near 140 Å (the Rg for a fully extended DNA) represents complete disassembly. Structures with intermediate values of Rg (between the peaks at 50 Å and 140 Å) represent intermediate states. The presence of multiple peaks at each time point suggests heterogeneous populations of NCP structures. The dominant conformations selected by EOM for the fully wrapped and extended states are shown in Fig. 4B and the major conformations selected for the intermediate states are shown in Fig. 4C. Within 100 ms, approximately half of the NCPs contain nearly symmetrically unwrapped DNA in a “U” shape, a quarter of the DNAs are fully wrapped, and a quarter of the DNAs are fully unwrapped. Between 100 and 500 ms, the partially wrapped intermediate states become more asymmetric with most of the population exhibiting J-shaped structures. A small fraction form “teardrop” structures, where one end of the DNA remains wrapped around the histone core, whereas the other is extended. After 2 s, the nucleosomal DNA is predominantly unwrapped.
Fig. 4.
DNA structures selected by EOM analysis of TR-SAXS data for NCPs dissociated in 1.9 M NaCl and 50% sucrose. (A) Rg(t) histograms for DNA structural models selected by EOM. Regions highlighted in red, green, and blue correspond with the fully wrapped, intermediate, and extended states, respectively. (B) Models that best represent the measured SAXS profile for the initial wrapped state (red) and final extended state (blue). (C) Models that best represent the intermediate states as a function of time. Red dots indicate the dyad axis or superhelical location zero (SHL 0). Numbers in the parentheses reveal the range of SHLs (number of turns where the major groove faces the histone, every 10 bp) contained within the curved portions. Percentages show the weights of the species out of the total population at the indicated time point. Under high-salt conditions where complete dissociation of 601-NCPs is favored, multiple partially unwrapped intermediates are populated.
NCP Dissociation at 1.2 M NaCl Visualized by TR-SAXS.
To better characterize transient, asymmetric DNA species, we applied the same approach to study NCP disassembly at a final NaCl concentration of 1.2 M (for SAXS profiles, see Fig. S1B). This lower salt concentration limits disassembly to tetrasome species (tetramer dissociation occurs above 1.4 M NaCl, see Fig. 1) (15, 24) and captures DNA conformations associated with release of the H2A–H2B dimers.
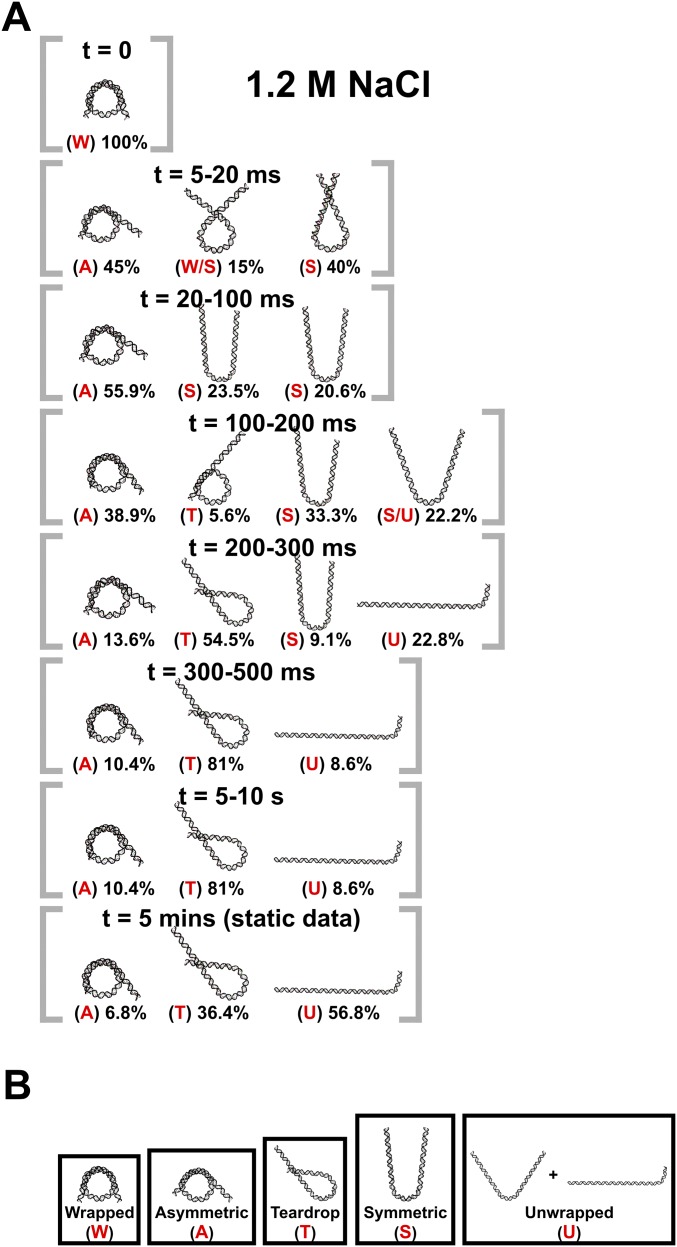
Compared with 1.9 M NaCl, NCP unwrapping at 1.2 M NaCl was significantly slower and was incomplete within our 10-s measurement window. The DNA ensembles selected by EOM (Fig. S3A) are quantified in the Rg histograms shown in Fig. 5A. A fully unwrapped state (Rg ∼140 Å) appears after 300 ms, but comprises only about 8% of the ensemble. In a majority of the NCPs, the DNA remains partially wrapped with Rgs that range from 50 Å to 90 Å. For the first 200 ms of the reaction, these partially wrapped species vary in size and shape; after 300 ms these structures converge to one with an Rg of 76 Å (circled in red). Fig. 5B shows representative structures for the major populations for the first 300 ms, together with proposed pathways for the time-dependent evolution of DNA unwrapping. After 300 ms, the asymmetric teardrop-shaped DNA is the predominant species. As highlighted in Fig. 5 A and B, DNA reaches this structure through two major pathways. In pathway I, the teardrop forms directly as DNA unwraps asymmetrically. In pathway II, DNA initially unwraps symmetrically, but one end rewraps to form the asymmetric intermediate. The teardrop is relatively stable at 1.2 M NaCl and represents 80% of the population at 300 ms and 36% of the population after 5 min (assessed from manual mixing experiments). The presence of two converging pathways was further confirmed by running another ensemble analysis algorithm: the minimal ensemble search (Supporting Information) (30).
Fig. S3.
Ensembles of DNA structures selected by EOM. (A) DNA structures selected for NCPs in 1.2 M NaCl as a function of time. Percentages shown are the weights of the species out of the total population at the indicated time point. (B) Generalized classes of DNA conformations into which the models selected by EOM were grouped. The red letters for each model in A designate how the structures were grouped for subsequent analysis. Multiple letters mean that the population weight was split between the reported classes.
Fig. 5.
DNA structures selected by EOM for NCPs dissociated in 1.2 M NaCl. (A) Rg histograms from DNA models selected by EOM that best represent the SAXS data. Red and green arrows highlight two pathways through which DNA structures change before settling into a prominent peak after 300 ms (circled in red). (B) DNA models selected by EOM before (t = 0) and after mixing into 1.2 M NaCl (20 ms, 100 ms, 200 ms, and 300 ms). Green and red arrows highlight two major pathways through which DNA unwraps to form the teardrop DNA structure. Black arrows show minor pathways. Red dots indicate the dyad axis (SHL 0). Numbers in parentheses reveal the range of SHLs (number of turns) contained within the curved portions. Percentages shown are the weights of the species out of the total population at the indicated time point. Under moderate salt conditions that favor partial disassembly, the majority of structures unwrap symmetrically and asymmetrically before converging into the teardrop structure. (C) Kinetic scheme for complete disassembly with pathways inferred from prominent DNA structures selected by EOM (Fig. S3).
To generate the kinetic pathway for complete disassembly, the DNA structures selected by EOM were binned into general classes of DNA structures (Fig. S3B) and incorporated into the kinetic scheme shown in Fig. 5C.
Kinetics of NCP Core Opening and Sequential H2A–H2B Dimer Release.
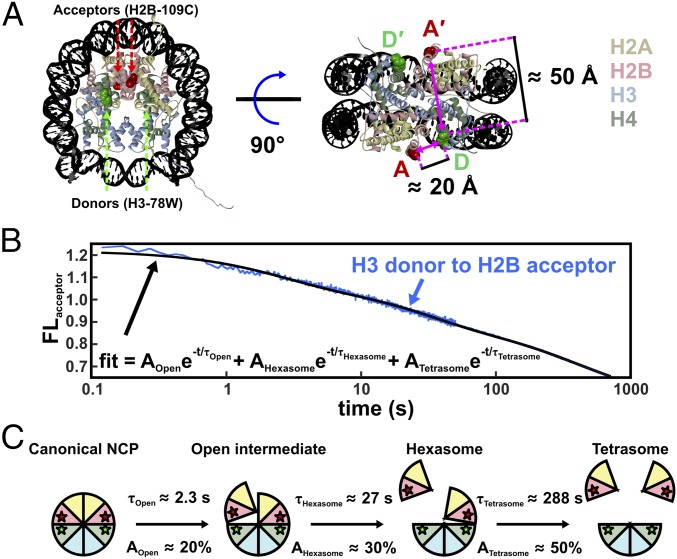
FRET measurements that monitor the dissociation of H2A–H2B histone dimers from the octamer (15) provide complementary information to augment the DNA structures shown in Figs. 4 B and C and 5B. This system exploits unique Trp donors on the (H3–H4)2 tetramer and acceptors on the H2A–H2B dimers, incorporated through modification of single Cys residues with IAEDANS (abbreviated CA). Because the NCP contains two copies of each core histone protein, each NCP contains two donors (D and D′) and two acceptors (A and A′). The sites for the FRET pairs (H3-78W donor to H2B-109CA acceptor) were chosen so that each FRET pair (i.e., the D–A and D′–A′) contributes ∼50% to the overall FRET signal (Fig. 6A), with minimal contribution from the other possible FRET combinations (D–A′ and D′–A). Details of the FRET pairs and their influence on nucleosome stability have been thoroughly investigated in ref. 15. Previous FRET-based studies have mostly focused on DNA unwrapping through the incorporation of FRET pairs between different positions on the DNA (16, 17) or between the DNA and histones (7, 8). The advantage of this protein–protein FRET system is that it allows for unambiguous detection of H2A–H2B dimer release.
Fig. 6.
NCP FRET pairs and the histone configurations observed. (A) FRET pairs with H3-78W donor (green) and H2B-109CysAEDANS acceptor (red). For this construct (H3–H2B NCP), the donor and acceptor on the same face of the NCP (D–A) are close to the Förster radius for this FRET pair (∼20 Å), but the distance from the donor to the acceptor on the other NCP face (D–A′) is significantly longer (∼50 Å) and should contribute less than 1% to the observed FRET signal. The Cβ positions in the 1AOI.pdb structure of the NCP were used to estimate distances between the FRET pairs. (B) Acceptor fluorescence time course measured for 250 nM NCP in 1.2 M NaCl (blue). The solid black line represents a sum of three first-order exponentials used to determine the relative amplitudes and relaxation times. To obtain robust values, global fits were used on datasets collected as a function of NCP concentration (10–250 nM NCP). (C) Histone configurations observed with TR-FRET. Relaxation times (τ) and amplitudes (A) of FRET loss measured at 1.2 M NaCl are reported for each transition.
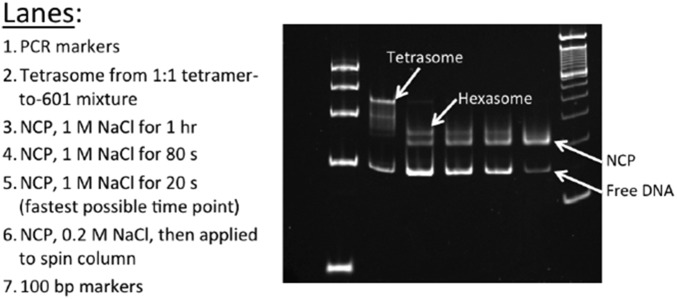
As shown in Fig. 1, equilibrium studies have identified at least three key intermediates that are populated at increasing NaCl concentrations: an open intermediate, the hexasome, and the tetrasome. To assess the relevant time scales for histone dissociation, NCPs were rapidly shifted from ∼0 M into solutions with final NaCl concentrations that ranged from 0.7 to 2 M NaCl. In this survey of [NaCl] dependence, the data were fit to a sum of exponentials and two major kinetic phases were observed for the loss of FRET (for details, see Supporting Information and Fig. S4). These phases were assigned to the formation of the hexasome and tetrasome (supported by native gel electrophoresis of NCPs incubated at 1 M NaCl for varying times) (Fig. S5). There was evidence of a faster, minor kinetic phase (10–20% amplitude), on the 100 ms to 3-s time scale. However, this phase could not be quantitatively analyzed by the experimental approaches used in this survey of NaCl conditions.
Fig. S4.
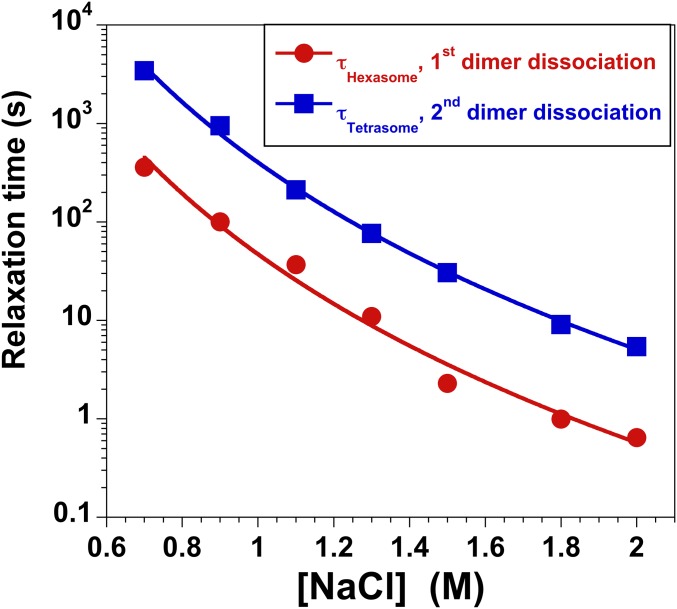
Salt dependence of the kinetic responses measured by FRET using the H3-78W/H2B-109CA donor–acceptor pair. Dissociation was initiated primarily by manual mixing methods, with a time resolution of ∼2 s. However, at NaCl concentrations of ≥1.5 M, the more rapid kinetic response was also determined using stopped-flow mixing, with a time resolution of ∼10 ms. Multiple kinetic traces at a given salt concentration were globally fit to a sum of two exponentials, yielding relaxation times τhexasome (red circles) and τtetrasome (blue squares) describing the dissociation of the first and second H2A–H2B dimers, respectively. The errors associated with the relaxation times are equal to or smaller than the size of the symbols. The lines are drawn to guide the eye and do not reflect a mechanistic fit of the data. Final conditions were as follows: 25 nM NCP, 20 mM Tris-Cl (pH 7.5), 0.1 mM EDTA, 0.1 mM DTT, 25 °C.
Fig. S5.
Gel assay for salt-induced dissociation of NCPs. Native gels for desalted NCPs incubated with NaCl for varying amounts of time show the timescales upon which hexasomes and tetrasomes are formed. Any amount of NaCl leads to the presence of a free DNA band on the gel (a technical artifact). These results qualitatively show that the hexasome is formed on the timescale of 20–80 s, with even slower formation of the tetrasome.
The relaxation times for the two major phases decrease monotonically, in a parallel pattern, with increasing NaCl concentrations (Fig. S4). First, a monotonic decrease demonstrates that the kinetic pathways for dimer dissociation is relatively smooth across NaCl concentrations, which favor partial disassembly to the tetrasome below 1.5 M and complete disassembly above 1.8 M. Thus, SAXS and FRET studies at two NaCl concentrations (1.2 M and 1.9 M) should provide a consistent kinetic model for NCP dissociation, with the caveat that intermediates are likely to be more stably populated at the lower NaCl concentration. Second, the parallel NaCl dependence of these two major kinetic phases suggests that their transition states involve disruption of similar macromolecular interactions. Thus, these kinetic phases likely reflect similar reactions in a sequential mechanism (e.g., dissociation of the first and then second H2A–H2B dimer). This conclusion is supported by analysis of the relative FRET amplitudes from multiple FRET pairs described below.
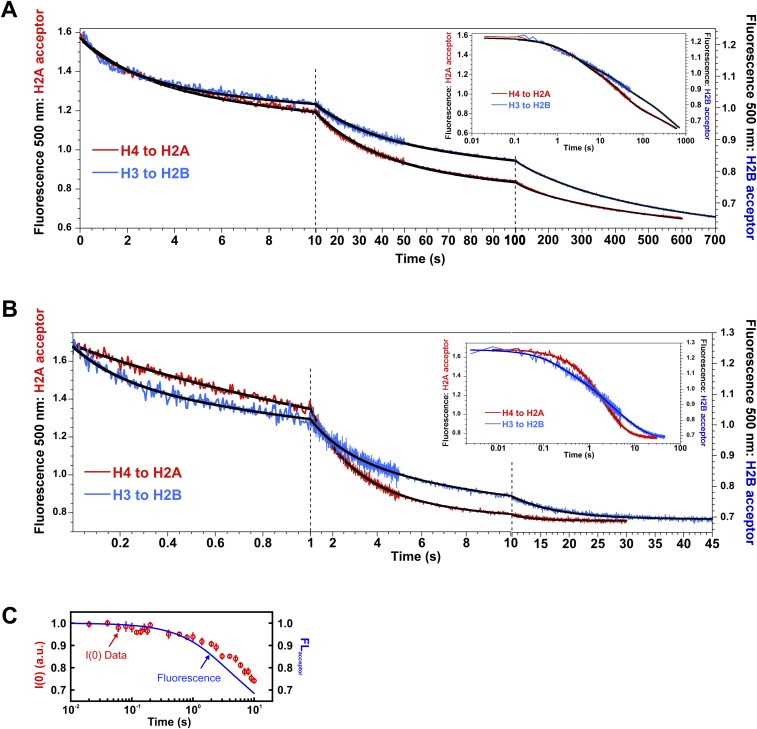
To better characterize the nature of the kinetic phases, especially the fastest, low-amplitude kinetic phase, larger datasets were collected as a function of final NCP concentration (25–250 nM), at 1.2 M and 1.9 M NaCl, using a combination of manual and stopped-flow mixing to monitor reactions from 10 ms to 1,000 s. Datasets at different NCP concentrations were globally fit to three kinetic phases. These results are shown in Fig. 6B and are summarized in Table 1 (for details, see Supporting Information and Fig. S6 A and B). The relative amplitudes for the three kinetic phases provide insight into the conformational changes associated with each phase as shown in Fig. 6C. The relatively small amplitude of the fastest phase (loss of ∼20% of the FRET signal at both 1.2 M and 1.9 M) is consistent with a conformational change that opens the dimer–tetramer interfaces, rather than full dissociation of an H2A–H2B dimer. The larger amplitudes for the slower phases are consistent with dimer dissociation. Surprisingly, the relative amplitudes for the slower, dissociation phases are unequal (∼30% and ∼50%). This amplitude pattern is consistent with a sequential formation of an asymmetric open intermediate, in which only one dimer–tetramer interface is disrupted, followed by dissociation of this H2A–H2B dimer to form the hexasome and then dissociation of the second dimer to form the tetrasome (Fig. 6C). A detailed comparison of this model with that expected for a symmetric formation of the open intermediate is shown in Fig. S7A.
Table 1.
Comparison of relaxation times and relative amplitudes from two FRET pairs and singular value decomposition analysis of TR-SAXS data in the absence of sucrose
| Relaxation times (s)/relative amplitude (%) | ||||||
| Data | 1.2 M NaCl | 1.9 M NaCl | ||||
| τopen/Aopen | τhexasome/Ahexasome | τtetrasome/Atetrasome | τopen/Aopen | τhexasome/Ahexasome | τtetrasome/Atetrasome | |
| H3-78W to H2B-109CA | 2.3 (0.5)/20 (4) | 27 (3)/33 (4) | 288 (30)/47 (6) | 0.22 (0.07)/23 (7) | 1.6 (0.3)/26 (5) | 8.1 (0.8)/50 (7) |
| H4-60W to H2A-108CA | 2.6 (0.6)/23 (3) | 29 (3)/47 (3) | 188 (38)/30 (5) | 0.06 (0.03)/10 (8) | 1.5 (0.2)/58 (14) | 3.7 (0.7)/32 (16) |
| SAXS | 2.7 | 14 | — | 0.21 | 1.2 | — |
The errors associated with the kinetic parameters are indicated in parentheses.
Fig. S6.
Representative FRET responses for NCPs destabilized by NaCl. (A) Acceptor fluorescence time course measured for NCPs in 1.2 M NaCl. Each dataset (averaged over 20 kinetic measurements) shows the decrease in acceptor fluorescence after initiation of the salt jump for each FRET construct used. The final NCP concentration was 250 nM NCP. (B) Same as A, except NCPs were measured in 1.9 M NaCl. The solid black lines represent the global fits to a sum of three first-order exponentials for datasets collected as a function of NCP concentration (10–250 nM NCP). The relaxation times and relative amplitudes derived from these fits are reported in Table 1. Insets in A and B are log scale presentations of time courses. (C) Comparison of relative TR-FRET changes with I(0,t) measured using TR-SAXS for NCPs in 0% sucrose and 1.2 M NaCl. The dynamics measured on overlapping timescales agree well between SAXS and FRET.
Fig. S7.
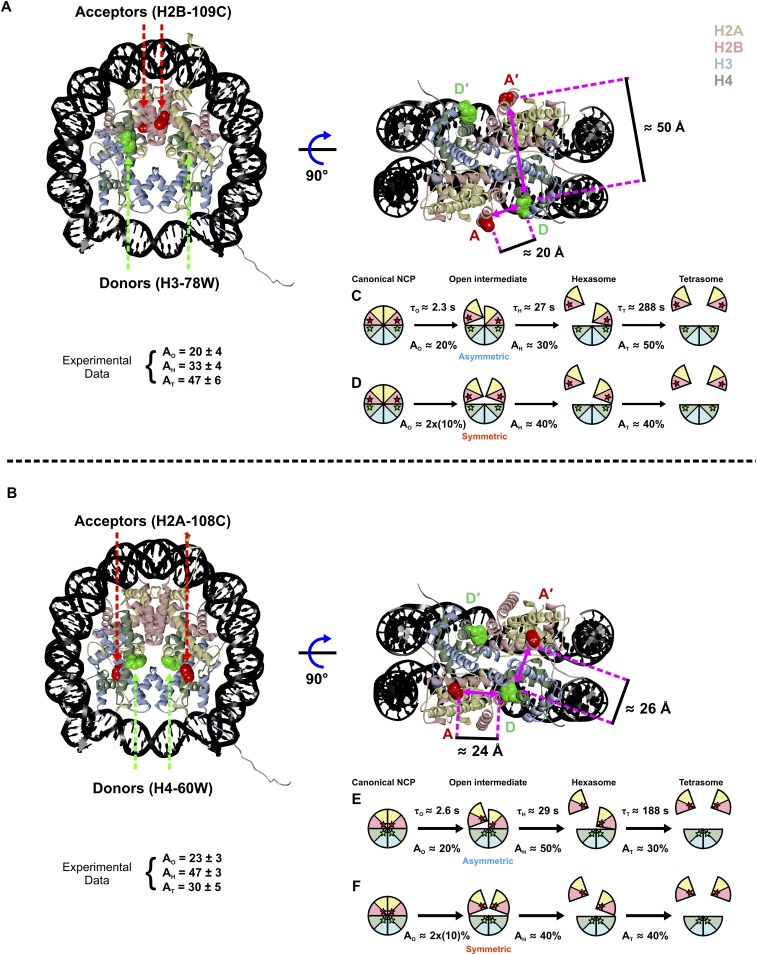
Models of dimer dissociation reported by two different FRET pairs. (A and B) NCP structure (1AOI) highlighting the distances between the FRET pairs: H3-78W donor to H2B-109CA acceptor (H3–H2B NCP) (A) and H4-80W donor to H2A-108CA acceptor (H4–H2A NCP) (B). Due to the symmetry of the structures in both constructs, distances are mirrored between the FRET pairs on both sides. Note: The Förster radius R0 ∼20 Å. The distances for the D–A pair (on the same NCP face) and D–A′ pair (across the NCP) are similar for the H4–H2A NCP. Although equal changes in FRET signals are expected for the D–A and D–A′ interactions, the dissociation of a single H2A–H2B dimer should still be reflected by the loss of ∼50% of the FRET signal due to the symmetry of the construct. Below each model in A and B are the measured FRET amplitudes (as reported in Table 1). (C–F) Models of possible histone configurations to explain the amplitude patterns observed for H3–H2B NCP (C and D) and H4–H2A NCP (E and F). For each FRET pair, the expected amplitude changes are shown for the scenarios that the open intermediate is formed asymmetrically (C and E) and symmetrically (D and F). The measured amplitude patterns differ between H3–H2B NCP (33% → 47%) and H4–H2A NCP (47% → 30%). Release of the first H2A–H2B dimer may slightly destabilize the remaining H2A–H2B dimer (depicted as a slight separation) through the loss of some minor contacts between the two H2A–H2B dimers. The H4–H2A NCP construct may be more sensitive to this destabilization due to the positions of the FRET pair. Our data are most consistent with the sequential formation as follows: canonical NCP → asymmetric open intermediate → hexasome → tetrasome.
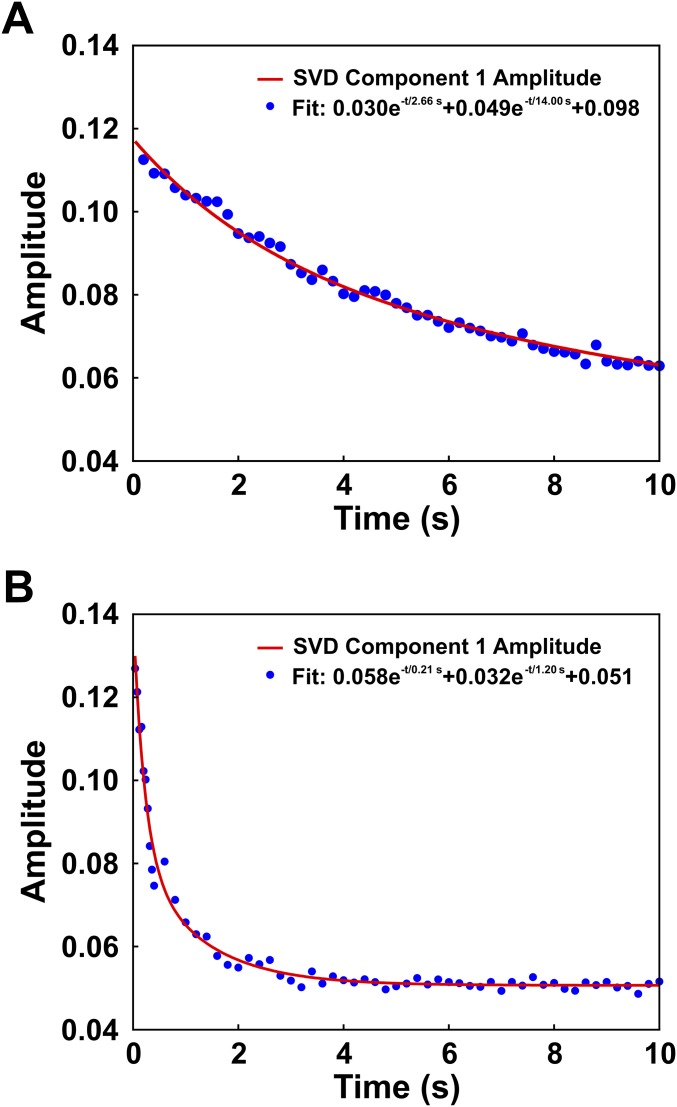
To verify the kinetic model presented in Fig. 6C, kinetic parameters were measured using a second FRET pair (H4-60W donor to H2A-108CA acceptor, Fig. S7B). Despite measuring different interactions, the relaxation times from the second FRET pair (H4–H2A NCP) agree well, and the inequality of the amplitudes for the hexasome and tetrasome phases is consistent with the two dimers being released through different pathways (Table 1, Fig. S7, and Supporting Information). Table 1 also provides kinetic parameters determined from the SAXS data collected in the absence of sucrose (for details, see Fig. S8). The reasonable agreement of relaxation times determined by FRET and SAXS is highlighted in the overlay shown in Fig. S6C.
Fig. S8.
Determination of relaxation times using singular value decomposition (SVD) analysis of the full time course of SAXS profiles. The time-dependent amplitude of the first component is shown for NCPs measured in 0% sucrose and 1.2 M NaCl (A) and 1.9 M NaCl (B). The amplitude dynamics of the first component represents the largest changes observed in the SAXS profiles. These changes correspond with NCP disassembly and reflect both conformational changes as well as changes in molecular mass [changes in the forward scattering, I(0)]. The decreasing amplitudes were fit to sums of exponential decays as shown. The relaxation times observed here are remarkably consistent with the values determined from FRET as shown in Table 1.
Discussion
Although nucleosome disassembly is crucial for DNA access, the dynamics of this process is largely unexplored. This study combines knowledge of the DNA conformations monitored by SAXS with insight into histone configurations reported by FRET to provide details on dynamics and coordination between DNA and histone proteins during NCP disassembly.
Kinetic Models for DNA Unwrapping.
Time-resolved SAXS revealed multiple pathways through which nucleosomal DNA unwraps during salt-induced disassembly. Although small populations of NCPs (<25% at 1.9 M and <10% at 1.2 M) dissociate at a rate that exceeds our limit of detection, in the majority of cases, NCPs progressively unwrap from the ends with rates that increase as a function of [NaCl]. Following a jump to high salt (1.9 M NaCl), complete disassembly is achieved within 10 s. The jump to a lower final salt concentration (1.2 M NaCl) reveals significantly slower kinetics, with a majority of the DNAs remaining partially wrapped. Under both conditions, the DNA unwraps to form asymmetric conformations (J and teardrop shapes). These observations are consistent with previous studies of nucleosomes containing the nonpalindromic 601-DNA sequence, where asymmetric nucleosome stability is observed with the 5′ end showing a greater binding affinity than the 3′ end (26). Asymmetric unwrapping may be a generalizable feature of DNA sequences with asymmetric affinities, as observed for both the 601- and 5S-DNA sequences (22).
The slower kinetic responses at 1.2 M NaCl reveal two pathways to form the teardrop DNA. In addition to asymmetric unwrapping (pathway I), the detection of symmetric unwrapping and rewrapping of one end to form the same conformation (pathway II) highlights the potential for coordination between the DNA ends. These results are consistent with that reported by Ngo et al. using force-FRET spectroscopy and Monte Carlo simulations (21). Under low tension (<5 pN), they report that both DNA ends unwrap and rewrap synchronously, but further opening of one end stabilizes the rewrapping of the other end in a manner that is directed by the local flexibility of the DNA. They suggest that the unwrapping of one end may help stabilize the wrapping of the other through an overall reduction in electrostatic repulsion. Interestingly, the rewrapping observed in our work is observed under conditions where electrostatic interactions should be effectively screened (1.2 M NaCl). One possible explanation is that the rewrapping is facilitated by the histone tails.
For some of the asymmetric models determined in this study, the curved portion of the DNA that remains in contact with the histone core appears shifted away from the dyad and closer to the entry/exit sites compared with canonical structures. This conformation may depend on a sliding of the histone–DNA contacts (31). One intriguing possibility is that the partial DNA unwrapping may help facilitate nucleosome sliding.
Structures and Pathways of Hexasome Formation Suggest DNA-Directed NCP Disassembly.
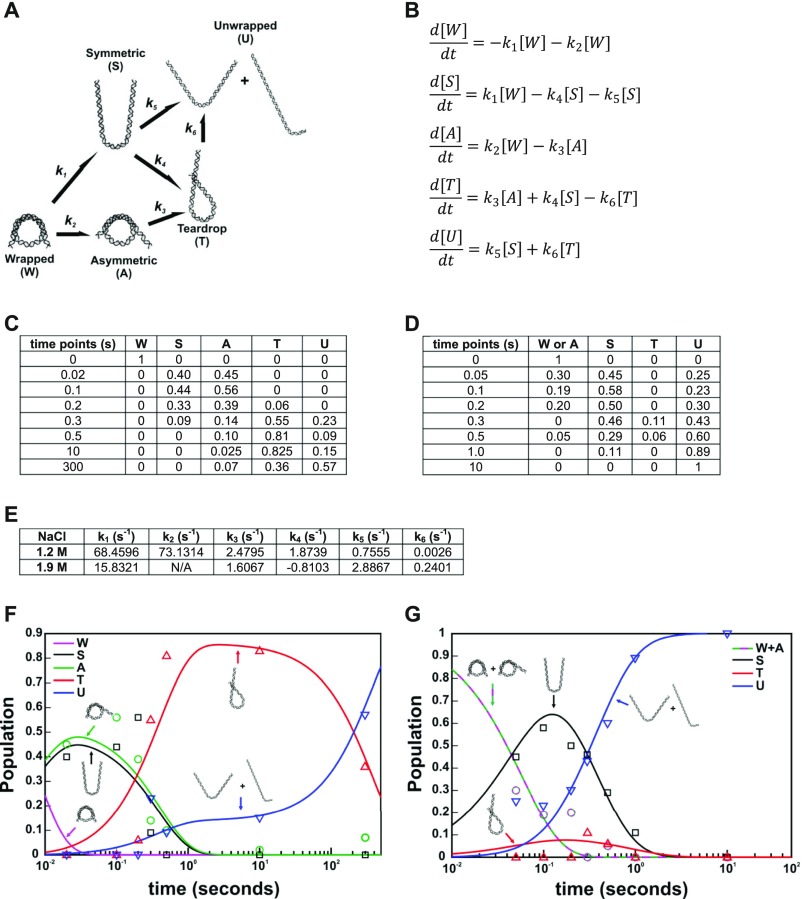
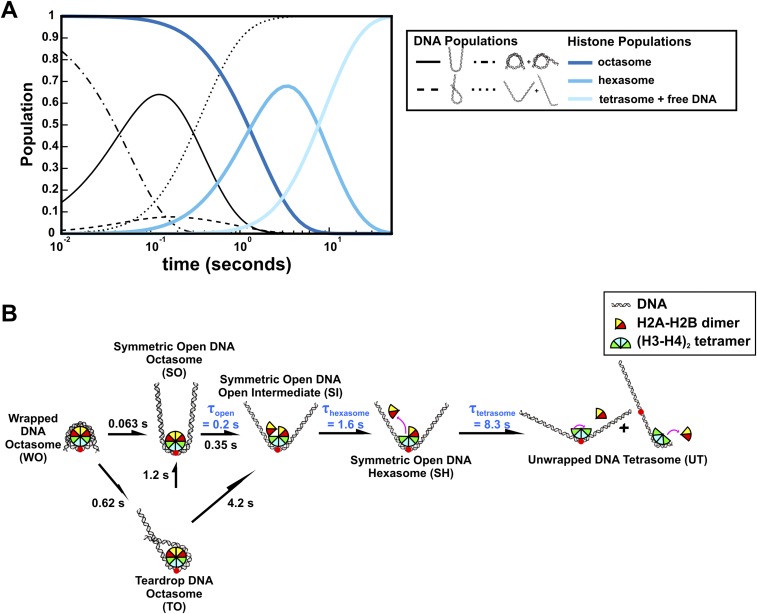
The integrated results from SAXS and FRET at 1.2 M NaCl provide insight into the transient species populated by 601-NCPs. The time-resolved DNA populations (classified in Fig. S3) were globally fitted to the kinetic scheme shown in Fig. 5C to obtain relaxation times (Fig. S9). These globally fitted populations are shown as a function of time in Fig. 7A, along with the expected populations of the histone configurations based on the H3–H2B NCP FRET data in Table 1. The complete kinetic scheme of NCP disassembly at 1.2 M is presented in Fig. 7B (for details, see Supporting Information).
Fig. S9.
Calculation of kinetic rates from structures selected by EOM. (A) Kinetic scheme with pathways inferred from prominent DNA structures selected by EOM analysis for NCP data collected in 50% sucrose and 1.2 M NaCl (DNA structures selected at 1.9 M NaCl were nearly identical). (B) Kinetic equations describing the population dynamics for the kinetic scheme in A. (C) Time course of DNA structure populations determined from EOM analysis for NCP data collected with 50% sucrose and 1.2 M NaCl. (D) Same as C, except using results for 1.9 M NaCl. (E) Rates for the kinetic scheme in A determined by solving the kinetic equations in B using population data for NCPs in 1.2 M (C) and 1.9 M (D) NaCl. Note: Convergent solutions were achieved using the same kinetic scheme for both datasets, suggesting that the overall structures through which DNA unwraps are similar at both salt concentrations. However, the rates determined are quite different between these two conditions and indicate that not only is unwrapping faster at higher salt, but different pathways are preferred depending on [NaCl]. The opposite sign of k4 at 1.9 M NaCl suggests that the symmetric unwrapped DNA is preferred over the teardrop at the more destabilizing condition. (F) Population data in C plotted with the simulated populations (lines) determined from the solved kinetic equations for 1.2 M NaCl (E). (G) Same as F, except using results for 1.9 M NaCl (D and E). Note: the asymmetrically unwrapped DNA state (A) was not observed sufficiently enough in 1.9 M NaCl to be reliably fit; thus it was not included in the fitting and k2 and k3 are linked together.
Fig. 7.
TR-FRET and TR-SAXS analyses reveal hexasome formation at 1.2 M NaCl. (A) Predicted populations of DNA conformational states (black lines) and histone configuration states (blue lines) based on the kinetic rates determined for NCPs at 1.2 M NaCl from the kinetic analysis of EOM models (Figure 6A, see details in Fig. S9) and TR-FRET measurements (Table 1), respectively. (B) NCP disassembly pathway determined from TR-SAXS with histone configurations informed by TR-FRET. Black numbers reflect the SAXS relaxation times (inverse of rates in Fig. S9C). Blue numbers reflect the FRET relaxation times (Table 1). The curved black arrow represents a minor pathway. For simplicity, histone orientations were centered on the dyad when possible.
The DNA rapidly unwraps from the histone octamer to form the teardrop DNA, which is the dominant conformation on the 0.2- to 1-s timescale. This teardrop conformation forms appreciably faster than the 2–30 s required for the asymmetric opening that disrupts an interface between the (H3–H4)2 tetramer and one of the H2A–H2B dimers and subsequent dissociation of the first dimer to form the hexasome. Such a state, containing partially unwrapped DNA, but a full complement of histone proteins, is completely consistent with results of Li and Widom (6), suggesting that contacts between the DNA and H2A–H2B dimers are disrupted by conformational dynamics observed under physiological conditions, yet other contacts prevent immediate release of one of the heterodimers. Thus, the teardrop DNA precedes changes in the histone octamer conformation, suggesting that the unwrapped DNA end acts like a gate to expose the proximal H2A–H2B dimer for release. The DNA further unwraps and releases the remaining dimer to form the tetrasome. This picture is in full agreement with equilibrium studies reported by Böhm et al. (8).
This work suggests an intriguing mechanism for NCP remodeling in which DNA conformation facilitates the reconfiguration of the histone core. Although the asymmetric nature of the DNA unwrapping and subsequent dimer dissociation observed here was directed by the asymmetry of the tightly positioning 601 sequence, this mechanism may be exploited by gene regulatory proteins as a general strategy to exchange (32) or modify (33) one H2A–H2B dimer while simultaneously protecting the other. The combined SAXS and FRET approach used in this work is readily adaptable to test the hypothesis that, in addition to direct interaction with the histone core, key partner proteins, such as chromatin remodelers or histone chaperones, affect the composition of the histone core by interacting with and altering nucleosomal DNA conformation.
Materials and Methods
NCP Production and Reconstitution.
Previously described procedures were used for the expression and purification of recombinant Xenopus laevis histones (15, 34, 35), production of the 149-bp DNA derived from the Widom 601 sequence (15, 25) and their reconstitution into NCPs (22). Unless noted otherwise, experiments were conducted with the following buffer: 20 mM Tris-Cl (pH 7.5), 0.1 mM EDTA, and 0.1 mM DTT.
TR-SAXS Experiments.
All TR-SAXS experiments were conducted using a Biologic SFM-400 stopped flow mixer at BioCAT Sector 18 at Advanced Photon Source (APS). The experimental procedures and SAXS image analysis are described in detail in Supporting Information.
Ensemble Optimization Method (EOM).
Ensembles of DNA structures that best recapitulate the measured TR-SAXS profiles were selected using the program GAJOE v2.0 (28, 29). The DNA pool included 9182 structural models generated using PyMol (expanded from 32 models in ref. 22). Details on model generation are described in Supporting Information. The q-range used for GAJOE fitting was 0.006–0.2 Å−1. Rg histograms of selected DNA models were averaged from 100 independent repeats of the genetic algorithm. Parameter settings: number of harmonics = 50, maximum s-value = 0.25, number of points = 101, number of generations = 10000, number of ensembles = 200, ensemble size fixed = no, maximum/minimum number of curves per ensemble = 1, constant subtraction = no, number of times genetic algorithm repeated = 100.
The reliability and uniqueness of the solutions achieved by the genetic algorithm depend on two interdependent factors (1): the size and diversity of the pool (which needs to contain an ensemble that fits the data well, e.g., χ2 ≤ 2) and (2) the number of generations and iterations of the algorithm (to provide sufficient sampling and evolution to find the best fitting ensemble). The solutions obtained for a given SAXS profile using the DNA pool and parameter settings described above consistently converged to give nearly identical ensembles (with 0- to 2-bp variations).
TR-FRET Experiments.
A previous paper described the design of a FRET system to monitor interactions in the NCP specifically between the H2A–H2B dimers, with Cys-AEDANS acceptors, and the (H3–H4)2 tetramer, with Trp donors (15). See details in Supporting Information.
TR-SAXS Experiments
All TR-SAXS experiments were conducted at BioCAT Sector 18 at Advanced Photon Source (APS): X-ray energy = 10 keV, sample-to-detector distance ∼2.5 m. The experimental procedures and SAXS image analysis are described in detail in ref. 22. Briefly, time resolution was achieved by incorporating a Biologic SFM-400 stopped-flow mixer. Custom sample cells used quartz capillaries (2-mm path length, 10-µm walls) from Hampton Research. NCPs in ∼0 M NaCl (none added) were mixed with high salt buffers (3.125 M NaCl) at a ratio of 2:3 (respectively) to achieve a final NaCl concentration of 1.9 M, and at a ratio of 3:2 to achieve a final NaCl concentration of ∼1.25 M. The final NCP concentration was ∼2–3 mg/mL (10–15 µM). Matching buffers were measured before and after each experiment by replacing the NCP sample syringe with 0 M NaCl buffer. Measurements were made with 0% and 50% sucrose.
A PILATUS 100K (Dectris) detector was operated in “movie mode” to capture the scattering patterns as a function of time. Because the samples showed radiation damage when exposed to the full X-ray beam at APS after 500 ms, two data collection schemes were used to span short and long time points. For short timescales, images were acquired using full beam for the first 500 ms in 5-ms intervals (2-ms exposure + 3-ms readout) for 0% sucrose, and 10-ms intervals (7-ms exposure + 3-ms readout) for 50% sucrose. For long timescales, 10 s of data were collected with an attenuated X-ray beam and an acquisition interval of 100 ms (95-ms exposure + 5-ms readout) for both 0% and 50% sucrose. Longer time scales (>10 s) were limited due to backflow in the mixer.
TR-SAXS Data Analysis
All SAXS images were processed using MATLAB (MathWorks) as in ref. 22. For longer time points (>50 ms), SAXS profiles from multiple frames were binned to improve the signal-to-noise ratio (at the expense of time resolution). SAXS profiles for corresponding time bins from subsequent repeats (4–10 for each condition) were averaged to improve the signal-to-noise ratio. I(0,t) was calculated using GNOM (36).
Generation of EOM DNA Models
The DNA pool included 9,182 structural models generated using PyMol [expanded from 32 models in ref. 22)]. In addition to the fully wrapped (PDB: 1AOI) and fully extended [generated using Nucleic Acid Builder (37)] DNA conformations, 9,180 DNA models were generated with varying degrees of unwrapping (with single base pair resolution) by appending two linear DNA fragments to the two ends of one curved DNA component from 1AOI. Because each model consisted of three DNA components (two linear and one curved components) each had a minimum of 5 bp for accurate alignments. The linear DNA components contained 4 extra base pairs for alignment with the curved DNA component that were removed after stitching.
Minimal Ensemble Search
To independently validate the EOM-based result that multiple DNA species are required to fit the data, we ran Minimal Ensemble Search (MES) for the data acquired at 100 ms, 300 ms, and 300 s (1.2 M NaCl, 50% sucrose). MES identifies the minimal number of conformations required to fit the data (30). For the 100-ms time point, the χ2 value improved from 0.93 to 0.90 as a second DNA structure was added; however, further addition of structures beyond the second structure negligibly affected the χ2 value. For the 300-ms time point, the χ2 value improved from 0.99 to 0.96 as the number of structures increased from one to two. Additional structures did not improve the χ2 value. The two structures selected by MES to best represent the data at 300 ms were the teardrop structure (91%) and the unwrapped structure (9%). The dominance of the teardrop structure at 300 ms agrees with the results of EOM. For the 300-s time point, the χ2 value improved from 0.93 (one structure) to 0.90 (two structures). The two structures selected by MES included the teardrop (60%) and unwrapped (40%) structures. These results support the presence of the converging kinetic pathways to form the teardrop structure depicted in Fig. 5B.
Kinetic Models for NCP Disassembly
The dynamic populations of NCP species observed by EOM at different salt conditions are summarized in the kinetic models shown in Fig. 7 and Fig. S10. In 1.2 M NaCl (Fig. 7), the DNA rapidly unwraps from the histone octamer to form the teardrop conformation through two parallel pathways. In pathway I, DNA unwraps from one end: wrapped DNA octasome (WO) → asymmetric open DNA octasome (AO) → teardrop DNA octasome (TO). In pathway II, DNA unwraps from both ends and the more flexible end rewraps: WO → symmetric open DNA octasome (SO) → TO. Instead of rewrapping, the SO can further unwind both DNA ends and release dimers sequentially to form open DNA tetrasome (OT). However, because this transition (SO → OT) is ∼2.5 times slower than the rewrapping transition (SO → TO), the majority of NCPs (>80%) form the TO after ∼0.5 s. The first H2A–H2B dimer dissociates in a stepwise manner through an open intermediate: TO → teardrop DNA open intermediate (TI) → teardrop DNA hexasome (TH). Unwrapping of the TO → OT is a slow process (∼380 s) in 1.2 M NaCl. Although the hexasome forms within ∼30 s (TO → TH), the second dimer is protected from release by the teardrop DNA conformation for >100 s (TH → OT). Tetrasome formation occurs after both DNA ends unwrap and is one order of magnitude slower than hexasome formation.
Fig. S10.
Predicted populations and kinetic pathway of salt-induced NCP dissociation in 1.9 M NaCl. (A) Predicted populations of DNA conformational states (black lines) and NCP oligomerization states (blue lines) based on the kinetic rates determined from EOM analysis (Fig. S9) and TR-FRET measurements (Table 1), respectively. (B) Kinetic models of salt-induced NCP dissociation in 1.9 M NaCl. The DNA conformations, associated pathways, and relaxation times (black numbers) were deduced from the SAXS EOM analysis (Fig. 4). For each DNA conformation, the oligomeric state of the histone core was deduced from the lifetime of the hexasome and tetrasome populations (A). The relaxation times for dimer dissociation (blue numbers) were measured by TR-FRET (Table 1). For simplicity, histone orientations were centered on the dyad when possible. In 1.9 M NaCl, the majority of the DNA unwraps from both ends simultaneously, followed by dimer dissociation.
Parallel pathways are also observed in 1.9 M NaCl (Fig. S10). However, at this more destabilizing condition, unwrapping of both ends (WO → SO) is the dominant pathway because it occurs nearly 10 times faster than unwrapping from only one end (WO → TO). Once both DNA ends unwrap, neither end rewraps to form the teardrop conformation as observed in 1.2 M NaCl (note the directional difference of the transition between SO and TO in 1.2 M and 1.9 M NaCl). Consequently, TO is only formed through pathway I and made up about 10% of the population in ∼0.6 s. NCPs with the teardrop DNA are short lived and the wrapped DNA end is quickly released after ∼1 s, resulting in the formation of more unwrapped octasomes (TO → SO). DNA unwrapping precedes dimer dissociation, and hexasomes and tetrasomes form sequentially after the DNA unwraps into open conformations [symmetric open DNA intermediate (SI) → SH → UT].
TR-FRET Experiments and Analysis
Two FRET pairs were used: H3-78W-to-H2B-109Cys-AEDANS or H4-60W-to-H2A108Cys-AEDANS. This Trp to Cys-AEDANS FRET pair was chosen because the relatively short Förster radius of this dye pair (∼20 Å, compared with ∼50–60 Å for Cy3–Cy5) optimizes the system’s sensitivity to dimer dissociation. Furthermore, the small size and small hydrophobic surface of the probes should reduce perturbations to the protein structure. Fluorophore incorporation was >90%.
Time-resolved data were collected using an AVIV ATF 105/305 spectrofluorometer interfaced with an AVIV stopped-flow tower. The excitation wavelength was 290 nm, and acceptor fluorescence was monitored at 500 nm. Dissociation reactions were initiated by diluting NCP solutions in 0 M NaCl into high salt buffers, either by stopped flow (SF) or manual mixing (MM). SF data were collected from the dead time (5 ms) to 600 s at 1.2 M and 30 s at 1.9 M. To improve the signal-to-noise ratio, ∼20 kinetic traces were averaged for each SF experiment. The instrumentation setup for MM allowed monitoring of the slower kinetic responses (from ∼2 s to 600–2,000 s) with closure of the spectrometer chopper between time points to minimize photobleaching.
For NCP dissociation at NaCl concentrations of 1.2 and 1.9 M, datasets of 14–21 kinetic experiments were collected with varied final NCP concentrations of 10, 25, 50, 100, and 250 nM. The datasets for each FRET pair were fitted globally to a sum of three first-order exponentials using the Savuka 6.2.32 program (38). In the global analyses, the relaxation times were linked across all kinetic experiments, thus treated as independent of NCP concentration; the amplitudes associated with each phase were treated as local parameters for each kinetic trace.
The combination of manual mixing and stopped-flow mixing allowed kinetic responses to be monitored over timescales ranging from 10 ms to 1,000 s (Fig. S6). Initially, kinetic traces were fit individually to a sum of three exponentials, to assess the effect of NCP concentration on relaxation times and relative amplitudes. No significant dependence was observed for any parameter across this range of NCP concentrations. This independence is not unexpected given that the dissociation is a first-order process, even though at 1–2 M NaCl, the overall stability of the NCP is concentration dependent (for example, ref. 15). Subsequent data analyses used global fitting, which treated the relaxation times as independent of NCP concentration.
The kinetic parameters measured by FRET are summarized in Table 1. The errors (shown in parentheses) are reported at one SD from these averaged values. For the relaxation times determined by FRET, the errors at one SD were determined from a multidimensional analysis of the global fit of the datasets as described in ref. 38, pp 37–54. The relative amplitudes are the average of values from individual traces, treated as local parameters in the global analyses of datasets containing 14–22 kinetic traces.
Interpretation of TR-FRET Using Two FRET Pairs
Even though the two FRET pairs monitor different histone–histone interactions, the relaxation times determined by the two FRET pairs were quite comparable. The only notable differences are the fastest and slowest relaxation times observed at 1.9 M. When the relaxation times were globally fitted, linked across all kinetic traces for both the H3–H2B and H4–H2A FRET pairs, the quality of the fits were similar to those for fits of the individual FRET pairs (reduced χ2 values within 10%); the fitted relaxation times were 200 ms, 1.8 s, and 8.3 s.
The fastest FRET relaxation time at 1.2 M NaCl, ∼2.5 s, is slower than the reactions that populate the partially unwrapped NCP structures detected by EOM analysis of the SAXS data (Fig. 5). The relatively small amplitude of the fast phase (loss of ∼20% of the FRET signal) is consistent with a conformational change that opens the dimer–tetramer interfaces, rather than dissociation of an H2A–H2B dimer. Thus, there appears to be an uncoupling of DNA and histone conformational changes under mildly destabilizing NaCl concentrations. A similar “open” τopen is detected by FRET at 1.9 M NaCl. However, at this more destabilizing NaCl concentration, the protein–protein conformational changes are concomitant with the slower, large-scale DNA unwrapping reactions.
The slower relaxation times are associated with loss of ∼80% of the FRET signal. Surprisingly, the relative amplitudes for τhexasome and τtetrasome are unequal, despite both reactions corresponding to the loss of an H2A–H2B dimer. Furthermore, the two FRET pairs exhibit opposite patterns for whether the amplitude of τhexasome is greater or less than the amplitude of τtetrasome. As elaborated below, comparisons of the amplitude patterns for the two FRET pairs are indicative of an asymmetric opening of the histone interfaces in the τopen phase (Fig. S7). This asymmetry is consistent with the asymmetry of the DNA structures detected by EOM after ∼200 ms in 1.2 M NaCl (Fig. 5) and the asymmetric DNA unwrapping of the intermediates populated between 200 and 500 ms at 1.9 M NaCl (Fig. 4).
For the H3–H2B NCP, there are two symmetric donor–acceptor pairs (D–A and D′–A′), which should contribute equally to the observed FRET signal (Fig. 6A and Fig. S7A). Thus, symmetric opening and subsequent formation of the hexasome and tetrasome would predict relative amplitudes of 20% for τopen (10% for D–A and 10% for D′–A′) with 40% for both τhexasome and τtetrasome phases, arising from equal loss of FRET for dissociation of D–A and D′–A′ dimers (illustrated in Fig. S7D). The observed amplitude pattern of 20:30:50 can be explained by disruption of only one H2A–H2B/H3–H4 interface in an asymmetric τopen reaction, and then the affected dimer is released in the τhexasome phase (Fig. S7C). Given the position of the FRET pairs, the asymmetric opening is likely to affect the H2B–H4 four-helix bundle. Thus, dissociation of the first H2A–H2B dimer leads to a loss of 50% of the FRET in two steps (20% + 30%). Dissociation of the second dimer in the τtetrasome reaction accounts for the other 50% decrease in the FRET amplitude (Fig. S7C).
For the H4–H2A NCP, nearly equal changes in FRET signals are expected for the D–A and D–A′ interactions (Fig. S7B). A symmetric opening and dimer dissociation would predict similar FRET amplitudes for the τhexasome and τtetrasome phases (Fig. S7F). The relative amplitude for the first dimer dissociation is significantly larger than for the second, by a margin of 17–26% (Table 1). Despite an overall low amplitude, limited kinetic data for the H3-78W-to-H2A-108CA at 1.5 M NaCl showed a similar result of diminished amplitude for the second dimer dissociation (relative amplitudes of 40:40:20 for three relaxation times). It is not possible to deconvolute the relative amplitudes into specific conformational changes for the same-face and cross-NCP FRET pairs. However, the results from the two H2A-CA containing FRET pairs suggests that increased mobility of the H2A tail contributes significantly to the τopen relaxation time and first dimer dissociation.
Even though the two FRET pairs (H3–H2B NCP and H4–H2A NCP) monitor different histone–histone interactions, the three relaxation times determined by the two FRET pairs were quite comparable (Table 1 and Fig. S7 A and B). In contrast to the H3–H2B NCP, the relative amplitude for τhexasome is significantly larger than that for the dissociation of the second dimer, τtetrasome. Although it is not possible to deconvolute the relative amplitudes into specific conformational changes for either FRET pair, the inequality of the amplitudes for the hexasome and tetrasome phases are consistent with the two dimers being released asymmetrically.
Acknowledgments
We thank Srinivas Chakravarthy, Weifeng Shang, and Richard Heurich for experimental and technical assistance at BioCAT (Sector 18ID) Advanced Photon Source. SAXS research was supported by National Institutes of Health (NIH) Grants EUREKA R01-GM088645 and R01-GM085062 (to L.P.). FRET research was supported by NIH Grant GM073787 (to L.M.G.). SAXS data were acquired at the BioCAT beamline of the Advanced Photon Source, a US Department of Energy (DOE) Office of Science User Facility operated for the DOE Office of Science by Argonne National Laboratory under Contract No. DE-AC02-06CH11357. BioCAT is supported by Grant 9 P41 GM103622 from the National Institute of General Medical Sciences (NIGMS) of the NIH.
Footnotes
The authors declare no conflict of interest.
This article is a PNAS Direct Submission.
Data deposition: The data reported in this paper have been deposited in the Small Angle Scattering Biological Data Bank (SASBDB), https://www.sasbdb.org/ (accession nos. SASDBS7 and SASDBT7).
This article contains supporting information online at www.pnas.org/lookup/suppl/doi:10.1073/pnas.1611118114/-/DCSupplemental.
References
- 1.Andrews AJ, Luger K. Nucleosome structure(s) and stability: Variations on a theme. Annu Rev Biophys. 2011;40:99–117. doi: 10.1146/annurev-biophys-042910-155329. [DOI] [PubMed] [Google Scholar]
- 2.Luger K, Mäder AW, Richmond RK, Sargent DF, Richmond TJ. Crystal structure of the nucleosome core particle at 2.8 A resolution. Nature. 1997;389(6648):251–260. doi: 10.1038/38444. [DOI] [PubMed] [Google Scholar]
- 3.Bell O, Tiwari VK, Thomä NH, Schübeler D. Determinants and dynamics of genome accessibility. Nat Rev Genet. 2011;12(8):554–564. doi: 10.1038/nrg3017. [DOI] [PubMed] [Google Scholar]
- 4.Luger K. Dynamic nucleosomes. Chromosome Res. 2006;14(1):5–16. doi: 10.1007/s10577-005-1026-1. [DOI] [PubMed] [Google Scholar]
- 5.Tims HS, Gurunathan K, Levitus M, Widom J. Dynamics of nucleosome invasion by DNA binding proteins. J Mol Biol. 2011;411(2):430–448. doi: 10.1016/j.jmb.2011.05.044. [DOI] [PMC free article] [PubMed] [Google Scholar]
- 6.Li G, Widom J. Nucleosomes facilitate their own invasion. Nat Struct Mol Biol. 2004;11(8):763–769. doi: 10.1038/nsmb801. [DOI] [PubMed] [Google Scholar]
- 7.Li G, Levitus M, Bustamante C, Widom J. Rapid spontaneous accessibility of nucleosomal DNA. Nat Struct Mol Biol. 2005;12(1):46–53. doi: 10.1038/nsmb869. [DOI] [PubMed] [Google Scholar]
- 8.Böhm V, et al. Nucleosome accessibility governed by the dimer/tetramer interface. Nucleic Acids Res. 2011;39(8):3093–3102. doi: 10.1093/nar/gkq1279. [DOI] [PMC free article] [PubMed] [Google Scholar]
- 9.Miyagi A, Ando T, Lyubchenko YL. Dynamics of nucleosomes assessed with time-lapse high-speed atomic force microscopy. Biochemistry. 2011;50(37):7901–7908. doi: 10.1021/bi200946z. [DOI] [PubMed] [Google Scholar]
- 10.Arimura Y, Tachiwana H, Oda T, Sato M, Kurumizaka H. Structural analysis of the hexasome, lacking one histone H2A/H2B dimer from the conventional nucleosome. Biochemistry. 2012;51(15):3302–3309. doi: 10.1021/bi300129b. [DOI] [PubMed] [Google Scholar]
- 11.Mazurkiewicz J, Kepert JF, Rippe K. On the mechanism of nucleosome assembly by histone chaperone NAP1. J Biol Chem. 2006;281(24):16462–16472. doi: 10.1074/jbc.M511619200. [DOI] [PubMed] [Google Scholar]
- 12.Zlatanova J, Bishop TC, Victor JM, Jackson V, van Holde K. The nucleosome family: Dynamic and growing. Structure. 2009;17(2):160–171. doi: 10.1016/j.str.2008.12.016. [DOI] [PubMed] [Google Scholar]
- 13.Kireeva ML, et al. Nucleosome remodeling induced by RNA polymerase II: Loss of the H2A/H2B dimer during transcription. Mol Cell. 2002;9(3):541–552. doi: 10.1016/s1097-2765(02)00472-0. [DOI] [PubMed] [Google Scholar]
- 14.Belotserkovskaya R, et al. FACT facilitates transcription-dependent nucleosome alteration. Science. 2003;301(5636):1090–1093. doi: 10.1126/science.1085703. [DOI] [PubMed] [Google Scholar]
- 15.Hoch DA, Stratton JJ, Gloss LM. Protein-protein Förster resonance energy transfer analysis of nucleosome core particles containing H2A and H2A.Z. J Mol Biol. 2007;371(4):971–988. doi: 10.1016/j.jmb.2007.05.075. [DOI] [PMC free article] [PubMed] [Google Scholar]
- 16.Hazan NP, et al. Nucleosome core particle disassembly and assembly kinetics studied using single-molecule fluorescence. Biophys J. 2015;109(8):1676–1685. doi: 10.1016/j.bpj.2015.07.004. [DOI] [PMC free article] [PubMed] [Google Scholar]
- 17.Park YJ, Dyer PN, Tremethick DJ, Luger K. A new fluorescence resonance energy transfer approach demonstrates that the histone variant H2AZ stabilizes the histone octamer within the nucleosome. J Biol Chem. 2004;279(23):24274–24282. doi: 10.1074/jbc.M313152200. [DOI] [PubMed] [Google Scholar]
- 18.Katan AJ, Vlijm R, Lusser A, Dekker C. Dynamics of nucleosomal structures measured by high-speed atomic force microscopy. Small. 2015;11(8):976–984. doi: 10.1002/smll.201401318. [DOI] [PubMed] [Google Scholar]
- 19.Brower-Toland BD, et al. Mechanical disruption of individual nucleosomes reveals a reversible multistage release of DNA. Proc Natl Acad Sci USA. 2002;99(4):1960–1965. doi: 10.1073/pnas.022638399. [DOI] [PMC free article] [PubMed] [Google Scholar]
- 20.Hall MA, et al. High-resolution dynamic mapping of histone-DNA interactions in a nucleosome. Nat Struct Mol Biol. 2009;16(2):124–129. doi: 10.1038/nsmb.1526. [DOI] [PMC free article] [PubMed] [Google Scholar]
- 21.Ngo TTM, Zhang Q, Zhou R, Yodh JG, Ha T. Asymmetric unwrapping of nucleosomes under tension directed by DNA local flexibility. Cell. 2015;160(6):1135–1144. doi: 10.1016/j.cell.2015.02.001. [DOI] [PMC free article] [PubMed] [Google Scholar]
- 22.Chen Y, et al. Revealing transient structures of nucleosomes as DNA unwinds. Nucleic Acids Res. 2014;42(13):8767–8776. doi: 10.1093/nar/gku562. [DOI] [PMC free article] [PubMed] [Google Scholar]
- 23.Oohara I, Wada A. Spectroscopic studies on histone-DNA interactions. I. The interaction of histone (H2A, H2B) dimer with DNA: DNA sequence dependence. J Mol Biol. 1987;196(2):389–397. doi: 10.1016/0022-2836(87)90699-1. [DOI] [PubMed] [Google Scholar]
- 24.Oohara I, Wada A. Spectroscopic studies on histone-DNA interactions. II. Three transitions in nucleosomes resolved by salt-titration. J Mol Biol. 1987;196(2):399–411. doi: 10.1016/0022-2836(87)90700-5. [DOI] [PubMed] [Google Scholar]
- 25.Lowary PT, Widom J. New DNA sequence rules for high affinity binding to histone octamer and sequence-directed nucleosome positioning. J Mol Biol. 1998;276(1):19–42. doi: 10.1006/jmbi.1997.1494. [DOI] [PubMed] [Google Scholar]
- 26.Chua EYD, Vasudevan D, Davey GE, Wu B, Davey CA. The mechanics behind DNA sequence-dependent properties of the nucleosome. Nucleic Acids Res. 2012;40(13):6338–6352. doi: 10.1093/nar/gks261. [DOI] [PMC free article] [PubMed] [Google Scholar]
- 27.Blose JM, et al. Effects of a protecting osmolyte on the ion atmosphere surrounding DNA duplexes. Biochemistry. 2011;50(40):8540–8547. doi: 10.1021/bi200710m. [DOI] [PMC free article] [PubMed] [Google Scholar]
- 28.Bernadó P, Mylonas E, Petoukhov MV, Blackledge M, Svergun DI. Structural characterization of flexible proteins using small-angle X-ray scattering. J Am Chem Soc. 2007;129(17):5656–5664. doi: 10.1021/ja069124n. [DOI] [PubMed] [Google Scholar]
- 29.Tria G, Mertens HDT, Kachala M, Svergun DI. Advanced ensemble modelling of flexible macromolecules using X-ray solution scattering. IUCrJ. 2015;2(Pt 2):207–217. doi: 10.1107/S205225251500202X. [DOI] [PMC free article] [PubMed] [Google Scholar]
- 30.Pelikan M, Hura GL, Hammel M. Structure and flexibility within proteins as identified through small angle X-ray scattering. Gen Physiol Biophys. 2009;28(2):174–189. doi: 10.4149/gpb_2009_02_174. [DOI] [PMC free article] [PubMed] [Google Scholar]
- 31.Bowman GD. Mechanisms of ATP-dependent nucleosome sliding. Curr Opin Struct Biol. 2010;20(1):73–81. doi: 10.1016/j.sbi.2009.12.002. [DOI] [PMC free article] [PubMed] [Google Scholar]
- 32.González PJ, Palacián E. Interaction of RNA polymerase II with structurally altered nucleosomal particles. Transcription is facilitated by loss of one H2A.H2B dimer. J Biol Chem. 1989;264(31):18457–18462. [PubMed] [Google Scholar]
- 33.Yen K, Vinayachandran V, Pugh BF. SWR-C and INO80 chromatin remodelers recognize nucleosome-free regions near +1 nucleosomes. Cell. 2013;154(6):1246–1256. doi: 10.1016/j.cell.2013.08.043. [DOI] [PMC free article] [PubMed] [Google Scholar]
- 34.Banks DD, Gloss LM. Equilibrium folding of the core histones: The H3-H4 tetramer is less stable than the H2A-H2B dimer. Biochemistry. 2003;42(22):6827–6839. doi: 10.1021/bi026957r. [DOI] [PubMed] [Google Scholar]
- 35.Gloss LM, Placek BJ. The effect of salts on the stability of the H2A-H2B histone dimer. Biochemistry. 2002;41(50):14951–14959. doi: 10.1021/bi026282s. [DOI] [PubMed] [Google Scholar]
- 36.Svergun DI. Determination of the regularization parameter in indirect-transform methods using perceptual criteria. J Appl Cryst. 1992;25(4):495–503. [Google Scholar]
- 37.Macke TJ, Case DA. Modeling unusual nucleic acid structures. In: Leontis NB, Santalucia J, editors. Molecular Modeling of Nucleic Acids. American Chemical Society; Washington, DC: 1998. pp. 379–393. [Google Scholar]
- 38.Beechem JM. Global analysis of biochemical and biophysical data. Methods Enzymol. 1992;210(2):37–54. doi: 10.1016/0076-6879(92)10004-w. [DOI] [PubMed] [Google Scholar]


