Significance
The thick ascending limb (TAL) of Henle’s loop is a nephron segment that reabsorbs Na+, Ca2+, and Mg2+ via the paracellular pathway, the tight junction (TJ). TJ permeability is regulated by claudin proteins. We show that the TAL expresses claudins cldn3, cldn10b, cldn16, and cldn19 in a TJ mosaic pattern with cldn3/cldn16/cldn19 in a complex and cldn10b alone. This mutual exclusiveness is facilitated by different claudin interaction properties. TJs with cldn10b favor Na+ over Mg2+, whereas TJs with cldn3/cldn16/cldn19 prefer Mg2+ over Na+. Hence we conclude that mono- and divalent cations in the TAL take different paracellular routes, and their reabsorption can be regulated independently. This spatial separation is important for renal ion homeostasis and its discovery improves our understanding of paracellular transport organization.
Keywords: tight junction, paracellular ion transport, microperfusion, FRET, claudin interaction
Abstract
The thick ascending limb (TAL) of Henle’s loop drives paracellular Na+, Ca2+, and Mg2+ reabsorption via the tight junction (TJ). The TJ is composed of claudins that consist of four transmembrane segments, two extracellular segments (ECS1 and -2), and one intracellular loop. Claudins interact within the same (cis) and opposing (trans) plasma membranes. The claudins Cldn10b, -16, and -19 facilitate cation reabsorption in the TAL, and their absence leads to a severe disturbance of renal ion homeostasis. We combined electrophysiological measurements on microperfused mouse TAL segments with subsequent analysis of claudin expression by immunostaining and confocal microscopy. Claudin interaction properties were examined using heterologous expression in the TJ-free cell line HEK 293, live-cell imaging, and Förster/FRET. To reveal determinants of interaction properties, a set of TAL claudin protein chimeras was created and analyzed. Our main findings are that (i) TAL TJs show a mosaic expression pattern of either cldn10b or cldn3/cldn16/cldn19 in a complex; (ii) TJs dominated by cldn10b prefer Na+ over Mg2+, whereas TJs dominated by cldn16 favor Mg2+ over Na+; (iii) cldn10b does not interact with other TAL claudins, whereas cldn3 and cldn16 can interact with cldn19 to form joint strands; and (iv) further claudin segments in addition to ECS2 are crucial for trans interaction. We suggest the existence of at least two spatially distinct types of paracellular channels in TAL: a cldn10b-based channel for monovalent cations such as Na+ and a spatially distinct site for reabsorption of divalent cations such as Ca2+ and Mg2+.
The kidney regulates the salt and water balance of the body by filtration and subsequent reabsorption or secretion of ions and water. Thereby it controls blood pressure and maintains acid–base homeostasis. The thick ascending limb (TAL) of Henle’s loop drives reabsorption of Na+, Cl−, Ca2+, and Mg2+ from the tubular fluid into the blood. Na+ and Cl− are reabsorbed via the transcellular pathway, involving the renal-specific isoform of the Na+/K+/2Cl− cotransporter (NKCC2) in the apical epithelial cell membrane and Na+/K+-ATPase and chloride channel ClC-Kb in the basolateral membrane. K+ is circulated via NKCC2 and the renal outer medullary K+ channel ROMK1, across the apical cell membrane. These transport processes generate a lumen-positive transepithelial potential that drives additional paracellular reabsorption of Na+ as well as the reabsorption of divalent cations, mainly Ca2+ and Mg2+.
Paracellular transport is regulated by the tight junction (TJ) in a size-, charge-, and water-selective manner. The main functional constituent of the TJ is the family of claudins with 27 members in mammals. Claudins consist of a four-transmembrane helix bundle, two extracellular segments that expand into the paracellular cleft, and intracellular N and C termini. Claudins interact in cis (within the same plasma membrane) and in trans (with claudins in the plasma membrane of neighboring cells). Both cis and trans interactions can occur between the same claudin subtype (homomeric or homotypic interaction, respectively) or between different claudins (heteromeric or heterotypic interaction, respectively). Usually, claudins are capable of homomeric and homotypic interactions; heteromeric and heterotypic interactions are less common and depend on the compatibility of the claudin partners (for a review, see ref. 1).
Claudin assembly results in the formation of polymeric strands surrounding the cell region close to the apical side. Claudins can seal the paracellular cleft or form paracellular channels selective for cations, anions, or water.
In the TAL, expression of claudins cldn3, -10, -11, -14, -16, and -19 was reported in at least two different studies, respectively (2–4). Cldn3 and -11 act as TJ-sealing components when heterologously expressed in epithelial cells lines (5, 6). However, no data on their function in the TAL are available. Cldn10 exists in several splice variants that differ in their ion selectivities (7, 8). We and others have shown that the TAL expresses the isoform cldn10b (7, 9, 10) that forms a paracellular channel for small cations but not for water (8, 11). Mice lacking cldn10 in the TAL display reduced paracellular Na+ selectivity and develop hypermagnesemia, hypocalciuria, and nephrocalcinosis (12), i.e., renal retention of divalent cations.
Cldn16 and cldn19 are of particular importance because gene defects in humans cause the autosomal recessive disorder familial hypomagnesemia with hypercalciuria and nephrocalcinosis (FHHNC), which is characterized by renal wasting of Ca2+ and Mg2+ and ultimately can lead to renal failure (13, 14). Likewise, cldn16 knockout in mice resulted in hypercalciuria and hypomagnesemia with severely diminished Ca2+ and Mg2+ permeabilities in the TAL (15). In a cldn16 knockdown approach mice also developed renal wasting of Ca2+ and Mg2+ which was accompanied by a nonselective decrease in cation permeability (16). Heterologous expression in different epithelial cell lines led to inconsistent effects on permeability to Na+ and Mg2+, depending strongly on the cell line used in the investigation. Similar to cldn16 deficiency, cldn19 deficiency in mice led to hypercalciuria and hypomagnesemia, although cldn19 overexpression in different cell lines decreased permeability to cations (17–19). The interaction between cldn16 and cldn19 was shown to be crucial for correct TJ localization (18).
Cldn14 is virtually absent from the TAL of mice under control conditions but is up-regulated in mice with a high dietary Ca2+ intake (10, 20–22). This increase is accompanied by decreased Ca2+ and Mg2+ permeability in the TAL. Studies suggest that cldn14 affects divalent cation permeability indirectly by interacting with cldn16 (20). In humans, sequence variants of the CLDN14 gene are associated with the incidence of kidney stones (23).
As recently reported, claudin expression differs along the corticomedullary axis of the TAL (10). Whereas TJ expression of cldn16 and cldn19 is confined to the cortex and the outer stripe of outer medulla (OSOM), cldn10b is expressed within TJs along the entire TAL from the cortex to the inner stripe of outer medulla (ISOM). In the present study, we show a mosaic pattern of TJ expression of cldn3, -10b, -16, and -19 in TAL of cortex/OSOM and demonstrate TAL heterogeneity on a cellular level. TAL claudin localization, interaction, and permeability properties are correlated. Hence, we demonstrate the presence of at least two separate paracellular channels with dissimilar ion preferences in the TAL.
Results
Exclusive Expression Pattern of Cldn10b and Cldn3/Cldn16/Cldn19.
TAL of cortex/OSOM were analyzed for the expression of cldn3, -10, -11, -16, and -19 using immunostaining and confocal laser-scanning microscopy of kidney sections or isolated single tubules. Whereas cldn3, cldn10, cldn16, and cldn19 were clearly expressed, cldn11 could not be detected. The anti-cldn10 antibody cannot discriminate between isoforms a and b, but PCR showed that only cldn10b is present in the TAL (10, 12). Thus, a positive cldn10 staining in the TAL is considered to indicate the presence of the isoform cldn10b.
Cldn10b was strongly expressed in the intracellular compartment of the majority of cortex/OSOM TAL cells (Table 1). However, only some of these cells showed TJ localization of cldn10b. Cldn10b was strictly absent from the macula densa. Cldn16 in general localized strongly to the TJ without intracellular signal and was found in a certain percentage of cortex/OSOM TAL TJs. Both cldn3 and cldn19 showed intracellular expression in all cortex/OSOM TAL cells, but TJ localization was restricted to only some of these cells.
Table 1.
The relative number of cells expressing TAL claudins in the intracellular compartment (IC) or in the TJ in deficiency mouse models
| Claudin | Site | Wild type | Cldn10-KO | Cldn16-KO |
| Cldn3 | IC | All | All | All |
| TJ | Some | All | Some | |
| Cldn10b | IC | Nearly all | Nearly all | |
| TJ | Some | Some | ||
| Cldn16 | IC | None | None | |
| TJ | Some | All | ||
| Cldn19 | IC | All | All | All |
| TJ | Some | Nearly all | Some |
IC, intracellular compartment.
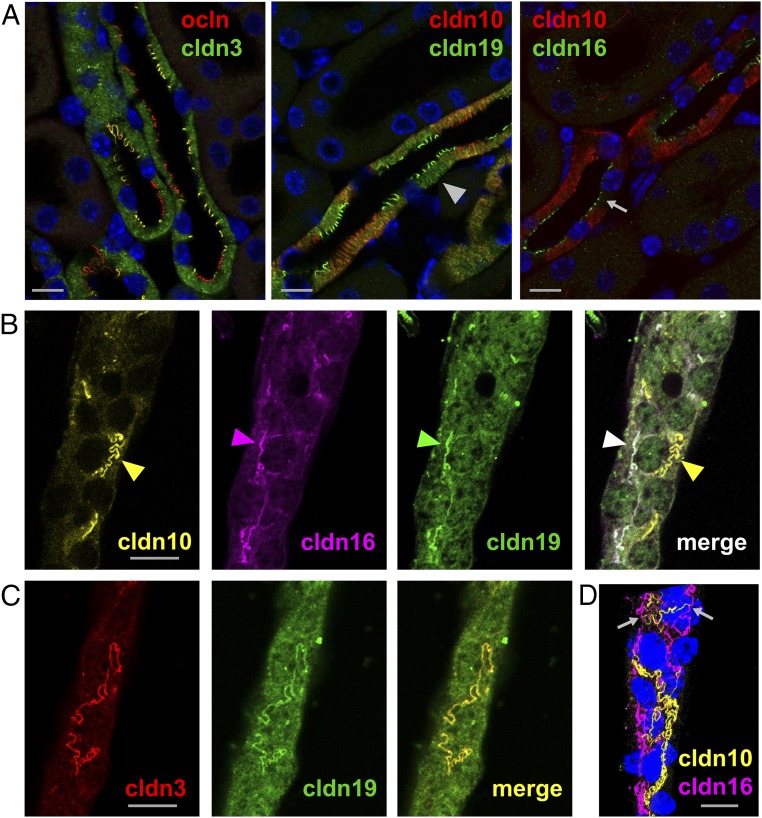
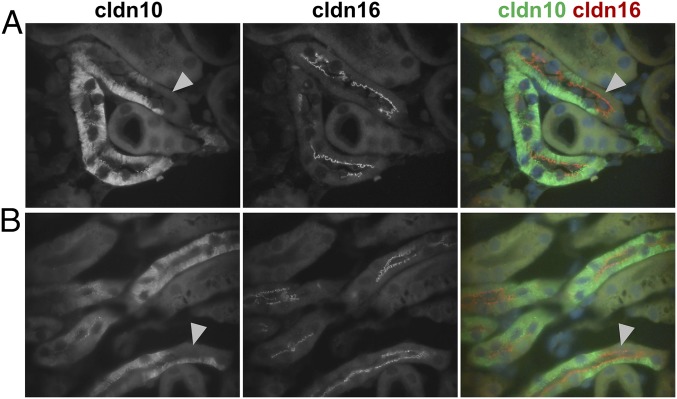
Most interestingly, cldn3, cldn16, and cldn19 were colocalized within TJs (Fig. 1 A–C). Distinct TJ localization of one of the claudins without the others was hardly ever observed. In contrast, cldn10b was strictly absent from TJs composed of the other claudins but was exclusively present in the remaining TJ fraction. TJ localization of either the cldn3/cldn16/cldn19 complex (hereafter, cldn3/16/19) or cldn10b alone was constant throughout the entire junction of two adjacent cells, leaving tricellular junctions as “switchover points” (Fig. 1D). This mosaic expression pattern was observed in cortex/OSOM TAL of both mouse and rat (Fig. S1).
Fig. 1.
Mosaic TJ expression of claudins in single segments of cortex/OSOM TAL. (A) Kidney sections stained for occludin (ocln) and claudins (cldn). Cldn3 and cldn19 are expressed in the intracellular compartment of all cortex/OSOM TAL cells. A certain portion of cells lacks cldn10 expression (arrowhead). Cldn16 is not detected intracellularly but is strictly localized to the TJ (arrow). All claudins are expressed within the TJ in only a certain number of cells. (B) Single isolated TAL tubule. In contrast to sections, intracellular cldn expression is not distinguishable from background. Claudins localize to TJs (arrowheads). Cldn16 (magenta) and cldn19 (green) are colocalized within joint TJs (the congruence of magenta and green is shown as white in the merged image), but cldn10 (yellow) never forms joint strands with any of the other claudins. (C) A single isolated TAL tubule. Cldn3 (red) and cldn19 (green) are colocalized within joint TJs (congruence is shown in yellow). Thus, TJs were equipped with either cldn10b alone or with cldn3/16/19 together. (D) 3D projection of the TAL tubule shown in B. Each cell–cell contact expresses a certain claudin setting with tricellular junctions (arrows) as “switchover points.” DAPI staining is shown in blue. (Scale bars, 10 µm.)
Fig. S1.
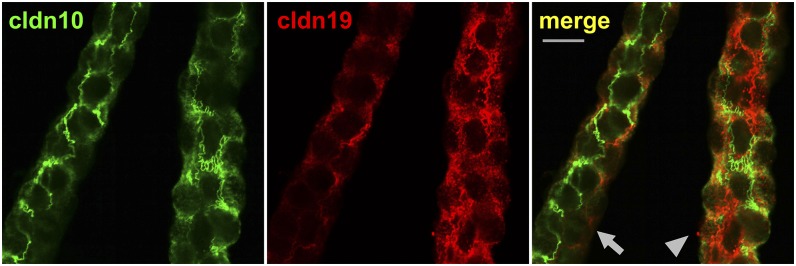
Mosaic TJ expression of claudins in a single rat TAL segment. Shown are parts of an isolated single TAL segment ranging from medulla (arrow) to cortex (arrowhead). In the cortex, cells have extensive lateral interdigitations and express the claudin TJ mosaic of cldn10b and cldn3/16/19. Toward the medulla, cells have less complex interdigitations. (Scale bar, 10 µm.)
TJs Dominated by Cldn10b Prefer Na+; Those with Mainly Cldn3/16/19 Favor Mg2+.
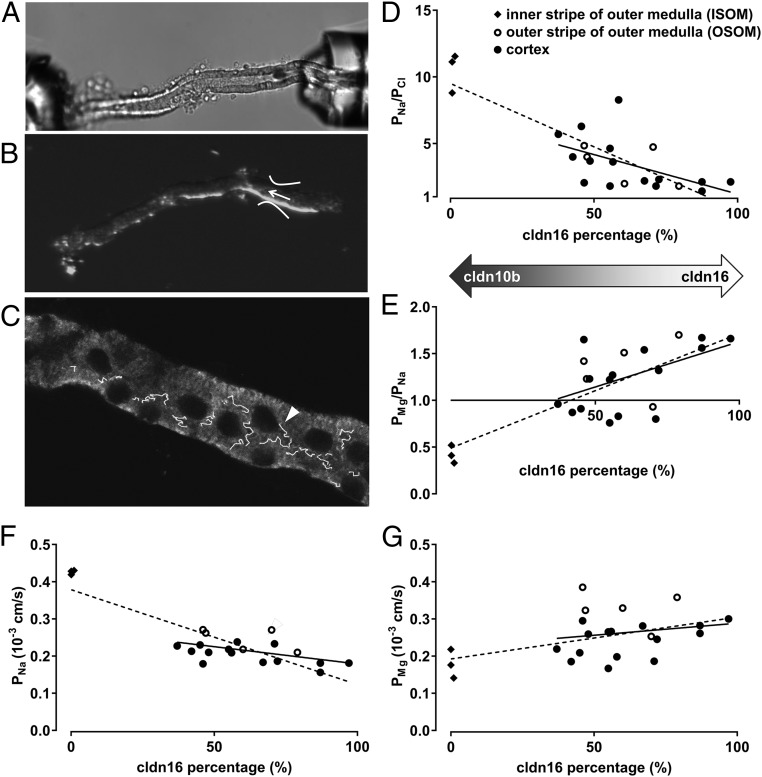
To analyze the impact of claudin expression on paracellular transport properties, electrophysiological measurements on single TAL tubules were combined with subsequent immunostaining of cldn10b and cldn16, which served as a marker for the cldn3/16/19 complex (Fig. 2 A–C). Because cldn10b and cldn16 completely excluded each other within the TJ, the total length of TJs expressing either one or the other claudin was measured and was calculated as a percentage of total TJ length. The cldn16 portion of total TJ length in cortex-derived TAL ranged from 37 to 97% (n = 15) (Fig. 2D). A similar variation in cldn16 fractions was detected in OSOM TAL (n = 5). In contrast, ISOM TAL were dominated by the presence of cldn10b and expressed cldn16 in only a maximum 1% of TJs (n = 3).
Fig. 2.
Claudin expression and paracellular permeabilities. (A) Single TAL tubules were microperfused, and diffusion potentials were measured. (B) Subsequently, tubules were transferred to object slides. The arrow indicates the perfusion site. (C) Tubules were costained for cldn10b and cldn16, and z stacks were taken. The TJ length positive for cldn10b or cldn16 was measured for ∼100 µm from the perfusion site. The arrowhead depicts cell–cell borders retraced with the overlay tool of Zeiss software. The percentages of the tubule length positive for cldn10b and cldn16 relative to the total tubule TJ length were calculated. (D–G) PNa/PCl, PMg/PNa, PNa, and PMg are plotted against the cldn16 percentage in single TAL tubules. ISOM TJs contain cldn10b almost exclusively, without expression of cldn16. OSOM and cortex TJs express varying amounts of cldn10b and cldn16. Solid lines show the linear regression without the ISOM of the TAL; dashed lines depict the linear regression including the ISOM of the TAL. R2 values are provided for regressions including only cortex and OSOM. (D) PNa/PCl as a measure for cation selectivity is highest in cldn10b-expressing TJs and declines as cldn10b decreases. R2 = 0.29. (E) Cldn10b-dominated TAL prefer Na+ over Mg2+ (PNa > PMg > PCl); cldn16-dominated TAL favor Mg2+ over Na+ (PMg > PNa > PCl). R2 = 0.25. (F) PNa decreases with cldn10b reduction. R2 = 0.25. (G) PMg is not correlated with cldn10b or cldn16 expression. R2 = 0.03.
The permeability ratio for Na+ over Cl− (PNa/PCl) served as a measure for charge selectivity and was plotted against the cldn16 percentage in ISOM, OSOM, and cortex TAL. As depicted in Fig. 2D, cation selectivity was highest in ISOM TAL (PNa/PCl ≈ 10), expressing mainly cldn10b, and dropped with increasing cldn16 percentage in cortex/OSOM TAL. Concomitantly, the permeability ratio for Mg2+ over Na+ (PMg/PNa) increased from ≈ 0.5 in the ISOM to values above 1.5 with growing cldn16 percentage in cortex/OSOM, indicating an increasing preference of the TJ for divalent cations over monovalent cations (Fig. 2E). Determination of single-ion permeabilities revealed that this effect was based on a marked decrease in Na+ permeability (Fig. 2F), whereas Mg2+ permeability remained unaltered (Fig. 2G) in tubules expressing more cldn3/16/19 than cldn10b. Thus, the TJ ion preference differed depending on the ratio of cldn10b and the other claudins: TJs dominated by cldn10b preferred Na+ over Mg2+ (PNa > PMg > PCl), whereas TJs expressing more cldn3/16/19 preferred Mg2+ over Na+ (PMg > PNa > PCl).
The Mosaic Pattern of Expression Is Abrogated in Cldn10-KO but Not in Cldn16-KO Mice.
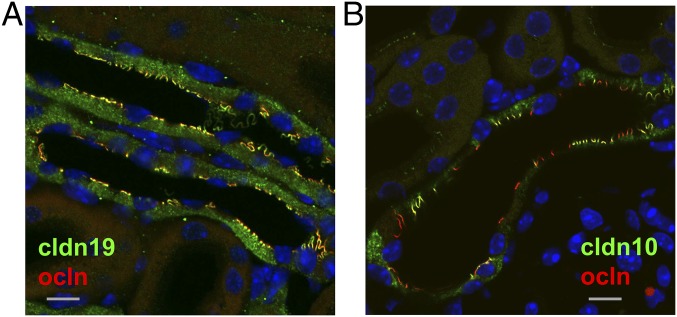
The expression and distribution of TAL claudins were analyzed in mice deficient for Cldn10 or Cldn16. Table 1 summarizes the results of cortical TAL. Deletion of the Cldn10 gene in the TAL and more distal nephron segments resulted in the complete absence of cldn10 from TAL epithelial cells and in a redistribution of other claudins: In wild-type mice cldn3, cldn16, and cldn19 were present in only a certain fraction of TJs in the cortex/OSOM. Most remarkably, the absence of cldn10b led to a broad expansion of the other claudins over TJs in the TAL (Fig. 3). In contrast, the loss of cldn16 in mice did not result in an altered distribution of other TAL claudins. Instead, the mosaic pattern with exclusive expression of either cldn10b or cldn3/cldn19 persisted.
Fig. 3.
Claudin mosaic expression in cldn10-deficient or cldn16-deficient TAL. (A) Cldn10 deficiency in the TAL of mice results in a complete abrogation of the TJ mosaic pattern with broad expansion of cldn3/16/19 over all TAL TJs, shown here for cldn19 (congruence with the TJ marker occludin). (B) Cldn16 deficiency does not lead to an altered distribution of cldn10 (there is no expansion into all occludin-stained TJs), probably because the TJs are still occupied by cldn3/cldn19. (Scale bars, 10 µm.)
The Mosaic Pattern of Expression Is Not Affected by High Dietary Ca2+.
To investigate whether the mosaic pattern of cldn10b and cldn3/16/19 expression persisted during altered requirements in renal Ca2+ reabsorption, TAL of mice fed a high-Ca2+ diet were analyzed. Immunostaining and microscopy revealed no alteration in the typical mosaic pattern with high dietary Ca2+ compared with control conditions (Fig. 4). As a quantitative readout, the number of TAL cells expressing cldn10 in the intracellular compartment was determined and compared. Under control conditions, 77% of TAL cells contained cldn10. This percentage was unaltered with a high-Ca2+ diet (78%; n = 60 tubules from three different animals in each condition).
Fig. 4.
Mosaic expression of cldn10 and cldn16 in kidney sections from animals subjected to different dietary Ca2+ conditions. The expression and localization of cldn10 or cldn16 are not altered at high dietary Ca2+ (B) compared with control conditions (A). The number of cells without intracellular expression of cldn10 (arrowheads) is unaltered in the two groups.
Cldn10b Is Unable to Interact with Cldn3, Cldn16, or Cldn19.
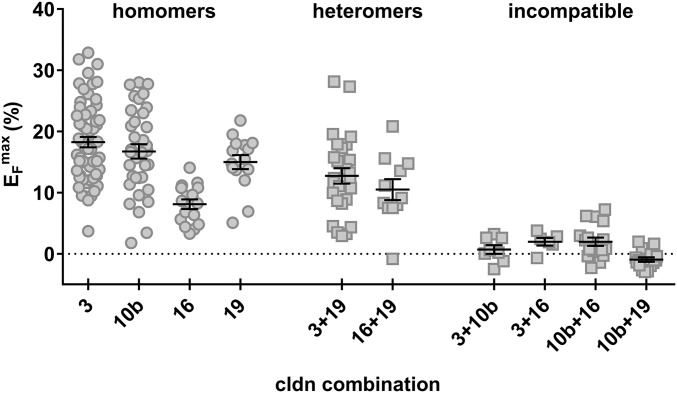
To shed light on the molecular basis for the mutual exclusiveness of cldn10b vs. the other claudins, studies of claudin cis and trans interactions were carried out after overexpression in a primordially TJ-free cell system. FRET analyses revealed that all TAL claudins (cldn3, -10b, -16, and -19) were able to interact in cis with themselves and to form homomers (Fig. 5). Maximum FRET efficiencies (EFmax) were relatively high for cldn3, -10b, and -19 but were rather low for cldn16. In contrast, heteromers could be formed only by certain combinations. Of the six possible heteromeric combinations, only cldn3/cldn19 and cldn16/cldn19 showed a capability for cis interaction. In general, except for the cldn16 homomer, the EFmax was somewhat lower for heteromeric interactions than for homomeric interactions.
Fig. 5.
The capability for cis interaction of TAL claudins determined by FRET analysis within TJs. CFP– or YFP–claudin fusion proteins were expressed in TJ-free HEK 293 cells. FRET occurs when tagged claudins are in close proximity (within a maximum range of 8 nm) and indicates cis interaction. All TAL claudins can interact with themselves and form homomers. Because cldn16 lacks trans interaction capability, its EFmax is lower than that of other homomers. Heteromer formation occurs in only two combinations; other combinations are incompatible with heteromer formation.
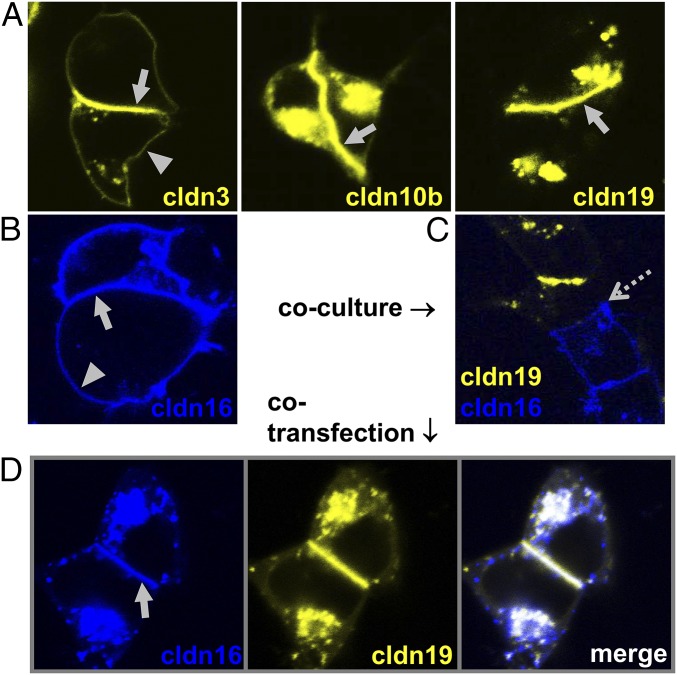
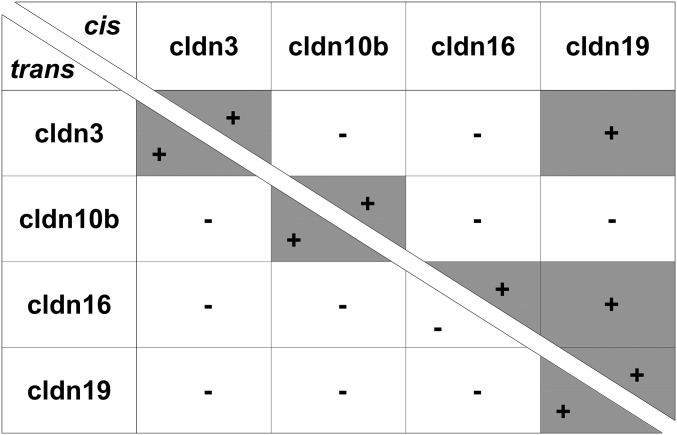
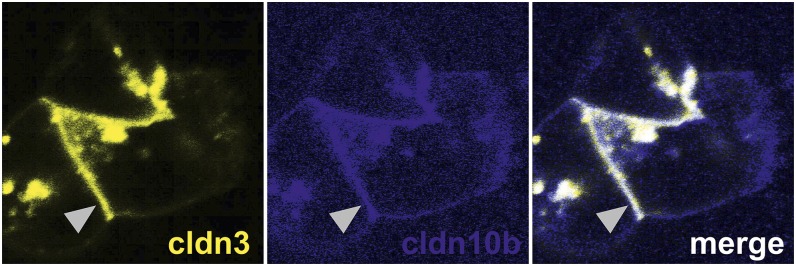
The ability of claudins to engage in trans interactions was determined by analyzing contact enrichment in overexpressing HEK 293 cells. Cldn3, -10b, and -19 showed clear contact enrichment at cell–cell borders after transfection; this enrichment indicated the capacity for homotypic trans interactions (Fig. 6A). Notably, cldn16 displayed no trans interaction when expressed alone (Fig. 6B). However, when cldn16 and cldn19 were coexpressed within the same cells, both cldn16 and cldn19 were enriched at cell–cell contacts (Fig. 6D). Analysis of heterotypic trans interactions revealed the incompatibility of all combinations between TAL claudins (Fig. 6C). Fig. 7 summarizes all cis and trans interactions of cldn3, -10b, -16, and -19. Strikingly, cldn10b was the only claudin lacking the ability to interact with a claudin other than itself.
Fig. 6.
The capability for trans interaction of TAL claudins. CFP– or YFP–claudin fusion proteins were expressed in TJ-free HEK 293 cells (and were cocultured when two different claudins were tested). Enrichment of fluorescence intensity at cell–cell contacts (arrows) compared with cell membranes without contact to a transfected cell (arrowheads) indicates trans interaction and strand formation. (A and B) Cldn3, -10b, and -19 are capable of trans interactions (A), but cldn16 is not (B). (C) No heterotypic interaction is seen between TAL claudins, as shown for cldn16/cldn19 (contact indicated by dotted arrow). (D) When cldn16 and cldn19 are coexpressed within the same cells, both claudins are integrated into strands.
Fig. 7.
Summary of claudin cis (Upper Right) and trans (Lower Left) interactions. Cldn19 can form heteromers with both cldn3 and cldn16 and facilitate insertion into joint cldn3/16/19 complexes. Cldn10b is the only TAL claudin not capable of any interaction other than with itself and thus must form its own strands.
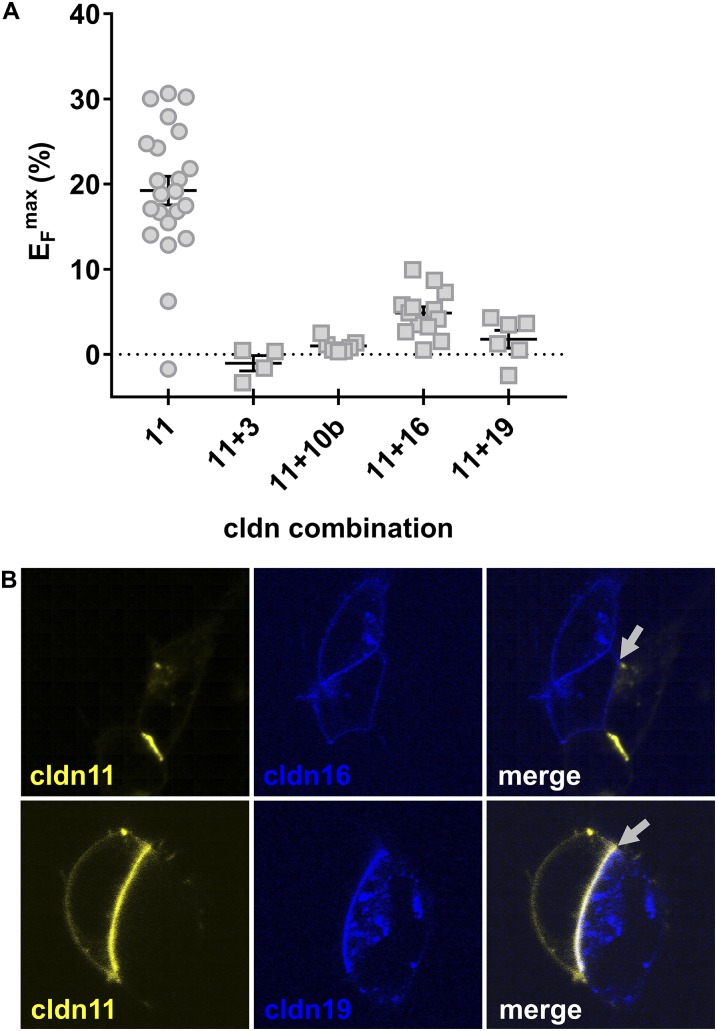
We did not detect cldn11 by immunofluorescence in native TAL. However, cldn11 was capable of homomeric and homotypic interactions and showed a slight capability for cis interaction with cldn16. Interestingly, cldn11 also was capable of trans interaction with cldn19 (Fig. S2).
Fig. S2.
Interactions of cldn11. (A) Cldn11 is capable of homomer formation and shows slight cis interaction with cldn16. (B) Exemplary trans interactions. Cldn11 cannot interact in trans with cldn16 but can interact in trans with cldn19. Arrowheads depict cell–cell contacts with (Lower) or without (Upper) contact enrichment, respectively.
Determinants of Claudin trans Interaction.
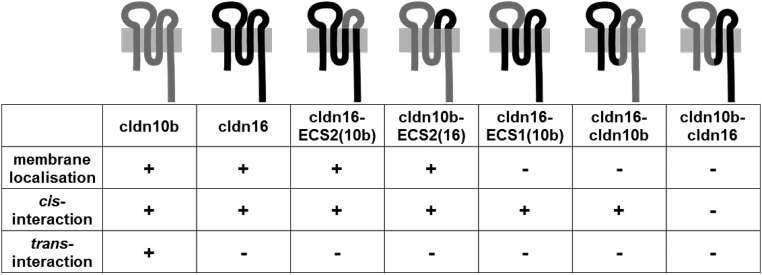
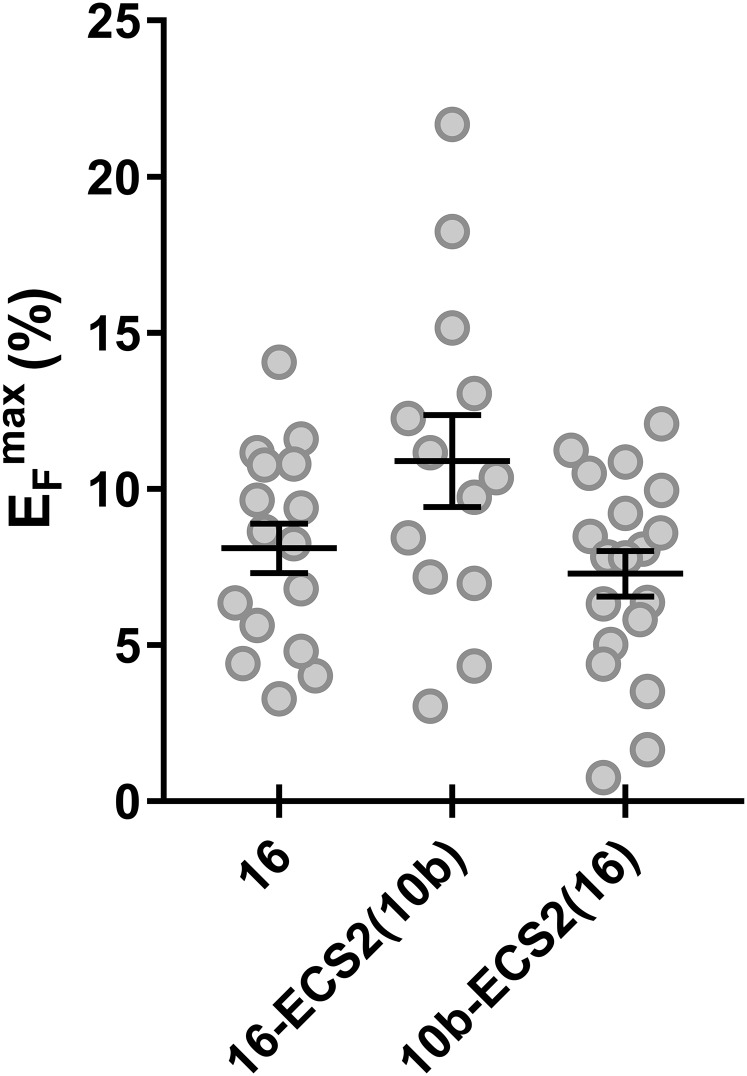
To identify the determinants of different claudin-interaction properties, a set of cldn10b and cldn16 chimeras was generated, and their homophilic interaction properties were analyzed. Chimeras differed in their ability to localize to the cell membrane when expressed in HEK 293 cells (Fig. 8). Nevertheless, most chimeras could form homomers within the membrane or in the intracellular compartment as detected by FRET analyses. As stated above, cldn10b was capable of homotypic trans interactions, but cldn16 was not. Replacing cldn16 extracellular segment 2 (ECS2) with cldn10b ECS2 did not restore a homotypic trans interaction. The inverse replacement of cldn10b ECS2 with cldn16 ECS2 perturbed the trans interaction of cldn10b. Both chimeras, cldn16-ECS2(10b) and cldn10b-ECS2(16) could localize to the cell membrane and showed EFmax values similar to those of wild-type cldn16 (Fig. S3). Correct membrane localization and intramembranous homomeric cis interaction were considered indications of intact protein folding. Chimeras with insufficient membrane localization were not involved in further evaluation.
Fig. 8.
Summary of homophilic interaction properties of cldn10b/cldn16 chimeras compared with wild types. Cldn16’s lack of trans interaction cannot be overcome by replacing cldn16 ECS2 with cldn10b ECS2. The inverse exchange destroys cldn10b’s trans-interaction capability, indicating that ECS2 has a role in trans interactions. Chimeras without membrane localization in HEK 293 cells were excluded from data interpretation.
Fig. S3.
Homomer formation of cldn10b/cldn16 chimeras. The EFmax of chimeras are similar to that of wild-type cldn16. Homomeric cis-interaction capability and membrane localization are considered indicators of correct protein folding.
Discussion
Like all epithelia, TAL cells express a certain set of claudins, and it has been assumed that all the claudins present establish joint TJ strands to facilitate paracellular Na+, Ca2+, and Mg2+ permeability. In contrast to that paradigm, we reveal a mosaic pattern of claudin expression in cortex/OSOM TAL. The mutual exclusiveness of cldn10b and cldn3/16/19 results in a spatial separation of paracellular Na+ transport and reabsorption of divalent cations. Because PNa exceeds PMg in cldn10b-dominated TJs, and PMg exceeds PNa when cldn10b TJ expression declines, the main Mg2+ pathway is spatially separated from sites expressing cldn10b.
The finding that cldn10b-based TJs are highly permeable to Na+ and, to a lesser extent, are permeable to Mg2+ is in good agreement with previous reports that cldn10b forms a paracellular channel for small cations with a preference for monovalent over divalent cations (7, 8, 11). Furthermore, it fits well with the observation that the absence of cldn10b from the TAL led to decreased paracellular Na+ permeability in mice (12).
In accordance with previous studies, we found that cldn16 and cldn19 colocalized in mouse and rat TAL TJs (19). The colocalization of cldn3 with cldn16/cldn19 raises the question of its function within this complex. When overexpressed in MDCK II cells, cldn3 acted as a sealing TJ component, decreasing permeability to ions and larger solutes (5). However, MDCK II cells contained neither cldn16 nor cldn19; thus conclusions about the role of cldn3 in this TAL-specific complex are problematic. The significance of cldn3 in TAL function is still uncertain, and data on the renal effects of cldn3 deficiency are needed to solve that question.
In contrast, the importance of both cldn16 and cldn19 for intact Ca2+ and Mg2+ reabsorption was demonstrated in several studies using deficiency mouse models (15, 16, 18) and is emphasized by the finding that patients with defects in CLDN16 or CLDN19 suffer from FHHNC (13, 14). However, whether cldn16 and cldn19 themselves are constituents of the paracellular channel for divalent cations is still controversial. Heterologous expression of cldn16 in different cell-culture models (low- or high-resistant MDCK subclones, LLC-PK1) led to conflicting results (24–28). In most models, cldn16 increased PMg slightly, whereas PNa was unaltered or reduced. In LLC-PK1 cells, a cell line with anion-selective TJs brought about by its high expression of cldn17 (29), cldn16 dramatically increased PNa and only moderately increased PMg (26). However, the potential effects on cldn17 have not yet been studied in this cell line. Coexpression of cldn16 and cldn19 in LLC-PK1 cells also strongly augmented PNa but suppressed PMg (17). This observation led to the notion that cldn16 could exert its impact on Ca2+ and Mg2+ reabsorption indirectly by acting as an Na+ channel and influencing the transepithelial voltage as a driving force for cation reabsorption (17). The exact reasons for the discrepancies in overexpression studies are unclear. However, it is reasonable that the cell type-specific claudin composition interferes with the effect of the exogenous claudin and influences the overall permeability properties of the TJ. Thus, because no cell-culture model with exact TAL claudin equipment is available, the validity of heterologous expression studies is limited.
Cldn16 deficiency in mice resulted in a small but significant reduction of paracellular Mg2+ permeability in the TAL (15, 16). In the present study, we directly correlated claudin expression and ion permeability in TAL segments of untreated wild-type mice, allowing the analysis of claudin function in a natural background. PMg tended to increase with elevating presence of cldn3/16/19 in the TJ, although no correlation was found when the ISOM TAL were excluded from regression analysis (Fig. 2G). Thus, it remains uncertain whether the cldn3/16/19 complex forms a Mg2+-selective channel, and future studies may uncover a more complex answer to this question (e.g., by the discovery of further potential paracellular pathways for divalent cations). The notion that cldn16 could act mainly as a paracellular Na+ channel in the TAL is contradicted by the decrease in Na+ permeability with elevated cldn16 presence in the TJ. The observation that most cortex/OSOM TAL possess TJs equipped with 50% or more cldn3/16/19 is in accordance with the previous finding that Ca2+ and Mg2+ reabsorption take place mainly in the cortical part of the TAL (30–33). For technical reasons, only Mg2+ permeability was determined in this study. However, Ca2+ and Mg2+ are assumed to take, at least in part, the same paracellular route coupled to cldn16 (24).
Our findings raise the question of the physiological importance of the spatial separation of paracellular transport in general and in particular in the TAL. Numerous previous studies have addressed the functional and morphological heterogeneity of the TAL along the corticomedullary axis. The TJ mosaic expression demonstrates that in cortex/OSOM TAL the heterogeneity also extends to the cellular level. In ISOM TAL TJs the exclusive expression of cldn10b provides high paracellular Na+ permeability, resulting in paracellular Na+ reabsorption in addition to transcellular uptake. Reabsorption of NaCl without water in the ISOM leads to a hypoosmotic luminal fluid in the cortical TAL, resulting in Na+ diffusion from the interstitium into the lumen along its concentration gradient via the paracellular cldn10b channel. In contrast to ISOM TAL, the physiological role of cldn10b towards the cortex is the maintenance of the lumen-positive potential as a driving force for reabsorption of Mg2+ and, to a lesser extent, Ca2+.
Our deduction is that efficient Na+ flux from interstitium to lumen and Mg2+/Ca2+ flux in the opposite direction require different permeation sites. Moreover, the mosaic pattern ensures the formation of homomeric cldn10b channels and thus helps maintain the strong paracellular selectivity of these channels. Importantly, the spatial separation of Na+ and Mg2+/Ca2+ routes allows the independent regulation of both pathways. As shown in Fig. 1, the distance between cldn10b TJs and other TJs is only a few micrometers, and therefore local concentration gradients within the cortical TAL are not to be expected. In general, it is not surprising that, in analogy to transcellular channels, paracellular channels are constituted by specific types of subunits (claudins). Although the precise structure of paracellular channels has yet to be resolved, it is likely that not all subunits intermix to form homogenous channels but instead channels with different selectivities arrange in parallel to provide a paracellular pathway with defined properties.
The TJ mosaic pattern was completely abrogated in Cldn10-KO mice. It seems reasonable that the loss of cldn10b from TJs in the TAL allows the TJs to be occupied by the other claudins present. The observed insertion of cldn3/16/19 in nearly all TJs in the cortex/OSOM could contribute to the hyperabsorption of Ca2+ and Mg2+ observed in these animals (12). Conversely, the absence of cldn16 alone from TJs in the TAL did not result in the redistribution of cldn10b. Presumably, cldn3/19 still occupied the “non-cldn10b” cortex/OSOM TJs in Cldn16-KO mice and prevented the integration of cldn10b. Our finding of correct cldn19 localization in Cldn16-KO mice is at variance with the previous observation that Cldn16 knockdown led to a complete withdrawal of cldn19 from TAL TJs in mice (18) but is in full agreement with the finding that cldn19 is capable of autonomous strand formation without cldn16 in HEK 293 cells.
When mice were put on a high-Ca2+ diet to challenge the TAL with altered requirements for Ca2+ reabsorption, the TJ mosaic was sustained without changes in cldn10b, cldn16, or cldn19 localization. Rather, the TAL reacted to the Ca2+ load by increased expression and TJ localization of cldn14 that was virtually absent under control conditions (10, 20–22). Cldn14 was able to interact with cldn16 in a yeast two-hybrid (Y2H) assay, and it is assumed that this interaction alters the cldn16/cldn19-based cation permeability (20).
The observed TJ mosaic pattern with mutually exclusive cldn10b and cldn3/16/19 is highly consistent, even with altered demands for TAL ion reabsorption. Claudin-interaction studies provided insight into the mechanisms underlying the stringent exclusiveness of certain TAL claudins. Because cldn10b is not capable of any cis or trans interaction with other TAL claudins, it must form strands on its own. Moreover, the ability of cldn3, cldn16, and cldn19 to interact is in accordance with their insertion in joint TJ strands. Although both cldn3 and cldn19 could assemble into independent strands, they also could form cldn3/cldn19 heteromers as a base for mixed strands. In contrast, cldn16 lacked the homotypic trans interaction that is a prerequisite for autonomous strand formation. Accordingly, the determined EFmax of the cldn16 homomer measured at cell–cell contacts was markedly lower than that of cldn3, cldn10b, or cldn19 homomers. The EFmax depends on the mean distance of FRET partners; claudins within the membrane but not tightly packed in a TJ strand show lower EFmax values than claudins forming strands. However, cldn16 is a functionally important constituent of cortex/OSOM TJ strands. Its integration in TAL TJs presumably is facilitated by the heteromeric interaction with cldn19 that also interacts with cldn3 and thus allows the formation of the cldn3/16/19 TJ complex. The finding that cldn16 and cldn19 can interact in cis but not in trans is in accordance with previous findings based on Y2H assays showing the same outcome (17, 34). These studies demonstrated that cldn16 and cldn19 can form a stable dimer through the cis association of transmembrane segments 3 and 4 (34). The dependence of cldn16 TJ localization on coexpression and interaction with cldn19 is in good agreement with the finding that CLDN19 defects in humans and mice develop a phenotype similar to that of CLDN16 mutations (13–16, 18).
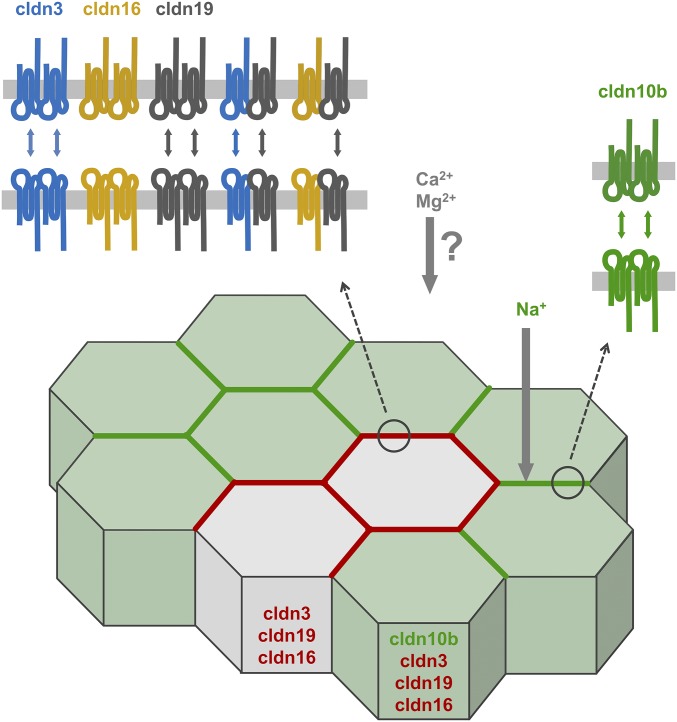
It is likely that the different interaction properties of TAL claudins are decisive for the mutual exclusiveness of cldn10b and cldn3/16/19. A question that arises is how TAL cells regulate their TJ equipment. Because the entire TJ of each cell–cell border is composed of either cldn10b or cldn3/16/19, it is tempting to speculate that the different TJ equipment is correlated to different cell types. In fact, two groups of TAL epithelial cells were distinguishable by their claudin expression: ca. 77% of cortex/OSOM cells contained cldn3, cldn10b, and cldn19 in the intracellular compartment, and ca. 23% showed intracellular expression of cldn3 and cldn19 but not cldn10b. Because, in general, cldn16 was strictly confined to the TJ and lacked an intracellular presence, no information is available as to whether all TAL cells can express cldn16. Naturally, cldn10b-based TJs occurred only at the borders of adjoining cldn10b-expressing cells. Borders between cells without cldn10b or with only one cldn10b-positive neighboring cell always established cldn3/16/19-based TJs (Fig. 9). Consequentially, a great portion of TAL cells have the fundamental claudin setting to establish both TJ composition variants. It appears that the presence of cldn10b in two neighboring cells triggers the formation of cldn10b TJs despite the presence of other claudins. A different outcome was observed when cldn10b and cldn3 (or cldn16 or cldn19) were coexpressed in HEK 293 cells. As stated before, cldn10b did not interact with the other claudins, but the formation of cldn10b strands did not prevent the establishment of cldn3 (or cldn19) strands at the same cell–cell contact (Fig. S4). This observation indicates that the mosaic TJ pattern is determined by factors other than claudin interactions alone. Obviously, these determinants are present in TAL cells but not in HEK 293 cells. How TAL cells regulate the TJ assembly remains to be elucidated in further studies.
Fig. 9.
Scheme of claudin expression pattern and interaction capabilities in cortex/OSOM TAL. All cells express cldn3, cldn19, and potentially cldn16, but only 77% also express cldn10b. Those cells have the fundamental claudin setting to establish both TJ composition variants but form cldn10b TJs. Cldn16 can be integrated into the TJ only when cldn19 is present. Cldn19 forms heteromers with cldn3 and cldn16 and allows the formation of joint strands. Cldn10b forms channels with a preference for monovalent cations and thus mainly conducts Na+. TJs dominated by the cldn3/16/19 complex prefer Mg2+ over Na+. The molecular identity of the channel for divalent cations remains elusive.
Fig. S4.
TJ colocalization of cldn3 and cldn10b in HEK 293 cells. Although cdln3 and cldn10b cannot interact in cis or in trans, they colocalize within the cell membrane (arrowheads) and show no mutual exclusiveness as seen in TAL epithelium. The same is true for cldn16/cldn10b and cldn19/cldn10b.
One important result of the present study is that we found further evidence for the cellular heterogeneity of the TAL. It has been previously shown that ammonium transport and the expression of ROMK1, an NKCC2 splice variant, and cldn19 are heterogeneous in the TAL (19, 35–37). The first description of different TAL cell types was in 1967 by Allen and Tisher (38), who discovered two cell types in rat TAL by means of scanning electron microscopy: R (rough) cells with prominent microvilli and extensive lateral interdigitations and S (smooth) cells generally devoid of extensive microvilli and with less complex lateral interdigitations. In ISOM TAL, S cells were predominant. The number of R cells increased toward the cortex, but discrimination between cell types became more difficult. We observed the previously detected differences in lateral interdigitations between ISOM TAL cells with exclusive cldn10b expression within the TJ and cortex/OSOM TAL with mosaic TJs (Fig. S1). However, a correlation between R or S cell type and claudin expression was beyond the scope of this study.
The inability of cldn16 to engage in homotypic trans interaction and autonomous strand formation appears extraordinary among claudins. Whether this property is important for the cldn16 selectivity filter is unknown as yet. However, the ECS2 of claudins has been described as an important determinant of trans-interaction capability (39, 40). The use of claudin chimeras to identify the function of particular claudin segments involves a certain risk of misfolding. We therefore used membrane localization and intact cis interaction of chimeras as quality criteria. These criteria were met by the ECS2 chimera but not by the extracellular segment 1 (ECS1) chimera. The finding that replacing cldn10 ECS2 with cldn16 ECS2 perturbed the trans interaction of cldn10b suggests that ECS2 is crucial for claudin trans interaction. However, the finding that replacing cldn16 ECS2 with cldn10 ECS2 did not restore homotypic trans interaction suggests that ECS2 alone is not sufficient. Thus, it is likely that ECS1 is also involved in trans interactions. Because the ECS1-exchange chimera failed to insert in the cell membrane, probably because of incorrect folding, it could not be used to address that question. Further effort is required to clarify the role of ECS1 in trans interactions and strand formation.
In conclusion, we reveal a mosaic pattern of claudin expression in the TAL TJ in which cldn10b and cldn3/16/19 are mutually exclusive. This pattern remains highly consistent during the loss of cldn16 and during altered needs for renal Ca2+ reabsorption. The claudins involved differ fundamentally in their interaction properties, and these differences might contribute to the maintenance of the mosaic pattern. On that basis, we suggest the existence of two spatially distinct types of paracellular permeation pathways in the TAL: (i) a cldn10b-based channel for monovalent cations such as Na+, and (ii) a spatially separated pathway for the reabsorption of divalent cations such as Ca2+ and Mg2+. The separation of both pathways would help maintain the different paracellular channel selectivities mandatory for intact ion homeostasis and would allow independent regulation of Na+ and Ca2+/Mg2+ routes.
Materials and Methods
Animal Handling and Kidney Tubule Isolation.
All experiments were performed in accordance with the German law on animal protection and approved by the Ministerium für Energiewende, Landwirtschaft, Umwelt und ländliche Räume des Landes Schleswig-Holstein and by the animal welfare officer of Christian-Albrechts-University Kiel (animal ethics protocol number V312-72241.121-2). The following animal models were used: wild-type mice (C57B6/J) and rats (Sprague–Dawley), mice with homozygous Cldn10 knockout in the TAL and more distal nephrons [Cldn10-KO (12)], and mice with homozygous Cldn16 knockout [Cldn16-KO (15)]. Diets containing different Ca2+ concentrations were applied as described recently (10). In brief, mice received diets containing 0.9% or 5% (wt/wt) Ca2+ (control and high-Ca, respectively) for 1 wk. Mice or rats were killed under inhalational anesthesia [3–5% (vol/vol) isoflurane]. For kidney tubule microdissection, kidneys were extracted, decapsulated, and sliced. For immunofluorescence staining, single tubules were obtained by shaking kidney slices in 1 mg/mL collagenase type II at 37 °C for 15–25 min. Single TAL segments were collected at 4 °C using a stereo Leica M165 C microscope (Leica Microsystems). Subsequently, tubule staining was performed as described below. For electrophysiological measurements and subsequent immunofluorescence microscopy, TAL tubules were dissected manually.
Electrophysiological Measurements.
TAL tubules were dissected manually from cortex, OSOM, or ISOM and were microperfused as described previously (10, 41). Briefly, TAL tubules were bathed in and perfused with physiological control solution at 37 °C. Digitized images allowed the measurement of tubule diameter and length. The transepithelial voltage was recorded, and transepithelial resistance was estimated using the cable equation. The equivalent short-circuit current was calculated according to Ohm’s law. Perfusion potentials were obtained by replacing the tubular bath solution first with low-Na+, and then with high-Mg2+ solution. PNa/PCl and PMg/PNa permeability ratios were calculated according to the Goldman–Hodgkin–Katz equation. Absolute ion permeabilities were obtained using the Kimizuka–Koketsu equation that involves the transepithelial resistance (Rte). Because Rte calculation is afflicted with a relatively large error based on the tubule’s diameter, all Rte values of a certain group (cortex, OSOM, or ISOM) were averaged and used for the calculation of single-ion permeabilities. After measurements, tubules were transferred to an object slide and stained for immunofluorescence microscopy as described below.
Immunofluorescence Microscopy.
For single-tubule staining, isolated tubules were collected on microscope slides and fixed with 4% (wt/vol) paraformaldehyde followed by washing with 25 mM glycine and PBS. After permeabilization with 0.5% Triton-X and blocking with 5% (wt/vol) BSA, tubules were exposed to primary antibodies (1:300) overnight at 4 °C. After washing, tubules were incubated with secondary antibodies (1:300) for 1 h at 4 °C. Finally, samples were mounted using Mowiol-DABCO solution (Carl ROTH) containing DAPI for staining of nuclei. To measure the length of TJs expressing cldn10b or cldn16, tubules were costained with both antibodies. Overlapping z stacks were taken, and the lengths of TJs positive for cldn10 or cldn16 were measured using Zeiss LSM Image Browser software. Measurements covered the complete tubule up to ca. 100 µm from the perfusion site and all TJ-containing stacks.
Cryosections were carried out on perfusion-fixed kidneys. Fixation was prolonged with methanol/acetone at −20 °C. Samples were boiled in 10 mM citrate for antigen retrieval. Permeabilization, blocking, antibody exposure, and mounting were performed as described above.
Primary antibodies were purchased from St John’s Laboratory (rabbit anti-cldn3) and Life Technologies (mouse anti-ocln, rabbit anti-cldn3, mouse anti-cldn10, and rabbit anti-cldn11) or were generated in the J.H. laboratory, Washington University, St. Louis (rabbit anti-cldn16, rabbit anti-cldn19). Triple staining (e.g., cldn10/cldn16/cldn19) was carried out using the Zenon antibody labeling kit (Thermo Fisher Scientific) according to the manufacturer’s instructions. Secondary antibodies labeled with Alexa Fluor 488, - 594, or - 633 were purchased from Life Technologies. Confocal images were recorded using a Zeiss LSM 510 Meta or a Zeiss LSM 780 laser-scanning microscope.
Claudin Constructs, Cell Culture, and Transfection.
The cDNAs of human CLDN3 (GenBank accession no. BC016056.1), CLDN10b (GenBank accession no. NM_006984.4), CLDN11 (GenBank accession no. NM_005602.5), CLDN16 (GenBank accession no. NM_006580.3, variant with a short N terminus, nucleotides 459–1,166), and CLDN19 (GenBank accession no. NM_001123395.1) were cloned into expression vectors based on pcDNA3-NECFP/-NEYFP (kindly provided by Otmar Huber, Friedrich Schiller University Jena, Jena, Germany) to produce fusion proteins with the fluorescent protein (ECFP or EYFP) localized at the claudin N terminus. A linker sequence (SLVPSSDP) between the fluorescent tag and the N terminus allowed correct membrane localization, as described recently (42). DNA sequences of chimeras combining segments of different claudins were generated by two-step PCR and cloned into vectors as described above. Detailed information on amino acid sequences of chimeras is provided in Table S1.
Table S1.
Amino acid sequences of chimeras
| Chimera | Replaced amino acids |
| Cldn16-ECS2(10b) | Cldn16 (137–163) by cldn10b (137–159) |
| Cldn10b-ECS2(16) | Cldn10b (137–159) by cldn16 (137–163) |
| Cldn16-ECS1(10b) | Cldn16 (27–79) by cldn10b (28–80) |
| Cldn16-cldn10b | Cldn16 (111–235) by cldn10b (109–228) |
| Cldn10b-cldn16 | Cldn10b (109–228) by cldn16 (111–235) |
HEK 293 cells were grown in DMEM supplemented with 10% (vol/vol) FCS and 1% penicillin/streptomycin. Cells were transiently transfected using Lipofectamine reagent (Life Technologies). To generate stably expressing HEK 293 cell lines, transfection was carried out on cell-culture dishes followed by treatment with G418 for several days, and positive clones were selected. Clones were screened for CFP or YFP fluorescence, respectively.
Live-Cell Imaging, FRET Analysis, and trans-Interaction Studies.
Live-cell imaging and FRET analysis were carried out as recently described (42). In brief, HEK 293 cells were grown on Lab-Tek chambered cover glasses (Thermo Fisher Scientific) and were transfected with plasmids encoding CFP– or YFP–claudin fusion proteins. Twenty-three to thirty-two hours posttransfection, cells were equilibrated in a Hepes-buffered solution at 37 °C. Live-cell imaging was performed using a Zeiss LSM 510 Meta confocal laser-scanning microscope. CFP and YFP fluorescence signals were obtained by excitation at 458 or 514 nm and were detected at 470–500 or 530–600 nm, respectively. For the analysis of cis interaction, cells were cotransfected with CFP- and YFP-tagged claudins, and FRET was analyzed by the acceptor photobleach approach. The FRET efficiency (EF) is a function of the acceptor/donor ratio, which reaches a plateau at a sufficient relative acceptor amount (42). Thus, to determine EFmax, all EF values at calibrated YFP/CFP ratios of 0.6:3 (plateau) were averaged and involved in statistical analyses. For calibration, a YFP–CFP tandem was used (42). Homotypic trans interaction was studied by the expression of a single CFP- or YFP-tagged claudin and detection of fluorescence enrichment at cell–cell contacts (40, 42, 43). Heterotypic trans interaction was analyzed by coculture of cells individually transfected with CFP- or YFP-tagged claudins and the detection of enrichment at contacts between CFP- and YFP-positive cells.
Statistics.
Data are expressed as mean ± SEM unless stated otherwise. Linear regression was evaluated using the F-test for regression. The slope was considered significantly different from zero at P < 0.05. Statistical tests were performed using GraphPad Prism version 7.00 for Windows.
Acknowledgments
We thank Otmar Huber (Friedrich Schiller University Jena) for the generous gift of HEK 293 cells and pcDNA3-NECFP/-NEYFP expression plasmids. This study was supported by Deutsche Forschungsgemeinschaft Grants Forschergruppe 721 TP07 and FR 652-12/1, Berlin Institute of Health Grant CRG2bTP4, and NIH Grant R01DK084059.
Footnotes
The authors declare no conflict of interest.
This article is a PNAS Direct Submission.
This article contains supporting information online at www.pnas.org/lookup/suppl/doi:10.1073/pnas.1611684114/-/DCSupplemental.
References
- 1.Krause G, et al. Structure and function of claudins. Biochim Biophys Acta. 2008;1778(3):631–645. doi: 10.1016/j.bbamem.2007.10.018. [DOI] [PubMed] [Google Scholar]
- 2.Kiuchi-Saishin Y, et al. Differential expression patterns of claudins, tight junction membrane proteins, in mouse nephron segments. J Am Soc Nephrol. 2002;13(4):875–886. doi: 10.1681/ASN.V134875. [DOI] [PubMed] [Google Scholar]
- 3.Kirk A, Campbell S, Bass P, Mason J, Collins J. Differential expression of claudin tight junction proteins in the human cortical nephron. Nephrol Dial Transplant. 2010;25(7):2107–2119. doi: 10.1093/ndt/gfq006. [DOI] [PMC free article] [PubMed] [Google Scholar]
- 4.Lee JW, Chou CL, Knepper MA. Deep sequencing in microdissected renal tubules identifies nephron segment-specific transcriptomes. J Am Soc Nephrol. 2015;26(11):2669–2677. doi: 10.1681/ASN.2014111067. [DOI] [PMC free article] [PubMed] [Google Scholar]
- 5.Milatz S, et al. Claudin-3 acts as a sealing component of the tight junction for ions of either charge and uncharged solutes. Biochim Biophys Acta. 2010;1798(11):2048–2057. doi: 10.1016/j.bbamem.2010.07.014. [DOI] [PubMed] [Google Scholar]
- 6.Van Itallie CM, Fanning AS, Anderson JM. Reversal of charge selectivity in cation or anion-selective epithelial lines by expression of different claudins. Am J Physiol Renal Physiol. 2003;285(6):F1078–F1084. doi: 10.1152/ajprenal.00116.2003. [DOI] [PubMed] [Google Scholar]
- 7.Van Itallie CM, et al. Two splice variants of claudin-10 in the kidney create paracellular pores with different ion selectivities. Am J Physiol Renal Physiol. 2006;291(6):F1288–F1299. doi: 10.1152/ajprenal.00138.2006. [DOI] [PubMed] [Google Scholar]
- 8.Günzel D, et al. Claudin-10 exists in six alternatively spliced isoforms that exhibit distinct localization and function. J Cell Sci. 2009;122(Pt 10):1507–1517. doi: 10.1242/jcs.040113. [DOI] [PubMed] [Google Scholar]
- 9.Ohta H, Adachi H, Takiguchi M, Inaba M. Restricted localization of claudin-16 at the tight junction in the thick ascending limb of Henle’s loop together with claudins 3, 4, and 10 in bovine nephrons. J Vet Med Sci. 2006;68(5):453–463. doi: 10.1292/jvms.68.453. [DOI] [PubMed] [Google Scholar]
- 10.Plain A, et al. Corticomedullary difference in the effects of dietary Ca2+ on tight junction properties in thick ascending limbs of Henle’s loop. Pflugers Arch. 2016;468(2):293–303. doi: 10.1007/s00424-015-1748-7. [DOI] [PubMed] [Google Scholar]
- 11.Rosenthal R, et al. Claudin-2, a component of the tight junction, forms a paracellular water channel. J Cell Sci. 2010;123(Pt 11):1913–1921. doi: 10.1242/jcs.060665. [DOI] [PubMed] [Google Scholar]
- 12.Breiderhoff T, et al. Deletion of claudin-10 (Cldn10) in the thick ascending limb impairs paracellular sodium permeability and leads to hypermagnesemia and nephrocalcinosis. Proc Natl Acad Sci USA. 2012;109(35):14241–14246. doi: 10.1073/pnas.1203834109. [DOI] [PMC free article] [PubMed] [Google Scholar]
- 13.Simon DB, et al. Paracellin-1, a renal tight junction protein required for paracellular Mg2+ resorption. Science. 1999;285(5424):103–106. doi: 10.1126/science.285.5424.103. [DOI] [PubMed] [Google Scholar]
- 14.Konrad M, et al. Mutations in the tight-junction gene claudin 19 (CLDN19) are associated with renal magnesium wasting, renal failure, and severe ocular involvement. Am J Hum Genet. 2006;79(5):949–957. doi: 10.1086/508617. [DOI] [PMC free article] [PubMed] [Google Scholar]
- 15.Will C, et al. Targeted deletion of murine Cldn16 identifies extra- and intrarenal compensatory mechanisms of Ca2+ and Mg2+ wasting. Am J Physiol Renal Physiol. 2010;298(5):F1152–F1161. doi: 10.1152/ajprenal.00499.2009. [DOI] [PubMed] [Google Scholar]
- 16.Hou J, et al. Transgenic RNAi depletion of claudin-16 and the renal handling of magnesium. J Biol Chem. 2007;282(23):17114–17122. doi: 10.1074/jbc.M700632200. [DOI] [PubMed] [Google Scholar]
- 17.Hou J, et al. Claudin-16 and claudin-19 interact and form a cation-selective tight junction complex. J Clin Invest. 2008;118(2):619–628. doi: 10.1172/JCI33970. [DOI] [PMC free article] [PubMed] [Google Scholar]
- 18.Hou J, et al. Claudin-16 and claudin-19 interaction is required for their assembly into tight junctions and for renal reabsorption of magnesium. Proc Natl Acad Sci USA. 2009;106(36):15350–15355. doi: 10.1073/pnas.0907724106. [DOI] [PMC free article] [PubMed] [Google Scholar]
- 19.Angelow S, El-Husseini R, Kanzawa SA, Yu AS. Renal localization and function of the tight junction protein, claudin-19. Am J Physiol Renal Physiol. 2007;293(1):F166–F177. doi: 10.1152/ajprenal.00087.2007. [DOI] [PubMed] [Google Scholar]
- 20.Gong Y, et al. Claudin-14 regulates renal Ca++ transport in response to CaSR signalling via a novel microRNA pathway. EMBO J. 2012;31(8):1999–2012. doi: 10.1038/emboj.2012.49. [DOI] [PMC free article] [PubMed] [Google Scholar]
- 21.Gong Y, Himmerkus N, Plain A, Bleich M, Hou J. Epigenetic regulation of microRNAs controlling CLDN14 expression as a mechanism for renal calcium handling. J Am Soc Nephrol. 2015;26(3):663–676. doi: 10.1681/ASN.2014020129. [DOI] [PMC free article] [PubMed] [Google Scholar]
- 22.Dimke H, et al. Activation of the Ca(2+)-sensing receptor increases renal claudin-14 expression and urinary Ca(2+) excretion. Am J Physiol Renal Physiol. 2013;304(6):F761–F769. doi: 10.1152/ajprenal.00263.2012. [DOI] [PMC free article] [PubMed] [Google Scholar]
- 23.Thorleifsson G, et al. Sequence variants in the CLDN14 gene associate with kidney stones and bone mineral density. Nat Genet. 2009;41(8):926–930. doi: 10.1038/ng.404. [DOI] [PubMed] [Google Scholar]
- 24.Ikari A, et al. Association of paracellin-1 with ZO-1 augments the reabsorption of divalent cations in renal epithelial cells. J Biol Chem. 2004;279(52):54826–54832. doi: 10.1074/jbc.M406331200. [DOI] [PubMed] [Google Scholar]
- 25.Ikari A, et al. Phosphorylation of paracellin-1 at Ser217 by protein kinase A is essential for localization in tight junctions. J Cell Sci. 2006;119(Pt 9):1781–1789. doi: 10.1242/jcs.02901. [DOI] [PubMed] [Google Scholar]
- 26.Hou J, Paul DL, Goodenough DA. Paracellin-1 and the modulation of ion selectivity of tight junctions. J Cell Sci. 2005;118(Pt 21):5109–5118. doi: 10.1242/jcs.02631. [DOI] [PubMed] [Google Scholar]
- 27.Kausalya PJ, et al. Disease-associated mutations affect intracellular traffic and paracellular Mg2+ transport function of claudin-16. J Clin Invest. 2006;116(4):878–891. doi: 10.1172/JCI26323. [DOI] [PMC free article] [PubMed] [Google Scholar]
- 28.Günzel D, et al. Claudin-16 affects transcellular Cl- secretion in MDCK cells. J Physiol. 2009;587(Pt 15):3777–3793. doi: 10.1113/jphysiol.2009.173401. [DOI] [PMC free article] [PubMed] [Google Scholar]
- 29.Krug SM, et al. Claudin-17 forms tight junction channels with distinct anion selectivity. Cell Mol Life Sci. 2012;69(16):2765–2778. doi: 10.1007/s00018-012-0949-x. [DOI] [PMC free article] [PubMed] [Google Scholar]
- 30.Bailly C, Imbert-Teboul M, Roinel N, Amiel C. Isoproterenol increases Ca, Mg, and NaCl reabsorption in mouse thick ascending limb. Am J Physiol. 1990;258(5 Pt 2):F1224–F1231. doi: 10.1152/ajprenal.1990.258.5.F1224. [DOI] [PubMed] [Google Scholar]
- 31.Di Stefano A, et al. Effects of glucagon on Na+, Cl-, K+, Mg2+ and Ca2+ transports in cortical and medullary thick ascending limbs of mouse kidney. Pflugers Arch. 1989;414(6):640–646. doi: 10.1007/BF00582129. [DOI] [PubMed] [Google Scholar]
- 32.Di Stefano A, et al. Effects of parathyroid hormone and calcitonin on Na+, Cl-, K+, Mg2+ and Ca2+ transport in cortical and medullary thick ascending limbs of mouse kidney. Pflugers Arch. 1990;417(2):161–167. doi: 10.1007/BF00370694. [DOI] [PubMed] [Google Scholar]
- 33.Wittner M, et al. Differential effects of ADH on sodium, chloride, potassium, calcium and magnesium transport in cortical and medullary thick ascending limbs of mouse nephron. Pflugers Arch. 1988;412(5):516–523. doi: 10.1007/BF00582541. [DOI] [PubMed] [Google Scholar]
- 34.Gong Y, et al. Biochemical and biophysical analyses of tight junction permeability made of claudin-16 and claudin-19 dimerization. Mol Biol Cell. 2015;26(24):4333–4346. doi: 10.1091/mbc.E15-06-0422. [DOI] [PMC free article] [PubMed] [Google Scholar]
- 35.Tsuruoka S, Takeda M, Yoshitomi K, Imai M. Cellular heterogeneity of ammonium ion transport across the basolateral membrane of the hamster medullary thick ascending limb of Henle’s loop. J Clin Invest. 1993;92(4):1881–1888. doi: 10.1172/JCI116780. [DOI] [PMC free article] [PubMed] [Google Scholar]
- 36.Xu JZ, et al. Localization of the ROMK protein on apical membranes of rat kidney nephron segments. Am J Physiol. 1997;273(5 Pt 2):F739–F748. doi: 10.1152/ajprenal.1997.273.5.F739. [DOI] [PubMed] [Google Scholar]
- 37.Mount DB, et al. Isoforms of the Na-K-2Cl cotransporter in murine TAL I. Molecular characterization and intrarenal localization. Am J Physiol. 1999;276(3 Pt 2):F347–F358. doi: 10.1152/ajprenal.1999.276.3.F347. [DOI] [PubMed] [Google Scholar]
- 38.Allen F, Tisher CC. Morphology of the ascending thick limb of Henle. Kidney Int. 1976;9(1):8–22. doi: 10.1038/ki.1976.2. [DOI] [PubMed] [Google Scholar]
- 39.Daugherty BL, Ward C, Smith T, Ritzenthaler JD, Koval M. Regulation of heterotypic claudin compatibility. J Biol Chem. 2007;282(41):30005–30013. doi: 10.1074/jbc.M703547200. [DOI] [PubMed] [Google Scholar]
- 40.Piontek J, et al. Formation of tight junction: Determinants of homophilic interaction between classic claudins. FASEB J. 2008;22(1):146–158. doi: 10.1096/fj.07-8319com. [DOI] [PubMed] [Google Scholar]
- 41.Greger R. Cation selectivity of the isolated perfused cortical thick ascending limb of Henle’s loop of rabbit kidney. Pflugers Arch. 1981;390(1):30–37. doi: 10.1007/BF00582707. [DOI] [PubMed] [Google Scholar]
- 42.Milatz S, et al. Probing the cis-arrangement of prototype tight junction proteins claudin-1 and claudin-3. Biochem J. 2015;468(3):449–458. doi: 10.1042/BJ20150148. [DOI] [PubMed] [Google Scholar]
- 43.Piontek J, et al. Elucidating the principles of the molecular organization of heteropolymeric tight junction strands. Cell Mol Life Sci. 2011;68(23):3903–3918. doi: 10.1007/s00018-011-0680-z. [DOI] [PMC free article] [PubMed] [Google Scholar]


