

Abstract
Patient: Female, 45
Final Diagnosis: Breast cancer
Symptoms: Breast tumor
Medication: —
Clinical Procedure: Analysis of circulating tumor DNA
Specialty: Oncology
Objective:
Unusual setting of medical care
Background:
The analysis of circulating tumor DNA (ctDNA) is expected to be a modality to determine the status of cancer in real time. This case indicated utilities and issues in measuring the ctDNA in cancer patients.
Case Report:
A 45-year-old woman with metastatic breast cancer was treated with bevacizumab and paclitaxel. The lung metastases were decreased but the meningitis carcinoma developed rapidly and she died. During the treatment with bevacizumab and paclitaxel, blood samples were taken serially and ctDNA was analyzed using a next-generation sequencer.
TP53 frameshift mutation (TP53; p.Arg158fs with 7 nucleotides deletion) was identified in the tumor, and dynamic change in this mutation in ctDNA was observed in serially sampled plasma in this patient. We observed a rapid decrease of TP53 mutation at the beginning of treatment, then it increased as a sign of relapse. However, the high allelic fraction value of TP53 mutation was not consistent during the progression of cancer, suggesting that several factors affected the value of ctDNA.
Conclusions:
Although this is a single-case experience, it strongly suggests ctDNA could be a modality to determine the cancer status in real time. However, we found that several factors affected the value of ctDNA. Further investigations are needed to reveal the significance of these very high-sensitivity changes.
MeSH Keywords: Breast; DNA Mutational Analysis; Genes, p53
Background
Breast cancer is the most frequent malignancy in females, with 1.7 million new cases developing annually worldwide [1] and 60 000 new cases in Japan [2]. Although most metastatic breast cancer is incurable, progress in developing anti-cancer drugs has improved the survival of breast cancer patients [3]. Recently, the utility of liquid biopsy, such as circulating tumor cells (CTC) and circulating tumor DNA (ctDNA), has emerged [4]. These modalities are important in the progress of personalized therapies.
The analysis of ctDNA is expected to be a non-invasive method to determine the real-time status of patients with cancer, such as tumor burden, existence or potency of cancer metastases, and response to anti-cancer therapies [5]. However, a variety of mutated genes and their dynamic changes observed in cell-free DNA make this difficult.
We found a dynamic change in ctDNA (TP53, p.Arg158fs with 7 nucleotides deletion) as a “marker” in plasma of a patient treated with bevacizumab and paclitaxel. This mutation was easily confirmed as a tumor-derived mutated gene and we detected very small amount until 2–5×10⁻⁵ of allelic fraction (AF). This case indicated the utility of and issues regarding the measurement of ctDNA in cancer patients.
Case Report
A 45-year-old Japanese woman, who had a right breast lump that had expanded over the previous 6 months, visited our hospital in December 2012. She was not married, was nongravida, and had no history of other diseases. Her right breast was swollen, with skin edema and a protruding tumor measuring 8 × 8 cm in diameter (Figure 1A).
Figure 1.

(A) Physical finding at hospitalization, left breast swollen with skin edema and the tumor measuring 8×8 cm in diameter, protruded with purple-blue skin. Fixed axillary lymph node was palpable. (B) Enhanced CT indicated breast cancer with skin invasion and axillary lymph node metastases. Visceral metastases were not detected. (C) Contrast CT after the neoadjuvant chemotherapy showed the same size of tumor. Pathologic findings of breast cancer. (D) Hematoxylin-eosin (HE) staining indicated invasive breast cancer with solid expanding growth, with high nuclear grade (G3). (E) Immunohistochemical analysis indicated HER2 (3+) according to the ASCO/CAP criteria. (F) The expression of TP53 by immunohistochemical staining. TP53 was not stained in this case.
In addition, the fixed axillary lymph node was palpable. Laboratory data obtained at the first visit to our hospital indicated no abnormal findings, except for a carcinoembryonic antigen (CEA) level of 50.5 ng/ml. A contrast-enhanced CT performed prior to the administration of chemotherapy revealed breast cancer with skin invasion and axillary lymph node metastases, but no visceral metastases were detected (Figure 1B). The results of a core needle biopsy indicated the pathological diagnosis of invasive breast cancer, and the immunohistochemical analysis indicated ER (−) PR (−) HER2 (3+) subtype. We diagnosed her as being in clinical stage III b, and started the primary neoadjuvant chemotherapy with FEC90 (epirubicin 90 mg/m2, 5FU 500 mg/m2, and cyclophosphamide 500 mg/m2) for 4 cycles, followed by docetaxel (75 mg/m2) and trastuzumab (8 mg/kg) with loading dose and 6 mg/kg with maintenance dose every 3 weeks with 4 cycles. A contrast CT performed after the neoadjuvant chemotherapy showed the same size of tumor (Figure 1C). Tumor regression was not observed, and the clinical response was judged as stable disease (SD) according to the RECIST criteria. The patient underwent mastectomy with skin graft, and received radiation therapy for chest wall and regional lymph nodes, after which the adjuvant trastuzumab was administrated for 1 year. Pathological findings for the resected tumor indicated the diagnosis of invasive breast cancer with solid expanding growth, with high nuclear grade (G3) and obvious nuclear body (Figure 1D). Immunohistochemical analysis indicated ER (−) PR (−) HER2 (3+) of HER2 type breast cancer (Figure 1E), and negative staining of TP53 (Figure 1F).
One year after the operation, the CEA value elevated at 22 ng/ml and CT revealed lung metastases (Figure 2A). We started bevacizumab and paclitaxel regimen (bevacizumab with 100 mg/day 1 and 14, paclitaxel 80 mg/m2 for day 1, 7, and 14) every 4 weeks. During the treatment with bevacizumab and paclitaxel, blood samples were taken serially and ctDNA was analyzed. The lung metastases were decreased and stable but meningitis carcinoma developed rapidly (Figure 2B), and she died.
Figure 2.

CT finding at recurrence and terminal stage. (A) Chest CT indicates the lung metastases at pretreatment with bevacizumab and paclitaxel. (B) Brain CT at terminal stage indicated meningeal metastasis.
Genome analysis
The patient provided written informed consent for the genetic research studies, which were performed in accordance with protocols approved by the Institutional Review Board at our hospital [6]. The tumor sample was obtained from formalin-fixed paraffin-embedded tissue by laser-capture microdis-section from the axillary lymph node removed after primary therapy. The primary breast tumor was not suitable for subsequent genomic analysis because of severe DNA fragmentation and scant DNA. Peripheral blood samples were collected at pretreatment for metastases and at 30, 60, 120, 150, 180, and 210 days after the first administration of the treatment serially. Tumor and buffy coat samples were subjected to next-generation sequencing analysis using the Ion AmpliSeq™ Cancer Hotspot Panel v2 (Thermo Fisher Scientific, Waltham, MA), which targets the hotspot regions of 50 oncogenes and tumor-suppressor genes (Table 1). A matched buffy coat sample was used as a control to detect somatic mutations.
Table 1.
Ion AmpliSeq™ Cancer Hotspot Panel v2.
| ABL1 | EZH2 | JAK3 | PTEN |
| AKT1 | FBXW7 | IDH2 | PTPN11 |
| ALK | FGFR1 | KDR | RB1 |
| APC | FGFR2 | KIT | RET |
| ATM | FGFR3 | KRAS | SMAD4 |
| BRAF | FLT3 | MET | SMARCB1 |
| CDH1 | GNA11 | MLH1 | SMO |
| CDKN2A | GNAS | MPL | SRC |
| CSF1R | GNAQ | NOTCH1 | STK11 |
| CTNNB1 | HNF1A | NPN1 | TP53 |
| EGFR | HRAS | NRAS | VHL |
| ERBB2 | IDH1 | PDGFRA | |
| ERBB4 | JAK2 | PIK3CA |
As a result, TP53 frameshift mutation (TP53 p.Arg158fs) was identified in the tumor, and its variant allelic fraction was 79% (coverage: 1522/1931) (Figure 3). Then, we serially analyzed the 7 obtained plasma samples (at 0 as pretreatment and 30, 60, 120, 150, 180, 210 days) during the treatment by targeted amplicon sequencing using primers flanking the TP53 p.Arg158fs mutations site. We obtained high-depth sequencing data (average coverage depth: 7322820, (range: 94432–1201464) and detected TP53 p.Arg158fs mutation at the bottom of 2–5×10⁻⁵ of AF (Table 2). We performed Sanger sequencing and validated the TP53 p.Arg158fs mutations in the tumor and plasma taken at 120 days after treatment (Figure 4). The other plasma samples (pretreatment and days 30 and 60) with AF values less than 1.4% were not detected by Sanger sequencing due to the detection limit [7].
Figure 3.
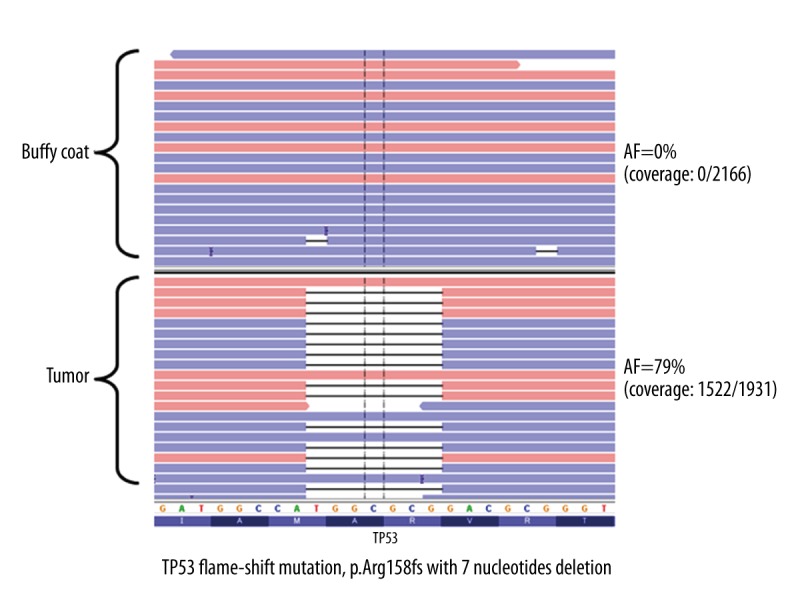
The analysis of tumor sample (axillary lymph node metastases) using Cancer Hotspot Panel v2. One mutation in TP53; p.Arg158fs with 7-nucleotide deletion with 79% of allelic fraction (coverage; 1522/1931) was observed.
Table 2.
CEA and TP53 mutation of serially sampled plasma samples.
| Days | CEA (ng/ml) | TP53 amplicon sequencing | Sanger sequencing | |
|---|---|---|---|---|
|
| ||||
| Reads/coverage | AF (%) | |||
| 0 | 22.0 | 16195/1160960 | 1.4 | Not Detected |
| 30 | 15.7 | 61/1185680 | 0.005 | Not Detected |
| 60 | 8.7 | 22/1187291 | 0.002 | Not Detected |
| 120 | 4.3 | 255656/1201464 | 21.3 | Detected |
| 150 | 5.2 | 719/117424 | 0.61 | NA |
| 180 | 6.0 | 7/178723 | 0.004 | NA |
| 210 | 14.1 | 3/94432 | 0.003 | NA |
AF – allelic fraction; NA – not aplicable.
Figure 4.

Analysis of plasma DNA using Sanger sequencing. TP53 p.Arg158fs mutations in tumor and plasma taken at 120 days after treatment were detected by Sanger sequencing. The other plasma samples (pretreatment and day 30 and 60) with AF values less than 1.4% were not detected.
The change in CEA values and AF of TP53 mutation during the treatment with bevacizumab and paclitaxel is shown in Figure 5. Approximately 60 days after the start of chemotherapy, AF of TP53 mutation dropped from 1.4% to 0% (despite CEA lingering around 15.7 ng/ml), but CEA gradually fell afterwards to a low of 4.0–4.3 ng/ml. But at the low of CEA (4.3 ng/ml), AF jumped to 21% (255,656 reads of 1201,464 coverage), detectable even by Sanger method (Figure 4). CEA slowly started to climb and reached 14.1 ng/ml at 90 days from the AF 21% time. Clinical worsening was now recognized after 3-month delay. However, the TP53 mutation was decreased to 4–5×10⁻⁴ of AF at 150, 180, and 210 days during the treatment.
Figure 5.
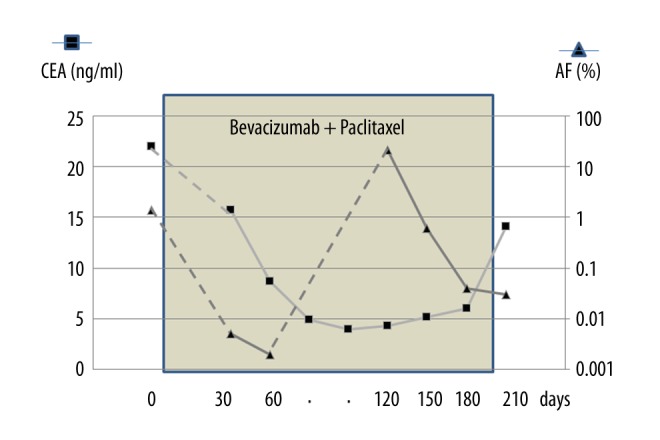
The change in CEA values and AF of TP53 mutation during the treatment with bevacizumab and paclitaxel. Approximately 60 days after the start of chemotherapy, AF of TP53 mutation dropped from 1.4% to 0% (despite CEA lingering at around 15.7 ng/ml), but CEA gradually declined afterwards to a low of 4.0–4.3 ng/ml, and at the low-point of CEA (4.3 ng/ml), AF jumped to 21%. CEA slowly started to climb and reached 14.1 ng/ml at 90 days from the AF 21% time. However, the TP53 was decreased to 4–5×10⁻⁴ of AF at 150, 180, and 210 days during the treatment.
Discussion
Since the existence of fragment of DNA in plasma was initially reported by Mandel et al. in 1948 [8], the utility of circulating cell-free DNA (cfDNA) has been studied in various areas of medicine. Progress in next-generation sequencing made it possible to utilize cfDNA in clinical practice, such as in prenatal assessment in high-risk infants [9], renal failure [10], myocardial infarction [11], and trauma [12]. In oncology, detection of cfDNA derived from tumors has been an exciting target to pursue as a tool to assess cancer patients in real time, such as tumor burden, existence or potency of cancer metastases, and response to anti-cancer therapies [13–16].
The definition of ctDNA is presented as a portion of cell-free DNA (cfDNA) derived from cancer cells [4]. It is thought to originate from lytic, apoptotic, or necrotic tumor cells, by active secretion from macrophages that have phagocytized necrotic cells, or from circulating tumor cells themselves.
There are several issues in measuring ctDNA in cancer management: how to discriminate ctDNA from normal cfDNA, what level of concentration to measure, and when to take samples to see the change in ctDNA. The presented case may indicate some suggestions for these issues.
Most tests for the detection of tumor-derived cfDNA target characteristic genetic or epigenetic modifications, such as mutations in tumor-suppressor genes, activated oncogenes, hypermethylation, or chromosomal disorders [7]. The 7-nucleotide deletion of TP53 mutation detected in axillary metastases could be an adequate target to analyze the ctDNA in this case. Instead of using a single-nucleotide change, which often suffers from sequencing errors, we could measure a very small amount of ctDNA by targeting a related large deletion (7 nucleotides of TP53) [17].
Regarding the second issue – the level of concentration to be measured – the concentration of ctDNA in cfDNA is usually considered very small if it is less than 0.1%. However, there is still no standard method to detect and measure the ctDNA. There are several methods used to analyze ctDNA, such as Sanger sequencing, digital PCR, targeted amplicon sequencing and multi-gene parallel sequencing. The sensitivities of these methods vary: more than 10% of ctDNA in total DNA can be detected in Sanger sequence, while less than 0.01% can be detected in digital PCR or target amplicon sequencing [16,18].
The value of AF decreases according to the effect of treatment before the change in CEA. Plasma sample taken at 30 days after the chemotherapy already showed almost zero value (0.005% of AF), indicating ctDNA had very rapid turnover. This amount of ctDNA is usually not detected and might be defined as a major molecular response (MMR). It was reported that ctDNA has a comparatively short half-life time (approximately 2 h), allowing us to observe the change in hours rather than weeks or months [18]. Therefore, the plasma sample taken after several days provided important information on the therapeutic effect.
Then, we observed that the ctDNA level suddenly increased 2 months earlier than the CEA. This surge indicates that a large amount of ctDNA was released at that time due to some dynamic change in the metastatic lesion. Subsequently, the value was stable at 2–4×10⁻⁴, regardless of the progression of disease and elevation of CEA value. Compared with the protein markers CEA or CA15-3, ctDNA can more sensitively detect rapid changes in tumor burden [19].
Why was the high value of AF not consistent during the progression of cancer metastases? The metastatic site (meningeal metastases) progressed at terminal stage might have tumor heterogeneity bearing another mutational profile without 7-nucleotide deletion of TP53. Otherwise, the total cfDNA changed in a substantial proportion might affect the decreased value of AF for ctDNA. It was difficult to determine the mechanism of dynamic change in ctDNA during the progression of cancer metastases in this case. Quantitative analysis might be needed determine the changes in ctDNA. Further investigations are needed to reveal the significance of these high-sensitivity changes.
Conclusions
Although this is a single case experience, it strongly suggests that “liquid biopsy” or ctDNA in plasma could be a modality to determine cancer status in real time. However, several factors affect the value of ctDNA, and further investigations are needed to reveal the significance of these high-sensitivity changes.
Acknowledgments
We thank Takuro Uchida, Yumi Kubota, and Sae Watanabe for their assistance.
Footnotes
Disclosure statement
The authors have no conflict of interest to declare.
References:
- 1.Ferlay J, Soerjomataram I, Dikshit R, et al. Cancer incidence and mortality worldwide: sources, methods and major patterns in GLOBOCAN 2012. Int J Cancer. 2015;136:E359–86. doi: 10.1002/ijc.29210. [DOI] [PubMed] [Google Scholar]
- 2.Monitering of Cancer Incidence in Japan MCIJ 2010. available at http://ganjoho.jp/data/professional/statistics/backnumber/2013/fig01.pdf. September, 2015.
- 3.Gennari A, Conte P, Rosso R, et al. Survival of metastatic breast carcinoma patients over a 20-year period: A retrospective analysis based on individual patient data from six consecutive studies. Cancer. 2005;104:1742–50. doi: 10.1002/cncr.21359. [DOI] [PubMed] [Google Scholar]
- 4.Pantel K, Alix-Panabieres C. Real-time liquid biopsy in cancer patients: Fact or fiction? Cancer Res. 2013;73:6384–88. doi: 10.1158/0008-5472.CAN-13-2030. [DOI] [PubMed] [Google Scholar]
- 5.Diaz LA, Jr, Bardelli A. Liquid biopsies: Genotyping circulating tumor DNA. J Clin Oncol. 2014;32:579–86. doi: 10.1200/JCO.2012.45.2011. [DOI] [PMC free article] [PubMed] [Google Scholar]
- 6.Hirotsu Y, Nakagomi H, Sakamoto I, et al. Detection of BRCA1 and BRCA2 germline mutations in Japanese population using next-generation sequencing. Mol Genet Genomic Med. 2015;3:121–29. doi: 10.1002/mgg3.120. [DOI] [PMC free article] [PubMed] [Google Scholar]
- 7.Hirotsu Y, Kanda T, Matsumura H, et al. HCV NS5A resistance-associated variants in a group of real-world Japanese patients chronically infected with HCV genotype 1b. Hepatol Int. 2015;9:424–30. doi: 10.1007/s12072-015-9624-2. [DOI] [PubMed] [Google Scholar]
- 8.Mandel P, Metais P. C R Seances Soc Biol Fil. 1948;142:241–43. [Not Available] [PubMed] [Google Scholar]
- 9.Lo YM, Chiu RW. Genomic analysis of fetal nucleic acids in maternal blood. Annu Rev Genomics Hum Genet. 2012;13:285–306. doi: 10.1146/annurev-genom-090711-163806. [DOI] [PubMed] [Google Scholar]
- 10.Korabecna M, Opatrna S, Wirth J, et al. Cell-free plasma DNA during peritoneal dialysis and hemodialysis and in patients with chronic kidney disease. Ann NY Acad Sci. 2008;1137:296–301. doi: 10.1196/annals.1448.014. [DOI] [PubMed] [Google Scholar]
- 11.Antonatos D, Patsilinakos S, Spanodimos S, et al. Cell-free DNA levels as a prognostic marker in acute myocardial infarction. Ann NY Acad Sci. 2006;1075:278–81. doi: 10.1196/annals.1368.037. [DOI] [PubMed] [Google Scholar]
- 12.Macher H, Egea-Guerrero JJ, Revuelto-Rey J, et al. Role of early cell-free DNA levels decrease as a predictive marker of fatal outcome after severe traumatic brain injury. Clin Chim Acta. 2012;414:12–17. doi: 10.1016/j.cca.2012.08.001. [DOI] [PubMed] [Google Scholar]
- 13.Voduc KD, Cheang MC, Tyldesley S, et al. Breast cancer subtypes and the risk of local and regional relapse. J Clin Oncol. 2010;28:1684–91. doi: 10.1200/JCO.2009.24.9284. [DOI] [PubMed] [Google Scholar]
- 14.Dawson SJ, Tsui DW, Murtaza M, et al. Analysis of circulating tumor DNA to monitor metastatic breast cancer. N Engl J Med. 2013;368:1199–209. doi: 10.1056/NEJMoa1213261. [DOI] [PubMed] [Google Scholar]
- 15.Lipson EJ, Velculescu VE, Pritchard TS, et al. Circulating tumor DNA analysis as a real-time method for monitoring tumor burden in melanoma patients undergoing treatment with immune checkpoint blockade. J Immunother Cancer. 2014;2:42. doi: 10.1186/s40425-014-0042-0. [DOI] [PMC free article] [PubMed] [Google Scholar]
- 16.Rothe F, Laes JF, Lambrechts D, et al. Plasma circulating tumor DNA as an alternative to metastatic biopsies for mutational analysis in breast cancer. Ann Oncol. 2014;25:1959–65. doi: 10.1093/annonc/mdu288. [DOI] [PubMed] [Google Scholar]
- 17.Goto T, Hirotsu Y, Oyama T, et al. Analysis of tumor-derived DNA in plasma and bone marrow fluid in lung cancer patients. Med Oncol. 2016;33:29. doi: 10.1007/s12032-016-0744-x. [DOI] [PubMed] [Google Scholar]
- 18.Diehl F, Schmidt K, Choti MA, et al. Circulating mutant DNA to assess tumor dynamics. Nat Med. 2008;14:985–90. doi: 10.1038/nm.1789. [DOI] [PMC free article] [PubMed] [Google Scholar]
- 19.Shaw JA, Stebbing J. Circulating free DNA in the management of breast cancer. Ann Transl Med. 2014;2:3. doi: 10.3978/j.issn.2305-5839.2013.06.06. [DOI] [PMC free article] [PubMed] [Google Scholar]