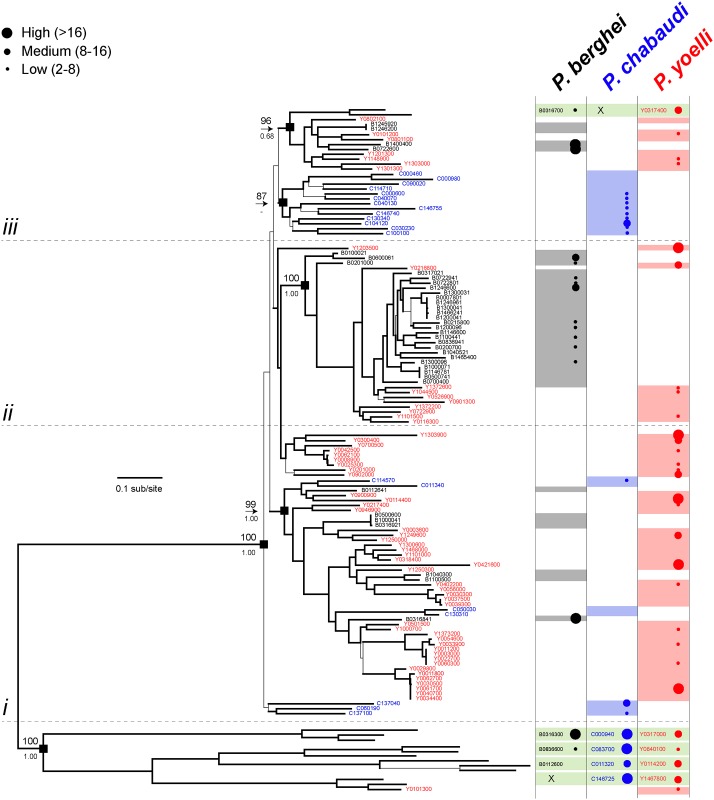
There are errors in this article that the authors and publisher wish to correct. In Table 2, there are formatting errors in the table headings and in the “Double gene-tagging mutants (multigene families)” section. Please see the corrected Table 2 here. The publisher apologizes for the errors. In addition, in preparation of the figures for publication the authors inadvertently inserted Figure 1 for Fig 3. Please see the correct Fig 3 here.
Table 2. Features of tagged members of the pir, fam-a and fam-b multigene families.
| Name tagged protein | Fluorescent tag | Mutant name | RMgmDB ID1 | BLOOD | LIVER | |||
|---|---|---|---|---|---|---|---|---|
| expression and localisation | % of clones fluorescent | fluorescent before passage (%) | fluorescent after passage (%) | protein localisation | ||||
| Single gene-tagging mutants (multigene families) | ||||||||
| Fam-a1 | mCherry | 1477cl3 | 690 | Yes; RBC s | 33% (n = 3) | 80–90% | 50–70% | Yes; PV |
| Fam-a1 | GFP | 1941 | 1283 | Yes; RBC s | N.A. | 25–30% | 30% | No |
| Fam-a2 | mCherry | 1448cl2 | 693 | Yes; RBC c pa | 60% (n = 5) | 99% | 85–100% | Yes; PV |
| Fam-b1 | mCherry | 1599cl4 | 699 | Yes; RBC c pa | 66% (n = 3) | 5–15% | 5% | Yes; PV |
| Fam-b2 | mCherry | 1731cl4 | 700 | Yes; RBC c pa | 100% (n = 5) | 65% | 50–70% | Yes; PV |
| Fam-b2 | GFP | 1942 | 1282 | Yes; RBC c pa | N.A. | 50–75% | N.D. | N.D |
| PIR1 | mCherry | 1531cl3 | 695 | Yes; RBC c pa | 100% (n = 5) | 15% | 60–70% | Yes; PV |
| PIR1 | mCherry | 1944cl1 | 1281 | Yes; RBC c pa | 66% (n = 3) | 10–20% | N.D. | N.D. |
| PIR2 | GFP | 603cl3 | 696 | Yes; RBC c pa | 75% (n = 4) | 5–10% | 5% | No |
| PIR3 | mCherry | 1918cl4 | 697 | Yes; RBC c pa | 25% (n = 4) | 1%-5% | N.D. | No |
| PIR4 | mCherry | 2450 | 1233 | Yes; RBC c pa | N.A. | 0.1–2% | N.D. | No |
| PIR5 | mCherry | 2448cl1 | 1234 | Yes; RBC c pa | 100% (n = 3) | 25–50% | N.D. | N.D. |
| PIR6 | mCherry | 1892 | 698 | Yes; RBC c pa | N.A. | <0.1% | N.D. | N.D. |
| PIR7 | mCherry | 2211 | 1235 | Yes; RBC c pa | N.A. | <0.1% | N.D. | N.D. |
| PIR8 | mCherry | 2312, 2313 | 1236 | Yes; RBC c pa | N.A. | 50–60% | 30–60% | yes, parasite cyt |
| Double gene-tagging mutants (multigene families) | ||||||||
| Fam-a2 Fam-a1 Fam-a2/a1 |
mCherry GFP mCherry&GFP |
2010 (2011) | 1244 | Yes; RBC c pa Yes; RBC s |
N.A. | 70–80% 40–65% 40–55% |
70–80% 45–50% 30–40% |
Yes; PV (>90%) No |
| Fam-a2 Fam-a1 Fam-a2/a1 |
GFP mCherry GFP&mCherry |
2504cl3 | 1245 | Yes; RBC c pa Yes; RBC s |
100% (n = 3) | 80–90% 80–90% 80–85% |
75–80% 60–65% 70–80% |
Yes; PV (70–75%) Yes, PV (30–40%) 30–40% |
| Fam-b1 Fam-b2 Fam-b1/b2 |
mCherry GFP mCherry&GFP |
2421(-2424) | 1246 | Yes; RBC c pa Yes; RBC c pa |
N.A. | 40–50% 40–45% 35–45% |
30–50% 50–80% 20–40% |
Yes; PV No |
| PIR1 PIR3 PIR1/PIR3 |
mCherry GFP mCherry&GFP |
2020 (2021) | 1247 | Yes; RBC c pa Yes; RBC c pa |
N.A. | 35–45% 25–35% 20–30% |
40–60% 1–20% 1–5% |
Yes; PV No |
| Single gene-tagging mutants (single copy genes) | ||||||||
| IBIS1 | GFP mcherry |
2009 1940cl1 |
1237 | Yes; RBC c pu | N.A. 100% (n = 1) |
N.D >90% |
N.D. N.D. |
Yes; PV (>90%) |
| SMAC | mCherry | 1565cl1 | 1238 | Yes; RBC c pa | 100% (n = 4) | >90% | N.D. | Yes; PV (>90%) |
Fig 3. Maximum likelihood phylogeny of fam-b gene sequences from Plasmodium spp.
The tree was estimated using RAxML and a GTR+Γ model. Branches subtended by nodes with >75 bootstrap support are shown in bold. Robust basal nodes are indicated by black squares with bootstrap proportions (above node) and Bayesian posterior probabilities (beneath node). At right, coloured blocks indicate the species to which a terminal node belongs. Clades of orthologs that display positional conservation are indicated with green blocks; where a sequence has been lost secondarily in one species, this is shown by an ‘X’. The phylogeny is subdivided into four sections: divergent genes included conserved loci, placed at the root of the tree (below line i); predominantly P. yoelli species-specific genes P. berghei- and P. yoelli-specific paralogs (between lines i, ii and iii); and predominantly P. chabaudi species-specific genes (above line iii). Transcription levels (shown as different coloured and sized circles) in blood stages are shown for individual genes based on RNAseq data (FPKM values) (from [33] and S1 Table). Expression levels as shown by four different sized circles: Class 1 (smallest circle): 2-8x the threshold level; class 2: 8-16x the threshold; class 3 (largest circle): >16x the threshold.
Reference
- 1.Fougère A, Jackson AP, Paraskevi Bechtsi D, Braks JAM, Annoura T, Fonager J, et al. (2016) Variant Exported Blood-Stage Proteins Encoded by Plasmodium Multigene Families Are Expressed in Liver Stages Where They Are Exported into the Parasitophorous Vacuole. PLoS Pathog 12(11): e1005917 doi: 10.1371/journal.ppat.1005917 [DOI] [PMC free article] [PubMed] [Google Scholar]


