

Abstract
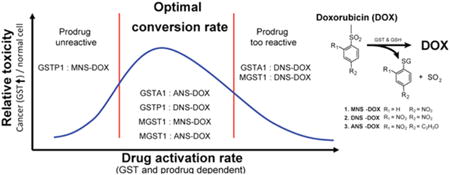
Glutathione transferases (GSTs) are often overexpressed in tumors and frequently correlated to bad prognosis and resistance against a number of different anticancer drugs. To selectively target these cells and to overcome this resistance we previously have developed prodrugs that are derivatives of existing anticancer drugs (e.g., doxorubicin) incorporating a sulfonamide moiety. When cleaved by GSTs, the prodrug releases the cytostatic moiety predominantly in GST overexpressing cells, thus sparing normal cells with moderate enzyme levels. By modifying the sulfonamide it is possible to control the rate of drug release and specifically target different GSTs. Here we show that the newly synthesized compounds, 4-acetyl-2-nitro-benzenesulfonyl etoposide (ANS–etoposide) and 4-acetyl-2-nitro-benzenesulfonyl doxorubicin (ANS–DOX), function as prodrugs for GSTA1 and MGST1 overexpressing cell lines. ANS–DOX, in particular, showed a desirable cytotoxic profile by inducing toxicity and DNA damage in a GST-dependent manner compared to control cells. Its moderate conversion of 500 nmol/min/mg, as catalyzed by GSTA1, seems hereby essential since the more reactive 2,4-dinitrobenzenesulfonyl doxorubicin (DNS–DOX) (14000 nmol/min/mg) did not display a preference for GSTA1 overexpressing cells. DNS–DOX, however, effectively killed GSTP1 (20 nmol/min/mg) and MGST1 (450 nmol/min/mg) overexpressing cells as did the less reactive 4-mononitrobenzenesulfonyl doxorubicin (MNS–DOX) in a MGST1-dependent manner (1.5 nmol/min/mg) as shown previously. Furthermore, we show that the mechanism of these prodrugs involves a reduction in GSH levels as well as inhibition of the redox regulatory enzyme thioredoxin reductase 1 (TrxR1) by virtue of their electrophilic sulfonamide moiety. TrxR1 is upregulated in many tumors and associated with resistance to chemotherapy and poor patient prognosis. Additionally, the prodrugs potentially acted as a general shuttle system for DOX, by overcoming resistance mechanisms in cells. Here we propose that GST-dependent prodrugs require a conversion rate “window” in order to selectively target GST overexpressing cells, while limiting their effects on normal cells. Prodrugs are furthermore a suitable system to specifically target GSTs and to overcome various drug resistance mechanisms that apply to the parental drug.
Keywords: glutathione transferases, prodrugs, MGST1, GSTA1, doxorubicin, etoposide, redox, TrxR1
Graphical abstract
Introduction
Cancer is one of the leading causes of death in privileged countries. In patients suffering from cancer, the choice of therapy depends on several factors, such as the histopathology of the tumor, the stage of the disease, and the patient's condition. Chemotherapy is commonly used as anticancer treatment, but patients often suffer from severe side effects, which are of major concern. Especially highly proliferating cells, present in the bone marrow, hair follicles, and gastrointestinal mucosa, are affected by conventional chemotherapeutics leading to common side effects like myelosuppression, alopecia, and mucositis.1 Further, there are additional and more specific side effects depending on the cytostatic drug used. Doxorubicin (DOX), e.g., a common topoisomerase II inhibitor that is used to treat patients with different solid and hematological malignancies, can also cause cardiotoxicity2 and eventually congestive heart failure.3 Another major problem that can limit the effectiveness of cancer treatment is drug resistance. Drug resistance is related to numerous changes in the tumor and its microenvironment4 and can reflect both tumor and normal tissue.5 An approach to reduce side effects and drug resistance is the usage of prodrugs. Prodrugs are chemically modified, preferably nontoxic, versions of the active anticancer agent. Upon entrance into cancer cells the prodrug can be activated whereupon the active cytostatic molecule is released. Activation is typically catalyzed by an enzyme that is highly abundant in cancer cells, leading to predominant high concentrations in tumor cells while sparing normal cells.6 A suggested enzyme family to be targeted to activate prodrugs in cancer cells is glutathione transferases (GSTs).7–15 The GSTs are often highly overexpressed in tumors and frequently correlated to drug resistance and bad prognosis.16,17 GSTs are divided into three different groups, cytosolic, mitochondrial, and microsomal GSTs, each containing various isoforms. These isoforms have specific as well as overlapping substrate specificities in catalyzing conjugation, reduction, and isomerization reactions, thereby contributing to cellular protection against chemical insult, oxidative stress, and lipid peroxidation. Furthermore, GSTs are suggested to have essential functions in cell signaling. 12,15,18–20
In an attempt to take advantage of the overexpression of GSTs in different tumors we previously presented a new strategy using two different forms of prodrugs that can be activated and thereby release DOX in GST overexpressing cells. We showed that these prodrugs, 4-mononitrobenzenesulfonyl doxorubicin (MNS–DOX) and 2,4-dinitrobenzenesulfonyl doxorubicin (DNS–DOX), could be activated by two different GSTs, microsomal glutathione transferase 1 (MGST1) and glutathione transferase pi (GSTP). MGST1, which is located in the ER membrane, and the outer membrane of mitochondria as well as the cytosolic GSTP are often overexpressed, connected to drug resistance and correlated to bad prognosis in many different cancers. Our study showed that the prodrugs tested were more toxic to GST overexpressing cells compared to control cells, indicating that the GSTs tested could activate the prodrugs and release DOX.8
To follow up on these findings we herein expanded our efforts to glutathione transferase alpha 1 (GSTA1) and included the newly synthesized DOX derivative 4-acetyl-2-nitro DOX (ANS–DOX) in the study (Figure 1). GSTA1 is expressed in most cells at moderate levels and has been shown to possess both GST and glutathione peroxidase activity protecting against oxidative stress.15 However, GSTA1 has also been shown to be overexpressed in various cancers such as colon cancer,21 lung cancer,22,23 exfoliated human bladder cancer,24 and clear cell renal cell carcinoma25 and is connected to nitrogen mustard and Bleomycin resistance.26,27 Over-expression was furthermore found to support proliferation of cells in benign adrenocortical adenomas from patients with Cushing's syndrome.28 In contrast to MGST1 and GSTP1, GSTA1 overexpression was not associated with a major resistance to doxorubicin,29,30 thus potentially being a more effective enzyme to target for these prodrugs.
Figure 1.
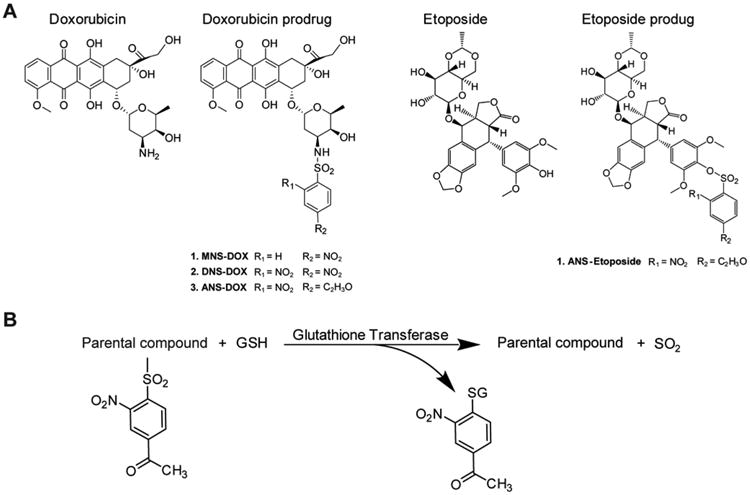
Chemical structures and conversion of prodrugs. (A) Chemical structures of DOX and etoposide as well as the prodrugs MNS–DOX, DNS-DOX, ANS–OX, and ANS–etoposide are depicted. (B) Conversion of the prodrug yields a free doxorubicin/etoposide, sulfur dioxide and an acetylmononitro/dinitro benzene moiety conjugated to GSH. These prodrugs are hypothesized to enter the cell via a passive diffusion. In the cell, GSTs are able to activate the prodrugs via their sulfonamidase and sulfonamide cleavage activity.
Furthermore, the prodrug concept may include additional functional facets contributing to its cytotoxic profile, which we wished to address within this study. An efficient accumulation and activation within the cancer cell, for example, might lead to GSH depletion, which in turn sensitizes the cells to the activated drug or induces oxidative stress as a concomitant factor. Additionally, intracellular nucleophiles other than GSH might be efficiently targeted due to the electrophilic nature of the sulfonamide bond in the prodrugs. A prime candidate is the selenoprotein thioredoxin reductase 1 (TrxR1), which is the central enzyme of the redox regulatory and antioxidant thioredoxin (Trx) system. It is often upregulated in cancers and has been identified as a promising target for anticancer therapy.31 Due to an accessible and highly reactive Sec-residue within its active site, it is considered to be a target of many electrophilic compounds with TrxR1 inhibition being linked to cancer cell death.32 Reducing the antioxidant capacity of cancer cells through targeting of the Trx and GSH systems simultaneously has previously been suggested as a principle of anticancer therapy and might thus be synergistic factors contributing to prodrug induced toxicity.33–35
In addition, we investigated whether etoposide could be converted into a novel prodrug using a similar strategy as for DOX. The parental compound etoposide is used as a cytostatic drug for the treatment of Ewing's sarcomas, lung cancer, lymphomas, and, in addition, in combination with carboplatin to treat primary brain tumors such as glioblastomas.36–40 Etoposide can act against topoisomerase II and thereby influence the chromosome segregation and replication in the exposed cancer cell resulting in apoptosis.40–41 A major problem with etoposide is that it can induce major side effects such as bone marrow suppression, fatigue, skin rash, diarrhea, severe delayed toxicity, and even leukemia. It is therefore an attractive candidate for the development of prodrugs to potentially reduce these side effects.42,43
In this study we show that GSTs are a suitable enzyme class for the development of novel prodrugs and that different GSTs can be targeted selectively. Specifically, we synthesized and characterized a new derivative of DOX, ANS–DOX as substrate for various GST, and studied its potential as prodrug in both GSTA1 and MGST1 overexpressing cells. Additionally, we show that the working mechanism of prodrugs involves a reduction of the GSH levels as a consequence of activation, as well as disruption of redox regulatory pathways via TrxR1 inhibition, which might synergize with the mechanism of the activated drug and augment toxicity toward cancer cells. We also ascertained whether etoposide is a suitable candidate for the development of novel prodrugs by characterizing the etoposide based prodrug, 4-acetyl-2-nitro-benzenesulfonyl etoposide (ANS–etoposide), in the same cellular systems. In summary, our data show that the GST catalyzed conversion rate can be precisely manipulated by adjusting the reactivity of the prodrugs; this is also shown to be important for both GST specificity and cell killing potential. Additionally, we suggest that prodrugs may overcome multiple drug resistance mechanisms and that they can target redox pathways, particularly those regulated via TrxR1, thus potentially targeting cancer cells that are resistant to the parental drug.
Materials and Methods
Chemicals and Growth Media
Cell culture media and additives, including Dulbecco's modified Eagle's medium (DMEM), Fetal Bovine Serum (FBS), Geneticin (G418), Phosphate-Buffered Saline (PBS), and penicilin-streptomycin were obtained from GIBCO. Hygromycin B was obtained from Invitrogen. 1-Chloro-2,4-dinitrobenzene (CDNB), reduced glutathione, and doxorubicin were purchased from Sigma-Aldrich, whereas etoposide was purchased from Vepesid, Bristol-Myers. Coommassie Plus protein assay was purchased from Thermo Scientific. Horseradish peroxidase labeled goat antirabbit IgG was obtained from DakoCytomation. Other reagents for SDS-polyacrylamide gel electrophoresis and Western blot analysis were obtained from Sigma-Aldrich. Development of the blots was done by the usages of Amersham EL Western blotting reagents obtained from GE healthcare. Additionally, 3-(4,5-dimethylthiazol-2-yl)-2,5-diphenyltetrazolium bromide (MTT) and crystal violet were purchased from Sigma-Aldrich.
Synthesis of the Prodrugs
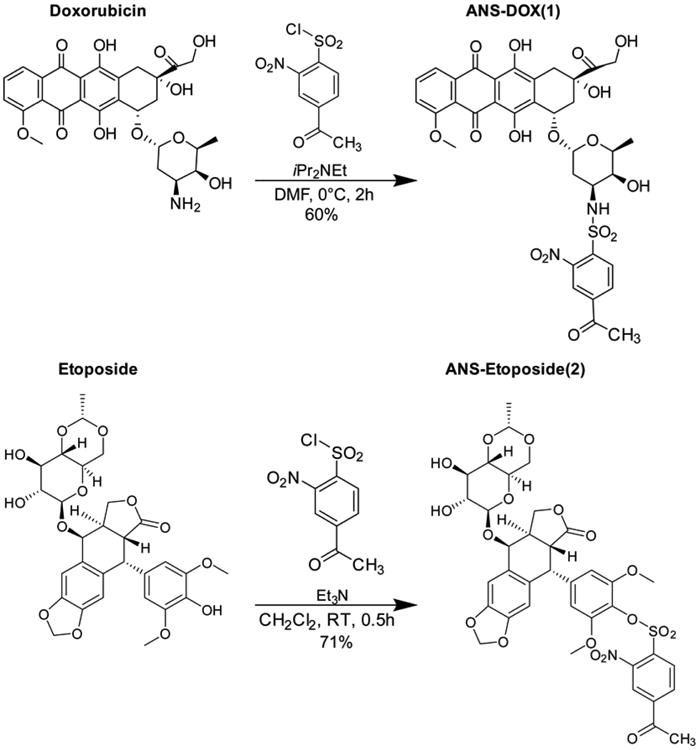
Prodrugs were synthesized as depicted in Scheme 1 for ANS-DOX (upper panel) and ANS– etoposide (lower panel). DNS–DOX was synthesized as previously described by Johansson et al.8 Emission spectra were obtained using an EnSpire 2300 Multilabel Reader (PerkinElmer). All spectra were measured in a 96-well optical bottom plate (Fisher Scientific, #265301) with 10 μM DOX, ANS–DOX, and DNS–DOX in a 200 μL volume. Measurements were taken at room temperature in 0.1 M potassium phosphate buffer pH 6.5. Excitation wavelength was 480 nm, and emission was recorded between 500 and 700 nm.
Scheme 1. Synthesis of ANS–DOX (1) and ANS–Etoposide (2); See Materials and Methods for Details.
Synthesis of ANS-DOX (1)
N,N-Diisopropylethylamine (60 μL, 340 μmol) was added to a solution of doxorubicin hydrochloride (15 mg, 26 μmol) in dimethylformamide (520 μL) at 0 °C. 4-Acetyl-2-nitrobenzenesulfonyl chloride (15 mg, 58 μmol) was added to the reaction mixture. After stirring for 2 h, the reaction mixture was diluted with CHCl3 and washed with saturated NaHCO3(aq). The organic layer was dried over Na2SO4 and evaporated in vacuo. The residue was purified by a neutral flash silica gel column chromatography and eluted with CHCl3–acetone (3:1, v/v) to give the desired ANS–DOX (12 mg, 16 μmol, 60%). 1H NMR (500 MHz, DMSO-d6): δ 8.26 (1H, s, AcNs), 8.16 (1H, d, dox, J = 1.8 Hz), 8.14 (1H, d, dox, J = 1.8 Hz), 8.11–8.10 (1H, d, AcNs, J = 8.0 Hz), 8.10–8.08 (1H, d, AcNs, J = 8.0 Hz), 7.86–7.80 (2H, m, dox), 7.59–7.58 (1H. d, dox, J = 8.6 Hz), 5.38 (1H, s, dox), 5.15 (1H, s, dox), 4.82-4.83 (1H, t, dox), 4.55 (2H, s, dox), 4.11–4.07 (1H, d-d, dox, J = 6.9, 6.3 Hz), 3.96 (3H, s, dox), 3.62-3.57 (1H, d-q, dox, J = 4.5, 4.5, 5.1, 4.0 Hz), 3.50 (1H, s, dox), 2.90–2.89 (2H, d, dox, J = 6.3 Hz), 2.47 (1H, s, dox), 2.12-2.07 (2H, m, dox), 1.93-1.87 (1H, s-t, dox, J = 4.6, 3.4, 4.6 Hz), 1.40–1.37 (1H, d-d, J = 5.1, 5.1 Hz), 1.21 (3H, s, AcNs), 1.09–1.08 (3H, d, dox, J = 5.7 Hz), 1.17-1.16 (1H, t, dox). 13C NMR (125 MHz, DMSO-d6): δ214.21, 195.984, 186.90, 186.85, 161.25, 156.56, 154.86, 147.94, 140.73, 137.79, 135.84, 135.07, 134.56, 131.96, 130.54, 124.26, 120.40, 119.45, 111.15, 111.09, 100.33, 79.71, 75.41, 70.47, 69.39, 67.19, 64.16, 57.07, 56.36, 50.82, 32.66, 32.61, 30.13, 27.37, 17.46. LRMS (ESI) m/z: [M – H–] calcd for C35H34N2O16S, 770.16; found, 769.04.
Synthesis of ANS-Etoposide (2)
Etoposide (10 mg, 17 μmol) was dissolved in CH2Cl2 (200 μL). To the solution was added Et3N (3 μL, 34 μmol) and 4-acetyl-2-nitrobenzenesul-fonyl chloride (5 mg, 19 μmol), and the mixture was stirred at room temperature for 30 min. The mixture was purified by preparative layer chromatography eluted with EtOAc/toluene (3:1, v/v) to give the desired ANS–etoposide (10 mg, 12 μmol, 71%). 1H NMR (300 MHz, CDCl3): δ 8.38 (1H, s), 8.22 (1H, s), 6.85 (1H, s), 6.53 (1H, s), 6.24 (2H, s), 6.03-6.00 (2H, dd, J = 0.98, 7.81), 4.93 (1H, d, J = 3.42), 4.77 (1H, q, J = 4.88), 4.66 (2H, dd, J = 7.32, 11.23), 4.44 (1H, t, J = 9.23), 4.29 (1H, t, J = 8.30), 4.21 (1H, dd, J = 3.91, 11.23), 3.72–3.27 (12H, m), 2.85–2.82 (6H, m), 1.41 (3H, d, J = 5.37). 13C NMR (75 MHz, CDCl3); δ 194.5, 174.7, 152.2, 148.9, 148.4, 147.5, 141.2, 139.8, 135.1, 131.7, 130.9, 128.5, 127.2, 124.1, 123.9, 110.6, 109.1, 107.6, 101.8, 79.7, 74.5, 73.1, 68.0, 66.4, 56.0, 41.1, 37.5, 26.9, 20.2. LRMS (ESI) m/z: [M + Na+] calcd for C37H37NNaO18S+, 838.16; found, 838.47.
Activation of Prodrugs
The conversion of DNS–DOX and ANS–DOX to DOX was measured using a Shimadzu RF 510L fluorescent spectrophotometer from Analytical Instruments Division, Kyoto Japan, using an excitation at 480 nm and emission at 550 nm. The enzymatic activation of ANS-DOX (10 μM) or DNS–DOX (10 μM) to DOX by GSTA1 and GSTP1 (kind gift from B. Mannervik, Stockholm University) was determined in 0.1 M potassium phosphate buffer (pH 6.5) with 5 mM GSH. For MGST1, 0.1 M potassium phosphate buffer pH 6.5 containing 0.1% Triton X-100 and 5 mM GSH was used. A standard curve of 0.025, 0.05, 0.1, 0.25, 0.5, 0.1, and 2.5 μM DOX was constructed to convert the increase in fluorescence to a metabolic rate. All measurements were taken in triplicate.
Measurement of GST Activity with CDNB
The specific activity of all purified enzymes was measured in a 100 μL cuvette with a Cary 60 UV–visible spectrophotometer (Agilent Technologies, Santa Clara, USA) by following the change in absorbance at 340 nm. For MGST1, 5 mM GSH (Sigma-Aldrich, St. Louis, MO) and 0.5 mM CDNB (Merck, Darmstadt, Germany) as second substrate were used, respectively, in 0.1 M potassium phosphate buffer pH 6.5 containing 0.1% Triton X-100. The molar extinction coefficient used for CDNB conjugation was 9.6 mM–1 cm–1.44 GSTA1 and GSTP1 were measured with 1 mM GSH and 1 mM CDNB in 0.1 M potassium phosphate buffer pH 6.5 at 30 °C. The change in absorbance, after correction for the nonenzymatic reaction, was used to calculate the concentration of the active enzyme based on previously published values. All measurements were taken in triplicate, and slopes were fitted using the Cary WinUV software package (Agilent Technologies, Santa Clara, USA).
Cell Lines and Cell Culture
To study the involvement of MGST1 in drug resistance, the MCF7 cells (human mammary adenocarcinoma) were used. The cells were either transfected with a vector overexpression rat MGST1 or a control vector expressing an antisense sequence against rat MGST1, as described previously.7 To study GSTA1, V79 cells (Chinese hamster lung fibroblasts) were used. These cells were stably transfected with a vector overexpressing GSTA1, and the activity of these was compared with cells expressing control vectors. The GSTA1 containing pCEP4GSTA1 vector is based on the mammalian expression vector pCEP4 (Invitrogen, Inc.) and was used to transfect the V79MZ clone of the V79 cells using a FuGENE6 reagent. The construction of these cells was previously described in Sundberg et al.45 These cell lines were cultured in DMEM, supplemented with 10% fetal bovine serum (FBS), 100 U/mL penicillin–100 μg/mL streptomycin (PEST), and 1 mM sodium pyruvate. Additionally 1 mg/mL Geneticin (G418) or 100 μg/mL hygromycin was added for selection for the MCF7 or V79 cells, respectively. Targeting of TrxR1 by the prodrugs was studied in V79 and GSTA1 overexpressing V79 cells as well as in HEK293 cells (human embryonic kidney). HEK293 cells were cultured in EMEM (Eagle's Minimum Essential Medium, ATCC no. 30-2003). Growth media was supplemented with 10% FBS, PEST, and 25 nM sodium selenite. All cells used in this study were cultured in a humidified environment at 37 °C and with a 5% CO2 level.
Protein Determination and Western Blotting (WB)
Cells were cultured in a T-75 cm2 bottles. When the cells reached 70% confluence, they were washed with 1× PBS, trypsinized, and resuspended in culture media. The cells were centrifuged for 5 min at 2000 rpm, and the formed pellet was resuspended in lysis buffer (0.1 M potassium phosphate buffer pH 7.5 containing 1% Triton X-100 and 1% SDS). The samples were kept on ice during the whole procedure. The cell suspension was transferred into a 1.5 mL Eppendorf tube. Subsequently, the sonication was performed using the Soniprep 150 MSE, the duration of 10 s, for 3 times at 6 A on ice. The protein determination was performed by using the Coomassie Plus protein assay by Thermo Scientific, Rockford, USA. Twenty micrograms of protein was loaded on a 15% SDS polyacrylamide gel in a WB system. After running the protein separation, the proteins were transferred to a nitrocellulose membrane, after which they are labeled using a polyclonal rabbit IgG against rat MGST1, which was generated in-house (R. Morgenstern), or against human GSTA1 (1:1000) (Fine chemicals AB Malmo, Sweden), as the primary antibody. As secondary antibody, horseradish peroxidase labeled goat antirabbit IgG obtained from DakoCytomation, Glostrup, Denmark, was used. The blots were developed by using Amersham EL Western blotting reagents obtained from GE Healthcare, Buckinghamhire, UK.
GST Activity in Isolated Microsomes and Total Cell Lysate
MGST1 activity was determined in isolated micro-somes. The microsomes were prepared by centrifuging the cells at 2000 rpm for 5 min and resuspended in distilled water containing 0.25 M sucrose and sonicated for 2 × 10 s at 4 A on ice. This suspension was further centrifuged for 10 min at 3000 rpm, followed by transferring the supernatant into a new Eppendorf tube. A mixture of 0.8 M CaCl2 and 0.5 M MgCl2 (1:1 Mg–Ca) was added and incubated for 10 min. The samples were then centrifuged for 10 min at 7000 rpm, after which the cytosolic fraction in the supernatant was removed. The pellet, containing the microsomes was resuspended in 0.15 M Tris-HCl buffer (pH 8, containing 1 mM EDTA) and an additional 20 μL Mg–Ca mixture was added. Subsequently the samples were centrifuged for 10 min at 13000 rpm, and the pellet was resuspended in 0.25 M sucrose (in distilled water containing 1 mM EDTA, pH 7.5). The samples were kept on ice during the complete procedure. All centrifugation steps were performed at 4 °C.
The activity of GSTA1 was measured in total cell lysate from GSTA1 overexpressing V79 cells. The cells were centrifuged at 2000 rpm for 5 min, and the cell suspension was transferred into a 1.5 mL Eppendorf tube. The cell lysate from the V79 cells was obtained by the usage of a lysis buffer containing 0.1 M potassium phosphate buffer (pH 6.5) with 1% Triton X-100. After which, the sonication was performed using the Soniprep 150 MSE for the duration of 10 s, for 3 times at 6 A on ice. The samples were kept on ice during the complete procedure. Afterward, the protein determination was performed by using the Coomassie Plus protein assay by Thermo Scientific, Rockford, USA.
The enzymatic GST activity of isolated microsomes and total cell lysate was determined in 0.1 M potassium phosphate buffer pH 6.5 containing 0.1% Triton X-100 and 5 mM GSH. As substrate, 0.5 mM CDNB was used, and the reaction was carried out at room temperature. Absorbance change, representing the product formation rate, was measured at a wavelength of 340 nm, using a single beam, Philips PU 8700 UV/visible spectrophotometer (Philips Scientific and Analytical Equipment, Cambridge, UK). All the enzymatic activities were corrected for the nonenzymatic reaction.
Short-Term Toxicity Test
To measure the short-term (24 h) cytotoxicity of the prodrugs in the cell lines, a MTT ((3-(4,5-dimethylthiazol-2-yl)-2,5-diphenyltetrazolium bromide)) test was used as previously described.7,46 Briefly, the cells were seeded at a density of 1 × 10⁴ cells/well for the MCF7 cells and 2 × 10⁴ cells/well for V79 cell in a 96-well plate. After 1 day, the cells were exposed to DOX, DNS–DOX, ANS– DOX, etoposide, ANS–etoposide, or vehicle (DMSO) for 24 h at various concentrations in DMEM without phenol red. After 24 h the media was removed, and the cells were incubated in 0.5 mg/mL MTT for 4 h at 37 °C. The formazan crystals formed were dissolved in DMSO. The absorbance was measured with a spectrophotometer at 590 nm minus reference at 650 nm.8
Long-Term Toxicity Test
The colony forming efficiency (CFE) assay was used as a long-term (7 days) toxicity test to determine the MGST1 overexpressing cells ability to form colonies after the exposure to the toxic agents.47 The control cells and the MGST1 overexpressing MCF7 cells were seeded in a 6-well plate, with a density of 2000 cells per well. Twenty-four hours after seeding, the cells were exposed to DOX or ANS-DOX in serum-free DMEM (SFM) for 3 h at different concentrations. After the incubation period the SFM was changed to complete medium and refreshed at day 3. After 7 days the media was removed and cells were washed with PBS and analyzed with the CFE test. The cells were fixated with 10% formaldehyde for 20 min and stained with 0.01% crystal violet for 5 min. Colonies were counted using a light-microscope (a colony ≥ 16 cells). Since the GSTA1 overexpression V79 cells do not form proper colonies we used the MTT test to monitor the long-term effects of the drugs on these cells. These MTT tests were performed in the following manner: 200 cells per well were seeded on day 0 in complete medium in a 96-well plate; subsequently, on day 2 the cells were exposed to DOX or ANS–DOX, in SFM for 3 h at different concentrations. Whereupon the medium was changed to complete medium, and the MTT assay was performed on day 7 as described above.
Analysis of the Uptake and Activation of ANS–DOX in GSTA1 Overexpressing Cells
The vector control cells and GSTA1 overexpressing cells were seeded in 96-well plates. After 24 h the cells were exposed to either 20 μM DOX or ANS– DOX for 15, 30, 60, and 120 min. After the exposure cells were incubated with 40 ng/mL Hoechst for 30 min to stain the nuclei and subsequently fixated in 2% ice-cold paraformalde-hyde for 10 min in RT. The wells were covered with PBS, and fluorescence was measured using the Operetta High Content Imaging System. For cell quantification, seven fields of view for each cell culture well, covering edges and center, were recorded in bright field and two channels for fluorescence detection of DOX (excitation, 500 nm; emission, 595 nm) and Hoechst (excitation, 380 nm; emission, 445 nm). The excitation and exposure times were fixed for each channel, with all samples analyzed with the same settings. Determinations of fluorescence signals were subsequently performed using the Columbus (PerkinElmer) and Excel (Microsoft) computer programs.
Activation of DNA Damage Signaling
The activation of DNA damage signaling in cells exposed to ANS–DOX and DOX was investigated by WB. GSTA1 overexpressing and control cells were exposed to either 0.2 μM DOX or 2 μM ANS–DOX for different time periods or for 3 h with the different concentrations. After incubation with the drugs at indicated time-points or concentrations, the cells were washed with PBS and lysed in 0.1 M potassium phosphate buffer pH 7.5 containing 1% Triton X-100, 1% SDS, and phosphatase and protease inhibitors from Roche. Protein samples were run on a 12% SDS polyacrylamide gel in a WB system. The proteins were then transferred to a nitrocellulose membrane. For the primary antibodies phospho-histone H2AX (Ser139) antibody 1:500 (Cell Signaling), phospho-p53 (Ser15) antibody 1:1000 (Cell signaling), and Cdk2 (M2) (Santa Cruz) antibody as loading control 1:1000 were used. As a secondary antibody the horseradish peroxidase labeled goat antirabbit IgG (DakoCy-tomation) was used. Development of the blots was done via using Amersham EL Western blotting reagents (GE Healthcare).
Comet Assay
The levels of DNA damage were measured after 3 h exposure to either ANS-DOX (1 and 5 μM) or DOX (0.02 and 0.1 μM). The alkaline version of the comet assay was performed as described previously by Jarvis et al.48 At least 50 comets were scored per treatment performed in triplicates using a Leica DMLB fluorescent microscope and Comet Assay 3 (Perceptive Instruments Ltd., Haverhill, UK).
GSH Measurements and Sensitization to DOX upon GSH Reduction by BSO
GSTA1 overexpressing V79 cells were seeded in a 6-well plate the day before exposure to either 5 μM ANS–DOX or DNS–DOX. After 2 or 6 h, respectively, cells were washed with PBS and incubated on ice for 30 min with KPE lysis buffer (containing 0.1 M potassium phosphate buffer pH 7.5, 11.2 mM EDTA, and 1% Triton X-100). Cells were scraped and centrifuged at 14000 rpm for 10 min at 4 °C. Sulfosalicylic acid (1.3%) was added, and samples were stored at –80 °C until further usage. GSH content was determined as previously described by Rahman et al.49 Protein concentrations were determined by using the Bradford assay (BioRad).
To study DOX sensitization upon a reduction in GSH levels, V79 control cells were seeded at a density of 2.5 × 10³ cells/well in a 96-well plate and allowed to attach overnight. Subsequently, cells were exposed to 250 μM BSO (DL-buthionine-sulfoximine, Sigma-Aldrich) to reduce the GSH content. After 24 h medium was replaced with DOX containing medium and incubated for another 24 h at 37 °C, 5% CO2. The medium was removed and a MTT assay was performed as described previously.8
In Vitro Characterization of TrxR1 Inhibition
Rat TrxR1 and human Trx1 were recombinantly produced and purified essentially as described previously.50,51 TrxR1 activity was measured in TE buffer (50 mM Tris, pH 7.5, 2 mM EDTA) using 250 μM NADPH as well as either wild-type Trx1/insulin or juglone (5-OH-1,4-naphthoquinone) as substrates. In contrast to the Trx1 coupled reduction of insulin, which requires an intact Sec-residue in the C-terminal active site, redox-cycling with juglone is essentially Sec-independent but requires an intact N-terminal active site. The behavior of the enzyme, when targeted by an inhibitor, toward both substrates can be used to indicate whether an inhibitor preferentially targets the Sec-residue, while leaving the rest of the enzyme essentially intact.52–54 To assess C-terminal Sec-dependent activity of TrxR1, 20 nM recombinant enzyme was incubated with either 10 μM DNS–DOX or ANS–DOX for 10 min at room temperature in the presence or absence of 250 μM NADPH. Subsequently, 10 μM wild-type Trx1 and 160 μM insulin (and 250 μM NADPH to the samples where it is not present) were added, and the reaction was followed by measuring NADPH consumption via a change in absorbance at 340 nm. Sec-independent activity was studied by incubating 20 nM of recombinant TrxR1 with either 10 μM DNS–DOX or ANS–DOX for 10 min at room temperature in the presence of 250 μM NADPH, upon which 40 μM juglone was added and the reaction was followed at 340 nm. To study whether the products of the converted prodrugs (free doxorubicin, sulfur dioxide, or the acetylmononitro/dinitro benzene moiety conjugated to GSH, see Figure 1) can target TrxR1, 10 μM DNS–DOX was incubated with 5 mM GSH and 50 nM GSTA1 for 30 min. Subsequently, 20 nM TrxR1 and 250 μM NADPH were added, and the mixture was incubated for 10 more minutes. Finally, 10 μM wild-type Trx1 and 160 μM insulin were added, and the reaction was followed at 340 nm.
TrxR1 Activity in Cell Lysates
A total of 2 × 10⁶ HEK293, V79, or GSTA1 overexpressing V79 cells were seeded per dish (ø 10 cm). Approximately 48 h (HEK293 cells) or 24 h (V79 and GSTA1 overexpressing cells) after seeding, cells were exposed to the compounds as indicated for 3 h, harvested by trypsinization, and washed in cold PBS. The samples were centrifuged at 900g for 5 min, and the resulting cell pellet was resuspended in lysis buffer (50 mM Tris, pH 7.5, 2 mM EDTA, 1% Triton X-100, and phosphatase and protease inhibitors from Roche). After a 30 min incubation on ice, the cell extracts were cleared by centrifugation at 16,000g for 20 min. Protein concentrations of the supernatants were determined using the Bradford reagent (Bio-Rad). Cellular TrxR1 activity was subsequently determined using a modified version of the earlier described end-point insulin assay.55 Briefly, total cellular protein (20 μg for HEK293 cells or 15 μg for V79 and GSTA1 overexpressing cells) was incubated with 20 μM wild-type Trx1 in the presence of 160 μM insulin and 250 μM NADPH using TE buffer for 20 min at 37 °C in a total volume of 50 μL. Samples without additional Trx1 in the reaction buffer served as a background control. The reaction was stopped by addition of 200 μL of 6 M guanidine–HCl (Acros Organics) with 1 mM DTNB. Absorbance was measured at 412 nm in a 100 μL cuvette using a Cary 60 UV–visible spectrophotometer (Agilent Technologies, Santa Clara, USA). Data were plotted as percentage of untreated control after background subtraction.
Statistical Analysis
The cytotoxicity study data were analyzed by performing an F-test for equal variances, followed by a two-tailed student t test. The GST activity, Comet assay, and TrxR1 inhibition data were analyzed by using a two-tailed student t test. GraphPad prism software windows version 5.03 (GraphPad Software, 2009, California, USA) was employed in order to perform nonlinear regression analysis, and sequentially, curve comparisons were performed by using an extra sum F-test.
Results
MGST1, GSTP1, and GSTA1 Catalyzed Conversion of DNS–DOX and ANS–DOX to DOX
The modifications in DOX that yield ANS–DOX and DNS–DOX conveniently quench the fluorescence intensity of DOX 10- to 20-fold (Figure 2A). Taking advantage of the fluorescence increase upon conversion to the more fluorescent DOX by MGST1, GSTP1, and GSTA1, we measured the specific activity for each enzyme. Catalytic rates were in general agreement with previous results for DNS–DOX (Figure 2B).8 Oxidative activation of MGST1 or loss of activity of GSTP1 upon storage account for the differences observed. GSTA1, which was not yet tested with DNS–DOX, showed a very high turnover of 13780 ± 120 nmol/min/mg that by far exceeded the activity of MGST1 (463 ± 7 nmol/min/mg) and GSTP1 (18.7 ± 2 nmol/min/mg). Subsequently we measured the turnover of all enzymes with the DOX derivative ANS–DOX. Having a less electron withdrawing acetyl group, as is also reflected in the difference of the nonenzymatic conversion rates (Figure 2C), ANS–DOX showed 10 to 30 times lower conversion rates for all enzymes compared to DNS–DOX as expected.56 ANS–DOX was thus activated with a rate of 38.7 ± 0.2 nmol/min/mg by MGST1 and 493 ± 3 nmol/min/mg by GSTA1, whereas no activity could be measured for GSTP1 under the experimental conditions (Figure 2B). The presence of Triton X-100, furthermore, did not alter the ratio of nonenzymatic reactivity for the compounds drastically, suggesting that solubility and lipophilicity is not a major factor (Figure 2C). A conversion rate of the etoposide based prodrug ANS-etoposide by the purified enzymes was not determined as the molecule lacks fluorescence.
Figure 2.
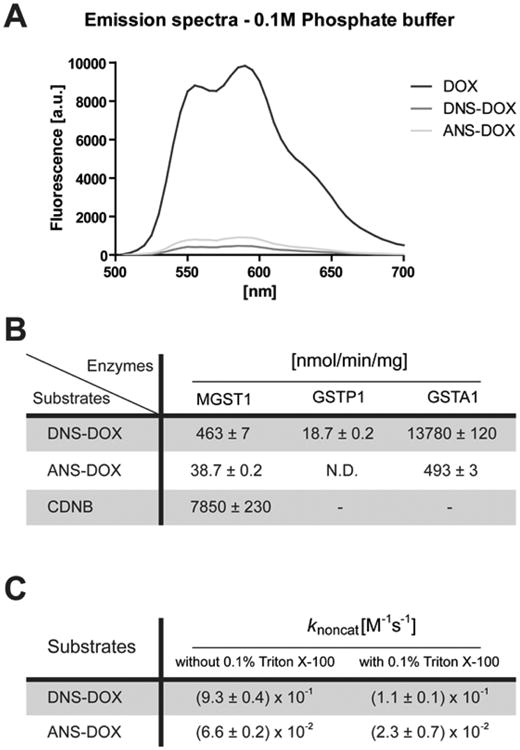
Emission spectra of DOX and its derivatives, second order rate constants for the nonenzymatic ANS–DOX and DNS–DOX conversion, and the catalyzed conversion of ANS–DOX, DNS–DOX, and CDNB by MGST1, GSTP1, and GSTA1. (A) Emission spectra of DOX (dark gray), DNS–DOX (medium gray), and ANS–DOX (light gray) in 0.1 M potassium phosphate buffer pH 6.5 using excitation at 480 nm. (B) Specific activities of MGST1, GSTP1, and GSTA1 were determined using 5 mM GSH and 10 μM ANS–DOX, 10 μM DNS–DOX, or 0.5 mM CDNB in 0.1 M potassium phosphate buffer pH 6.5 (without or with 0.1% Triton X-100 in the case of MGST1). The specific CDNB activities of GSTP1 and GSTA1 were compared to literature values to determine the amount of active enzyme in the preparations, which in turn was used to calculate the specific activity toward ANS–DOX and DNS–DOX. N.D., not detectable. Values are means ± SEM (n = 3). (C) Second-order rate constants for the nonenzymatic reaction (knoncat) were obtained in 0.1 M potassium phosphate buffer pH 6.5 (without or with 0.1% Triton X-100), using 5 mM GSH as well as 10 μM ANS–DOX or DNS–DOX, respectively. Values are means ± SEM (n = 3).
GSTA1 Overexpression Amplifies ANS–DOX Induced Toxicity but Has No Effect on DOX and DNS–DOX Toxicity
Based on our finding that purified GSTA1 catalyzed the conversion of DNS–DOX much more efficiently (30-fold) than MGST1 (see Figure 2B), we studied the effect of this DOX derivative and pure DOX in GSTA1 overexpressing cells. Overexpression was confirmed by WB and activity measurements (Figure 3A). Using a short-term (24 h; MTT) as well as long-term (7 days) viability test, no difference in DOX toxicity could be seen between V79 control and GSTA1 overexpressing cells (Figure 3B). The same behavior was surprisingly observed when exposing cells to DNS–DOX, which showed no GSTA1-dependent toxicity in a short-term viability test (24 h; MTT) despite its high catalytic efficiency (13780 ± 120 nmol/min/mg) (Figure 3C). In contrast, the less reactive ANS–DOX variant (493 ± 2 nmol/min/mg) induced toxicity to a significantly greater extent in GSTA1 overexpressing compared to control cells in short-term (24 h; MTT) as well as long-term viability test (7 days) (Figure 3D).
Figure 3.
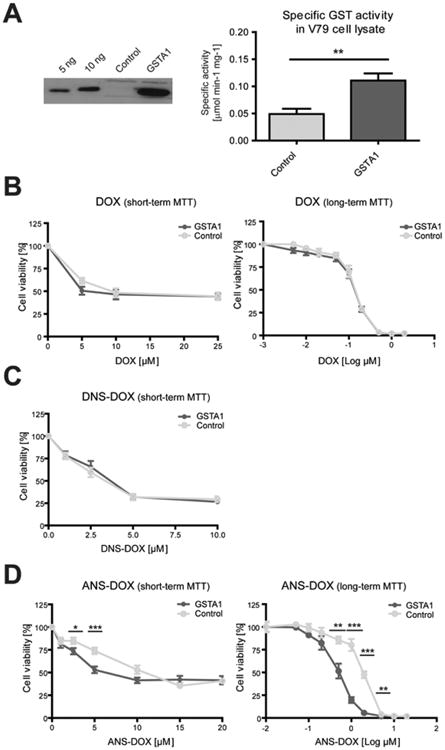
Characterization of GSTA1 overexpressing cell lines and their response to DOX, DNS–DOX, and ANS–DOX treatment. (A) Left panel: Western blot of GSTA1. Lanes 1–2: purified human GSTA1; 5 and 10 ng. Lane 3: vector control cell line. Lane 4: GSTA1 overexpressing cell line. Right panel: Specific GST activity in cell extracts from GSTA1 overexpressing and control V79 cells. Activity was measured using 0.5 mM CDNB and 5 mM GSH. Values are means ± SEM (n = 3; **P ≤ 0.01). Cellular toxicity of (B) DOX (log(–3) μM corresponds to 0 μM DOX treatment), (C) DNS– DOX, and (D) ANS–DOX for short-term (24 h) or long-term toxicity assay (7 days) with indicated doses determined with MTT assay. GSTA1 overexpressing V79 cells (dark gray/GSTA1) and the vector control (light gray/control). Data are from at least three independent experiments done in triplicates (n ≥ 9) (means ± SE) *P ≤ 0.05, **P ≤ 0.01, and ***P ≤ 0.001). Log(–2) μM corresponds to 0 μM DOX treatment. Curve comparison long-term toxicity assay: DOX (p = 0.42); ANS–DOX (p < 0.0001).
Uptake, Conversion, and DNA-Damage in GSTA1 Overexpression Cells after ANS–DOX Exposure
In order to further investigate whether ANS–DOX is converted to DOX in a GSTA1-dependent manner within the cells we exposed GSTA1 overexpressing and control V79 cells to ANS-DOX as well as DOX and measured the final cellular DOX content at various time points. For this we exploited that the conversion of ANS–DOX yields more fluorescent DOX, which was detected using the Operetta High content imaging system. Using DOX as a control we could see a similar steady and rapid increase in cellular levels in both control cells and GSTA1 overexpressing cells (Figure 4A). This further indicates that a cellular uptake of DOX (and also ANS–DOX) does not depend on the expression level of GSTA1, but that the different toxicity profiles are indeed dependent on GSTA1 catalysis. Exposing cells to ANS–DOX we could clearly see an GSTA1 and time-dependent increase in nuclear DOX fluorescence showing that ANS–DOX is intracellularly converted to DOX by GSTA1 (Figure 4A). Visualizing single cells, it becomes clear that the control cells at early time points show a predominantly low cytosolic fluorescence (indicative of uncleaved prodrug) with nearly no nuclear DOX, whereas the GSTA1 over-expressing cells display a very strong nuclear DOX fluorescence (Figure 4B; compare merge control and GSTA1 over-expression). A similar pattern could be seen with MGST1 overexpressing cells (data not shown), but to a much lower extent, as expected, since GSTA1 has a much higher ANS–DOX conversion rate compared to MGST1 (Figure 2B).
Figure 4.
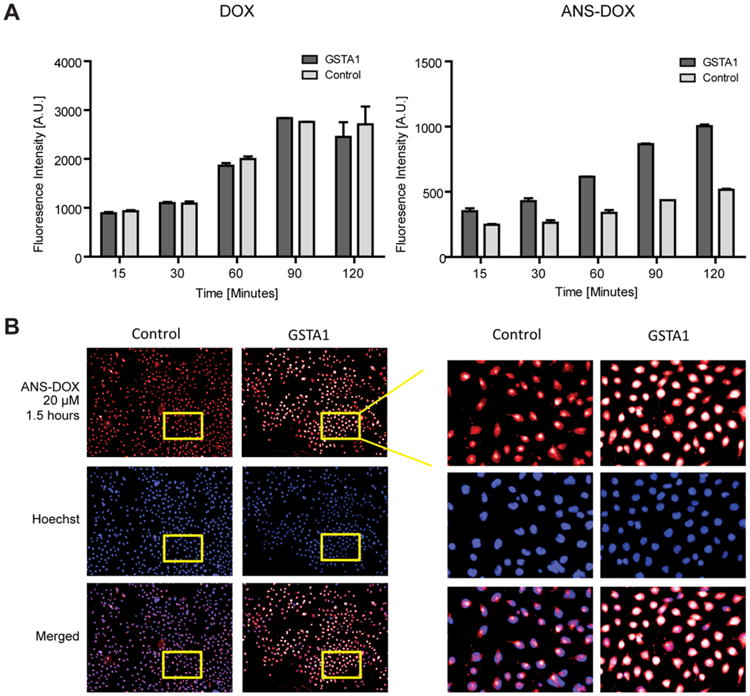
Cellular uptake of DOX and ANS–DOX in GSTA1 overexpressing cells. (A) Representative figure of fluorescent intensity of DOX in the nuclei of cells treated with either 20 μM DOX or 20 μM ANS–DOX for the indicated time periods in GSTA1 overexpressing (dark gray) and vector control (light gray) cells (n = 3; mean ± SEM). (B) Representative fluorescence microscopy pictures of GSTA1 overexpression and V79 control cells, treated with 20 μM ANS–DOX for 120 min. Upper panel: DOX fluorescence. Middle panel: Hoechst staining of the nucleus. Lower panel: Merge images.
DNA Damage in GSTA1 Overexpression Cells after ANS–DOX Exposure
Looking at DNA damage we noted that GSTA1 overexpression protected the cells somewhat from DOX induced DNA damage in a time-dependent manner when compared to the control cells as seen by expression of the DNA damage markers p-Histon-H2AX and p-p53. This effect could not be seen with ANS–DOX treatment, where control as well as GSTA1 overexpression cells showed significant induction of DNA damage markers (Figure 5A, left panel). Notable, the GSTA1-dependent protection seems to somewhat disappear at higher concentration of DOX (Figure 5A, right panel). This furthermore goes in line with the alkaline comet assay (Figure 5B, right panel), confirming that the cells having GSTA1 overexpression displayed less DNA damage compared to control cells at 0.2 μM DOX, but not at 0.1 μM DOX treatment. GSTA1 has potentially a small protective effect toward DOX, which, however, disappears at higher concentrations where GSTA1 might be overwhelmed. By exposing GSTA1 overexpression cells to ANS–DOX, on the other hand, higher levels of DNA damage were observed compared to control cells (Figure 5B) in line with the cell viability assays (see Figure 3), the ANS–DOX to DOX conversion (see Figure 4), and also the DNA damage markers (see Figure 5A).
Figure 5.
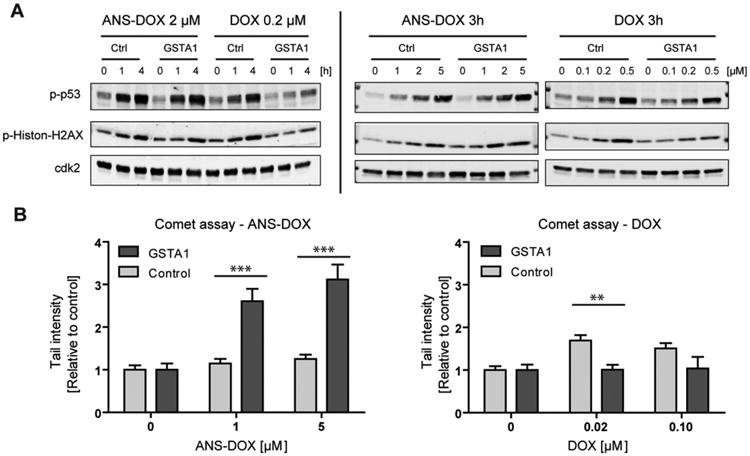
DNA damage in GSTA1 overexpressing cells after ANS–DOX and DOX exposure.(A) Activation of DNA damage signaling was assessed by phosphorylation of p53 at Ser15 and Histon-γH2AX at Ser139 using Western blot. Cdk2 was used as a loading control. GSTA1 overexpressing and vector control cells were treated with 0.2 μM DOX or 2 μM ANS–DOX for the indicated time periods or for 3 h with the indicated concentration. (B) DOX and ANS–DOX mediated DNA damage in GSTA1 overexpressing (light gray) and vector control cells (dark gray) were determined after a 3 h exposure by comet assay. Experiments were performed in triplicate, and data points represent means ± SEM **p < 0.01, ***p < 0.001 as compared with control levels by using a two-tailed student t test.
ANS–DOX Reverses the MGST1-Dependent Resistance against DOX
MGST1 was previously shown to promote resistance to DOX and to be a potential target in the activation of DOX based prodrugs, highlighting it as a suitable target to further validate ANS–DOX as a potential prodrug.8 For this we utilized control MCF7 cells, known to have low endogenous levels of GSTs and MCF7 cells engineered to overexpress MGST1 (Figure 6A).57 MCF7 cells are known to easily overexpress features associated with multidrug resistance, particularly using DOX as a model drug. Even if the cells used in this study were not especially adapted to generate a resistant phenotype, they still displayed high resistance to DOX, suggesting that they employ several mechanisms to counter DOX induced cell death.27,58–62 Resistance to DOX was furthermore significantly promoted by MGST1 overexpression compared to control cells, in agreement with previous studies.8,9 This protective effect was indeed observed in short-term (24 h) exposure studies. However, only marginal effects were found in long-term follow-up CFE experiments (7 days) (Figure 6B). Total reversal of MGST1-dependent resistance against DOX was shown in cells exposed to ANS–DOX even though no further toxicity was induced in MGST1 overexpressing cells compared to cells with low MGST1 (compare Figure 6B,C).
Figure 6.
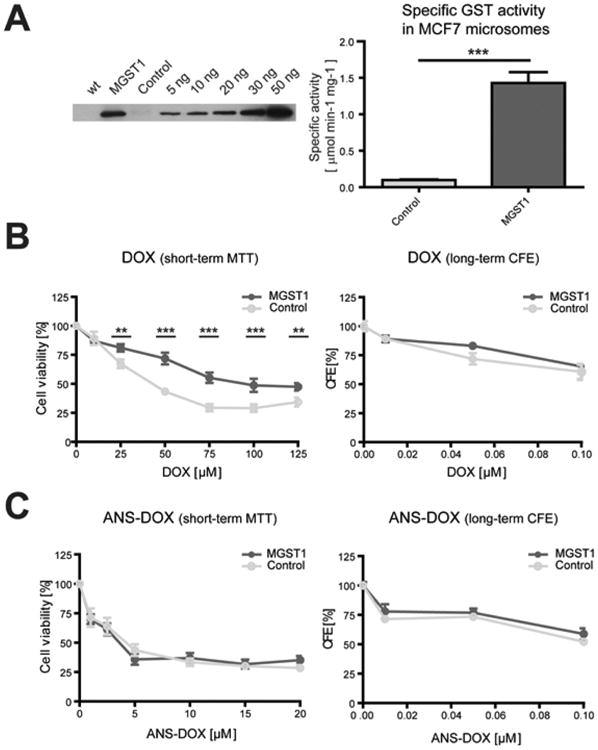
Characterization of MGST1 overexpressing cell lines and their response to DOX and ANS–DOX treatment. (A) Left panel: Western blot of MGST1. Lane 1: cell lysate of wildtype MCF7 cells. Lane 2: MCF7 cells overexpressing MGST1. Lane 3: MCF7 cells containing vector control. Lane 4 until lane 9: purified rat MGST1 enzyme; 5-50 ng. Right panel: Specific GST activity in isolated microsomes from MGST1 overexpressing and control MCF7 cells. Activity was measured using 0.5 mM CDNB and 5 mM GSH. Values are means ± SEM (n = 3; ***P ≤ 0.001). Cellular toxicity of (B) DOX or (C) ANS–DOX after 24 h analyzed with short-term MTT assay (left) or long-term colony forming efficiency (CFE) assay (right; 7 days) with indicated doses. Data are derived from at least three independent experiments done in triplicate (mean ± SEM, n ≥ 9, **P ≤ 0.01, ***P ≤ 0.001). CFE panels are representative data from one experiment measured in triplicate. MGST1 overexpressing MCF7 cells (dark gray/MGST1) and the vector control (light gray/control).
Prodrug ANS–Etoposide Could Overcome Etoposide-Dependent Resistance Shown in GSTA1 Overexpressing Cells
In addition to DOX and its derivatives we included etoposide and an etoposide based prodrug that was modified with a nitro acetyl-benzene moiety conjugated to the etoposide (ANS–etoposide) through a sulfonic acid ester linkage. In opposition to DOX treatment (see Figure 3B), cells over-expressing GSTA1 showed significant resistance against etoposide. The GSTA1-dependent resistance against etoposide was reversed when exposing cells to ANS–etoposide, suggesting that the prodrug acts either independently of GSTA1 or that the enzyme-dependent activation of the drug cancels out the protection warranted by GSTA1 overexpression (Figure 7A). It was previously noted that the V79 cells are generally more sensitive toward both DOX and etoposide than the MCF7 cells.63 That was shown also here with both etoposide and ANS–etoposide. However, MGST1 over-expression seemed to promote a weak ANS–etoposide induced toxicity compared to control cells and in relation to the parental etoposide (Figure 7B). Since etoposide is not fluorescent as DOX, no GST-dependent conversion rates could be obtained.
Figure 7.
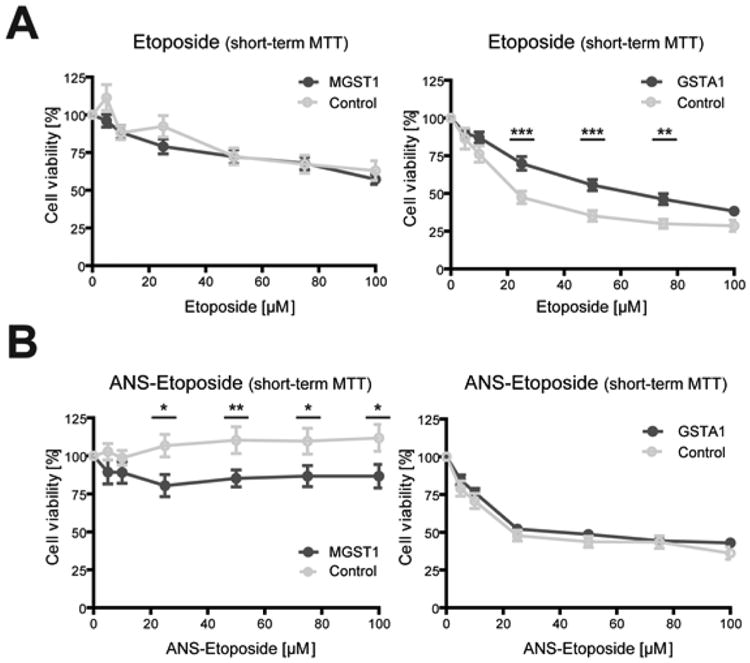
Etoposide and ANS-etoposide toxicity in GSTA1 and MGST1 overexpressing cells. Cellular toxicity of (A) etoposide and (B) ANS–etoposide analyzed with the MTT assay after short-term 24 h exposure with indicated doses, in at least three independent experiments measured in at least triplicate (mean ± SEM, n ≥ 9, *P ≤ 0.05, **P ≤ 0.01, and ***P ≤ 0.001). Left panel: MGST1 overexpressing MCF7 cells (dark gray/MGST1) and the vector control (light gray/control). Right panel: GSTA1 overexpressing V79 cells (dark gray/GSTA1) and the vector control (light gray/control).
Reduction of GSH Levels through Prodrug Activation and Sensitization to DOX
To study whether activation of the prodrugs leads to GSH depletion and thus sensitization to DOX, we treated GSTA1 overexpressing V79 cells with 5 μM ANS–DOX and DNS–DOX and measured the total GSH content after 2 and 6 h of exposure. The early time point showed only a minor reduction of the GSH levels, which were replenished again at 6 h (Figure 8A). This is not surprising as in this setup a maximum of 2.5 nmol prodrug (5 μM) could only deplete about 50% of the approximately 5 nmol total GSH (500 μg total protein in the sample with a GSH content of about 10 nmol/mg protein). Nonetheless, this highlights that prodrug uptake and activation is a rapid process involving a decrease of the GSH pool. Furthermore, in the scenario of a high accumulation within the tumor, a more pronounced GSH reduction might contribute to the toxicity profile as the cells become sensitized to the activated DOX.64 To validate this previously reported sensitization through a reduction in GSH we treated V79 cells with BSO and exposed them to DOX. Already a decrease in the GSH levels of about 65% (Control, 12 ± 6 nmol/mg protein, versus BSO treated, 4 ± 3 nmol/mg protein) resulted in a significant increase in DOX toxicity (Figure 8B) and thus suggests that the concomitant reduction in GSH levels may indeed synergize with the activated drug.
Figure 8.
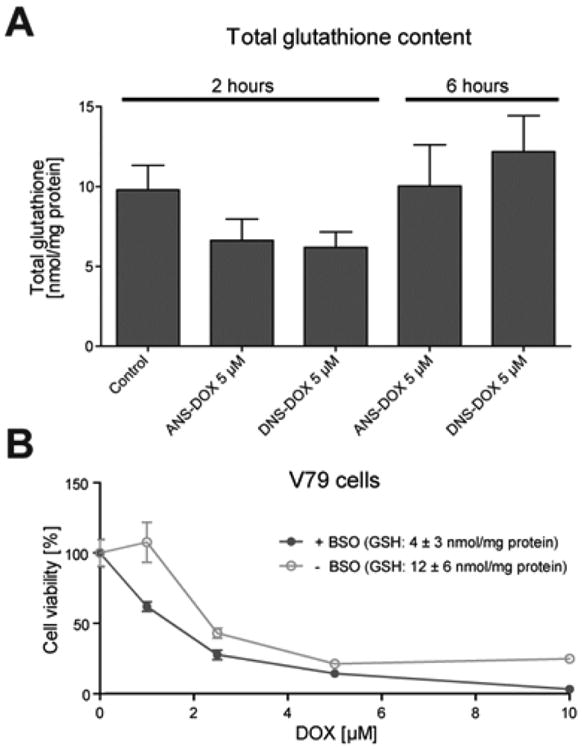
GSH depletion by prodrugs and sensitization to DOX. (A) GSTA1 overexpressing V79 cells were treated with the prodrugs for 2 or 6 h, respectively. Cells were subsequently lysed, and total GSH content was determined (Mean ± SEM, n = 3). (B) Cells were depleted of GSH using BSO and treated with DOX as indicated. GSH levels of control cells, 12 ± 6 nmol/mg protein; GSH levels of BSO treated cells, 4 ± 3 nmol/mg protein. Cellular toxicity was analyzed with the MTT assay after 24 h exposure (mean ± SEM, n = 3). Curve comparison: p = 0.09.
Thioredoxin Reductase 1 Inhibition as Concomitant Mechanisms of the Prodrugs
The electrophilic nature of the sulfonamide bond suggests that other intracellular nucleophiles, in addition to GSH, can also be the target of the prodrugs. A prime candidate is the selenoprotein TrxR1, which is the central enzyme in the antioxidant Trx system. Using recombinant TrxR1, DNS–DOX and ANS–DOX could both efficiently inhibit its activity toward Trx1, while having little effect on its ability to redox cycle with juglone (Figure 9A, left panel). Juglone, in contrast to Trx1, does not require an intact Sec-residue at the C-terminal.52,65 Inhibition by the prodrugs was furthermore NADPH dependent, suggesting that the reduced, highly nucleophilic and reactive Sec-residue in the C-terminal active site is the prime target (Figure 9A, right panel). This experiment was performed without a desalting step after a 10 min incubation of 20 nM TrxR1 with 10 μM of DNS–DOX in the presence or absence of NADPH. Subsequently, the remaining DNS–DOX started to competitively inhibit TrxR1 as 10 μM Trx1, 160 μM insulin, and 250 nM NADPH were added to measure the enzyme activity. In contrast to the prodrug, neither DOX, the sulfur dioxide, nor the GSH conjugated acetylmononitro/dinitro benzene moiety, which are the products of prodrug activation via GSH, are inhibitors of TrxR1 (Figure 9A, right panel). The underlying mechanism thus potentially involves the covalent modification of the Sec-residue by the acetylmononitro/dinitro benzene moiety of the prodrug in a reaction similar to that of the prodrugs with GSH. To study whether TrxR1 is also targeted within the cell we utilized HEK293 cells and treated those with 2 and 10 μM of DNS–DOX and ANS–DOX as well as 1 μM auranofin. Auranofin is a well-known TrxR1 inhibitor and often used as a standard to compare the efficiency of compounds in targeting cellular TrxR1.54,66,67 Compared to auranofin, both DNS–DOX and ANS–DOX showed a surprisingly high degree of TrxR1 inhibition even at 2 μM (Figure 9B). However, HEK293 cells with 0.013 ± 0.001 μmol/min/mg protein have a rather low GST-dependent CDNB activity compared to V79 cells (V79 control, 0.05 ± 0.01 μmol/min/mg; GSTA1, 0.11 ± 0.01 μmol/min/mg; see Figure 3B). This suggests overall lower GST levels in HEK293 cells and thus slower prodrug activation compared to V79 cells, leaving the prodrugs more time to target TrxR1. To test whether TrxR1 inhibition is limited by prodrug activation via GST/GSH we treated V79 control cells and GSTA1 overexpressing V79 cells with DNS–DOX, ANS-DOX, and auranofin. As expected, TrxR1 inhibition was lower in V79 compared to HEK293 cells and even further lowered by GSTA1 overexpression (Figure 9C).
Figure 9.
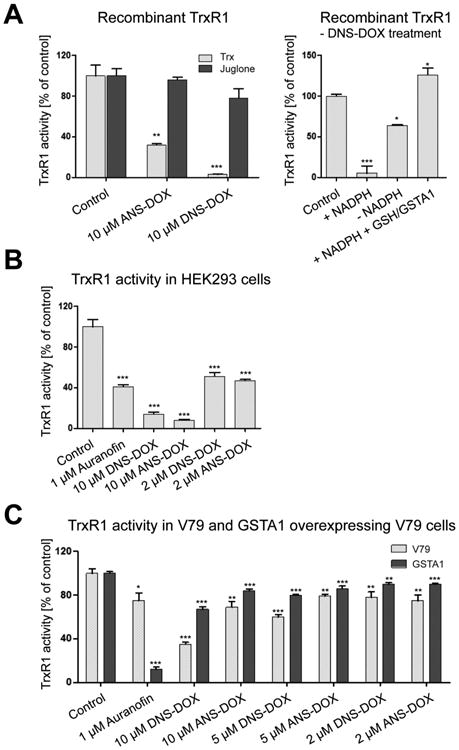
TrxR1 inhibition by DNS–DOX and ANS–DOX. (A) Inhibition of recombinant TrxR1 by auranofin, DNS–DOX, and ANS–DOX. Left panel: In vitro TrxR1 activity. Twenty nanomolar recombinant TrxR1 was incubated with the drugs as indicated for 10 min in the presence of NADPH. Enzyme activity was measured using either Trx1 or juglone as substrate (mean ± SEM, n = 3). Right panel: In vitro TrxR1 activity. Twenty nanomolar recombinant TrxR1 was incubated with 10 μM DNS–DOX either in the presence (+NADPH) or absence (–NADPH) of NADPH for 10 min. Subsequently, enzyme activity was measured using Trx1 as substrate. TrxR1 inhibition by the products of prodrug activation (DOX, SO2, and GSH conjugated acetylmononitro/dinitro benzene moiety) was determined by first incubating 10 μM DNS–DOX with 5 mM GSH and 50 nM GSTA1 for 30 min. Subsequently, 20 nM TrxR1 and 250 μM NADPH were added for 10 min. Enzyme activity was measured using Trx1 as substrate (mean ± SEM, n = 3). (B) Cellular TrxR1 activity. HEK293 cells were treated with the drugs as indicated for 3 h. Enzyme activity was measured in cell extract using a modified form of the Trx1 coupled insulin end point assay. Data are from two independent experiments measured in triplicate (mean ± SEM, n = 6). (C) TrxR1 inhibition in V79 control cells versus GSTA1 overexpressing V79 cells. Cells were treated with the drugs as indicated for 3 h, and enzyme activity was measured in cell extract using a modified form of the Trx1 coupled insulin end point assay. Data are from three independent experiments measured in duplicate (mean ± SEM, n = 6). *P ≤ 0.05, **P ≤ 0.01, and ***P ≤ 0.001 as compared with control levels by using a two-tailed student t test.
Discussion
The difficulty to selectively target cancer cells and the development of resistance to treatments are among the major problems in current cancer therapy. Additionally, the efficiency of a drug may be limited by a lack of activation or inactivation, poor drug influx or excessive efflux, alterations in expression levels of the drug target, or the activation of adaptive pro-survival pathways.68 We previously reported that MGST1 and GSTP1 overexpression promotes resistance to DOX but that this resistance could be overcome using the prodrugs MNS–DOX and DNS–DOX, respectively (Figure 1A).8 The major mechanism is the GST catalyzed release of DOX from these prodrugs, leading to selected accumulation and targeting of cells that have this particular GST overexpression, while potentially sparing other cells and minimizing side effects. While expanding our studies to other GSTs in order to further validate this concept we noticed that purified GSTA1 enzyme had an extremely high specific activity and conversion rate with DNS–DOX. Surprisingly, however, despite the efficient release of DOX there was an unexpected lack of cell toxicity augmentation in GSTA1 overexpression cells. We reasoned that there might be an enzyme-dependent “conversion rate window” that is optimal for the cells to be killed selectively by the prodrugs. This hypothesis is supported by our previous study showing that MGST1 overexpression augmented MNS–DOX toxicity while having only small effects on DNS–DOX toxicity despite a 100 times higher conversion rate for DNS–DOX compared to MNS-DOX.8 A similar behavior was observed in GSTP1 overexpressing cells, where DNS–DOX (converted with 84 ± 12 nmol/min/mg) toxicity was augmented by GSTP1 overexpression to a greater extent than by MGST1 overexpression, which has a higher conversion rate.8 Our reasoning is that a limited conversion rate capitalizes more optimal on the overexpression of the particular GST, leading to a stronger GST-dependent accumulation of the converted drug and thus a more selective cell killing. Highly reactive prodrugs, however, might already be converted at rates that are high enough to render a contribution from additional GST overexpression minor. This assumption is further strengthened by a recent study showing that limiting the prodrug reactivity can translate to a prolonged lifetime in the bloodstream and thus to a higher in vivo efficacy. For this, Nandurdikar et al. developed analogues of JS-K, an arylated diazeniumdiolate prodrug, where the nitro group substituents in the aromatic ring were replaced with less electron-withdrawing groups such as cyano or fluoro. Interestingly, a small decrease in reactivity promoted an increased efficacy, whereas too low reactivity resulted in a loss of effect.69
To further test this hypothesis we developed a DOX derivative with altered reactivity, 4-acetyl-2-nitro-benzenesul-fonyl doxorubicin (ANS–DOX), where a nitro group in the para position in DNS–DOX is replaced by an acetyl group (Figure 1). The less electron withdrawing acetyl group reduced the reactivity about 10–30 times compared to DNS–DOX (Figure 2B). In line with our hypothesis, ANS–DOX toxicity was indeed strongly augmented in a GSTA1-dependent manner despite its lower activity (Figure 3), which could be further confirmed by the time and GSTA1-dependent increase in nuclear DOX fluorescence (after ANS–DOX conversion) as well as GSTA1-dependent DNA damage (Figures 4 and 5). A similar behavior could be observed with MGST1, albeit to a smaller extent. ANS–DOX showed hereby a toxicity profile that seems at first independent of the MGST1 status. However, it is likely a combination of two opposing effects that cancel each other out; the MGST1-dependent conversion of ANS– DOX to DOX and MGST1 mediated resistance. Comparing the toxicity profiles of ANS–DOX with the previously studied DNS–DOX and MNS–DOX it becomes apparent that the toxicity of these prodrugs followed the conversion rates inversely.8
Notably, ANS–DOX induced toxicity in the MCF7 cells at much lower concentrations than DOX in a manner that seems independent of the GST status. This effect was also previously reported for DNS–DOX in the treatment of MCF7 cells,8 suggesting that these modifications alter the properties of DOX in a way that allow it to circumvent multidrug resistance mechanisms present in the MCF7 cells and thus act as a delivery system for the parental drug. A general effect such an increased uptake and altered intracellular distribution due to a change in the lipophilicity of the drug (logP; ANS–DOX: 2.2 vs. DOX: 0.6), might in part explain the behavior. However, this effect was predominant in MCF7 cells and not in the already more sensitive V79 cells in 24 h treatment experiments, suggesting that the prodrug might avoid one or more drug resistance mechanisms present in the MCF7 cells. A potential mechanism could be the avoidance of transmembrane transporter proteins such as P-glycoprotein (P-gp),60 membrane multidrug transporters (MRP1), or the breast cancer resistance protein (BCRP),70 which were previously reported to be important for DOX resistance in MCF7 cells.71 As a weak basic drug, the uptake, export, and intracellular behavior of DOX in MCF7 cells might furthermore be affected by a change in its propensity of being protonated.72,73 The concept of avoiding drug resistance by using various delivery systems was already tested for DOX. Common approaches utilize nanoparticles for delivery,74 such as polyester-based hyperbranched dendritic-linear (HBDL)-based nanoparticles, which could effectively overcome MGST1 mediated drug resistance in MCF7 cells75 or mesoporous silica nanoparticles (MSNs) that were used to deliver DOX in a xenograft nude mouse model.59 These and other targeted delivery systems such as homing peptides, immunoliposomes, or other nanoparticle approaches can furthermore be combined with the prodrug concept, thus providing the opportunity to merge an enhanced drug delivery with a selective activation mechanism, which might enable a more optimal targeting of cancer cells.76–78
Accumulation of prodrugs in the tumor cells through selective targeting would furthermore promote complementary effects that in turn augment the toxicity induced by the freed parental drug. Prodrug activation, for instance, involves the covalent addition of GSH to the sulfonamide moiety, which thus may reduce the GSH pool depending on the molar ratio of prodrug-to-GSH within the cell. Importantly, even a minor reduction might already improve cancer cell death in tumors through increased oxidative stress or a reduction of the detoxifying capacity in these cells.35,79 DOX, for instance, has already been shown to benefit significantly from decreased GSH levels, which might thus be part of the mechanism of ANS–DOX and DNS–DOX toxicity.64 Additionally, prodrugs might target intracellular nucleophiles other than GSH through their electrophilic sulfonamide bond. A prime candidate in this context is the redox regulatory enzyme TrxR1. It is the key enzyme in the antioxidant Trx system, overexpressed in many tumors and easily inhibited by electrophilic compounds due to a reactive and accessible Sec-residue within its active site. In fact, not only is TrxR1 considered to be an attractive anticancer target by itself,31 but inhibition of the enzyme has been suggested to be part of the mechanism of many drugs.32 Despite a rapid activation via GSH/GST, both DNS–DOX and ANS–DOX could inhibit TrxR1 in vitro and in cell culture with the more reactive DNS–DOX being more efficient than ANS-DOX. The ability to target TrxR1 was hereby dependent on the GST levels, as the activated drug is not targeting the enzyme. Nonetheless, the enzyme was inhibited in GSTA1 over-expressing V79 cells, suggesting that disruption of the Trx system is indeed a contributing factor. The mechanism may involve the induction of oxidative stress through a reduction in the antioxidant capacity or the disruption of redox signaling pathways. Furthermore, inhibition of TrxR1 is suggested to effectively synergize with targeting of the GSH system in the killing of cancer cells as both systems serve to back each other up.33,34 Designing prodrugs that concomitantly target the Trx and GSH systems in cancer cells while releasing a drug that benefits from these concomitant effects would thus be a suitable strategy to target cancer cells.
In parallel we included etoposide and an etoposide based prodrug in this study to validate it as a candidate for the development of novel GST activated prodrugs. The structure of the drug was modified such that a nitro acetyl-benzene moiety became conjugated to the etoposide (ANS–etoposide) through a sulfonic acid ester linkage (Figure 1A). The choice of ANS as the prodrug modification principle rests also on the fact that sulfonic acid ester linkages are more labile and that DNS modified etoposide would thus be less stable. Treating MGST1 overexpressing cells with ANS–etoposide showed an enzyme-dependent increase in toxicity, which, however, was weakly concentration dependent and had a less potent toxic profile compared to etoposide, suggesting either a compromised uptake or a limited activation. GSTA1 overexpression, however, showed a significant resistance against etoposide induced toxicity compared to control cells. Whereas treating the cells with the prodrug ANS–etoposide, the etoposide-dependent resistance was totally abolished, indicating a GSTA1-dependent activation of the prodrug. Potentially, the GSTA1-dependent activation of ANS–etoposide might compensate for the etoposide-induced resistance caused by overexpression. The GSTA1-dependent protection to etoposide toxicity could potentially be explained by the intracellular distribution of the enzyme and the mechanism of etoposide induced cell death, which has not been completely delineated yet. Jamil et al. showed, for instance, that low concentrations of etoposide could induce cell death via the mitochondrial arm of p53,80 a cellular compartment where also GSTA1 was shown to be present.81 Furthermore, it is not known whether the chemical modification of etoposide to ANS–etoposide alters the DNA topoisomerase II inhibitory properties of the molecule (we know that the modification of DOX occurs at an amino group critical for toxic properties). Also the chemical liability of the sulfonic acid ester bond could potentially lead to a rapid cellular, perhaps enzyme catalyzed, conversion to etoposide thus showing little difference compared to etoposide treatment. This idea needs to be tested with a less reactive mononitro derivative.
Despite the above outlined benefits of GST/GSH activatable drugs, their development and use may have potential drawbacks as they may become highly toxic in sites rich in GSTs such as the liver.82 To circumvent this problem we propose to use established drugs with known toxicity profiles, particularly those that are known to have low liver toxicity, as the basis for prodrugs. A very rapid activation of ANS–DOX in liver for example, may lead to the same toxicity as if the DOX would have been used directly. However, at the same time toxicity in all other cells, except the GSTA1 overexpressing cancer cells, would be reduced thus showing overall fewer side effects. Our experiments on V79 control cells and GSTA1 overexpressing V79 cells as a model system essentially showed that ANS-DOX was less toxic in the V79 control cells compared to DNS–DOX and DOX, whereas in GSTA1 overexpressing cells toxicity was similar no matter if DOX, ANS–DOX, or DNS-DOX was used (see Figure 3). Nonetheless, future in vivo studies are needed to fully grasp the potential short-term and long-term side effects of these prodrugs.
This study further explored the concept of using GST activated prodrugs in cancer treatment. We highlight that a low GST catalyzed conversion rate and a low background activity optimizes the GST-dependent accumulated of the activated drug and thus the augmentation of drug induced toxicity. Further, we show that rational modifications of the different DOX derivatives can affect not only the uptake and stability, but also the GST catalyzed conversion rate of this prodrug. We also show that decreased GSH levels and disruption of the Trx system via TrxR1 inhibition are concomitant factors of prodrug toxicity that likely synergize with the effects of the freed parental drug. Furthermore, we expanded the prodrug concept toward etoposide. Tailored modification might thus produce prodrugs that can be used to target specific types of cancers depending on their GST levels and composition as well as those displaying drug resistance.83,84 Designing different prodrug-types for different patient populations could contribute to a more personalized cancer therapy approach, were the therapeutic window is increased. Notably, TLK-286, a previously developed prodrug that targets GSTP1 over-expressing cancer cells went through to Phase III clinical trials showing the potential of this strategy.13,14
In conclusion, this study showed that the modification of existing drugs at the common amino or hydroxyl functional groups could be an effective way to develop novel selective drugs, which can overcome resistance mechanisms occurring in conventional treatments. Altering properties of DOX showed promising results to target resistant cancer cells and for the selective targeting of GST overexpressing tumors, thus potentially also reducing the side effects to normal tissue.
Acknowledgments
These studies were financially supported by the Swedish Research council, the Swedish Cancer Society, SSF, Carl Tryggers Stiftelse, AstraZeneca, and funds from the University of Maastricht and Karolinska Institutet. J.Z. was financially supported by the Swedish Research Council (No. 524-2011-6998). MEXT (Ministery of Education, Culture, Sports, Science and Technology of Japan) and NEDO (New Energy and Industrial Technology Development Organization of Japan) financially supported H.A.
Abbreviations
- ANS–DOX
4-acetyl-2-nitro-benzenesulfonyl doxorubicin
- ANS-etoposide
4-acetyl-2-nitro-benzenesulfonyl etoposide
- BCRP
breast cancer resistance protein
- BSA
bovine serum albumin
- BSO
DL-buthionine-sulfoximine
- CDNB
2,4-dinitro-chlorobenzene
- CFE
colony forming efficiency
- DMSO
dimethyl disulfoxide
- DNS–DOX
2,4-dinitrobenzenesulfonyl doxorubicin
- DOX
doxorubicin
- FBS
fetal bovine serum
- GSH
glutathione
- GST
glutathione transferase
- GSTA1
glutathione transferase alpha 1
- GSTP
glutathione transferase pi
- HBDL
hyperbranched dendriticlinear
- MGST1
microsomal glutathione transferase 1
- MNS–DOX
4-mononitrobenzenesulfonyl doxorubicin
- MPR1
membrane multidrug transporters
- MSN
mesoporous silica nanoparticles
- MTT
3-(4,5-dimethylthiazol-2-yl)-2,5-diphenyltetrazolium bromide
- PEST
penicillin-streptomycin
- P-gp
P-glycoprotein
- SFM
serum-free DMEM
- TrxR1
thioredoxin reductase 1
- WB
Western blotting
Footnotes
Notes: The authors declare no competing financial interest.
References
- 1.Darzynkiewicz Z, Traganos F, Wlodkowic D. Impaired DNA damage response–an Achilles' heel sensitizing cancer to chemotherapy and radiotherapy. Eur J Pharmacol. 2009;625(1-3):143–50. doi: 10.1016/j.ejphar.2009.05.032. [DOI] [PMC free article] [PubMed] [Google Scholar]
- 2.Simunek T, Sterba M, Popelova O, Adamcova M, Hrdina R, Gersl V. Anthracycline-induced cardiotoxicity: overview of studies examining the roles of oxidative stress and free cellular iron. Pharmacol Rep. 2009;61(1):154–71. doi: 10.1016/s1734-1140(09)70018-0. [DOI] [PubMed] [Google Scholar]
- 3.van Acker FA, van Acker SA, Kramer K, Haenen GR, Bast A, van der Vijgh WJ. 7-monohydroxyethylrutoside protects against chronic doxorubicin-induced cardiotoxicity when administered only once per week. Clin Cancer Res. 2000;6(4):1337–41. [PubMed] [Google Scholar]
- 4.Tredan O, Galmarini CM, Patel K, Tannock IF. Drug resistance and the solid tumor microenvironment. J Natl Cancer Inst. 2007;99(19):1441–54. doi: 10.1093/jnci/djm135. [DOI] [PubMed] [Google Scholar]
- 5.Lippert TH, Ruoff HJ, Volm M. Resistance in malignant tumors: can resistance assays optimize cytostatic chemotherapy? Pharmacology. 2008;81(3):196–203. doi: 10.1159/000112864. [DOI] [PubMed] [Google Scholar]
- 6.Rautio J, Kumpulainen H, Heimbach T, Oliyai R, Oh D, Jarvinen T, Savolainen J. Prodrugs: design and clinical applications. Nat Rev Drug Discovery. 2008;7(3):255–70. doi: 10.1038/nrd2468. [DOI] [PubMed] [Google Scholar]
- 7.Johansson K, Ahlen K, Rinaldi R, Sahlander K, Siritantikorn A, Morgenstern R. Microsomal glutathione transferase 1 in anticancer drug resistance. Carcinogenesis. 2007;28(2):465–70. doi: 10.1093/carcin/bgl148. [DOI] [PubMed] [Google Scholar]
- 8.Johansson K, Ito M, Schophuizen CM, Mathew Thengumtharayil S, Heuser VD, Zhang J, Shimoji M, Vahter M, Ang WH, Dyson PJ, Shibata A, Shuto S, Ito Y, Abe H, Morgenstern R. Characterization of new potential anticancer drugs designed to overcome glutathione transferase mediated resistance. Mol Pharmaceutics. 2011;8(5):1698–708. doi: 10.1021/mp2000692. [DOI] [PubMed] [Google Scholar]
- 9.Scotlandi K, Remondini D, Castellani G, Manara MC, Nardi F, Cantiani L, Francesconi M, Mercuri M, Caccuri AM, Serra M, Knuutila S, Picci P. Overcoming resistance to conventional drugs in Ewing sarcoma and identification of molecular predictors of outcome. J Clin Oncol. 2009;27(13):2209–16. doi: 10.1200/JCO.2008.19.2542. [DOI] [PubMed] [Google Scholar]
- 10.Townsend DM, Tew KD. The role of glutathione-S-transferase in anti-cancer drug resistance. Oncogene. 2003;22(47):7369–75. doi: 10.1038/sj.onc.1206940. [DOI] [PMC free article] [PubMed] [Google Scholar]
- 11.Sau A, Pellizzari Tregno F, Valentino F, Federici G, Caccuri AM. Glutathione transferases and development of new principles to overcome drug resistance. Arch Biochem Biophys. 2010;500(2):116–22. doi: 10.1016/j.abb.2010.05.012. [DOI] [PubMed] [Google Scholar]
- 12.Hayes JD, Flanagan JU, Jowsey IR. Glutathione transferases. Annu Rev Pharmacol Toxicol. 2005;45:51–88. doi: 10.1146/annurev.pharmtox.45.120403.095857. [DOI] [PubMed] [Google Scholar]
- 13.Tew KD, Townsend DM. Redox platforms in cancer drug discovery and development. Curr Opin Chem Biol. 2011;15(1):156–61. doi: 10.1016/j.cbpa.2010.10.016. [DOI] [PMC free article] [PubMed] [Google Scholar]
- 14.Tew KD. TLK-286: a novel glutathione S-transferase-activated prodrug. Expert Opin Invest Drugs. 2005;14(8):1047–54. doi: 10.1517/13543784.14.8.1047. [DOI] [PubMed] [Google Scholar]
- 15.Singh S. Cytoprotective and regulatory functions of glutathione S-transferases in cancer cell proliferation and cell death. Cancer Chemother Pharmacol. 2015;75(1):1–15. doi: 10.1007/s00280-014-2566-x. [DOI] [PubMed] [Google Scholar]
- 16.Di Pietro G, Magno LA, Rios-Santos F. Glutathione S-transferases: an overview in cancer research. Expert Opin Drug Metab Toxicol. 2010;6(2):153–70. doi: 10.1517/17425250903427980. [DOI] [PubMed] [Google Scholar]
- 17.McIlwain CC, Townsend DM, Tew KD. Glutathione S-transferase polymorphisms: cancer incidence and therapy. Oncogene. 2006;25(11):1639–48. doi: 10.1038/sj.onc.1209373. [DOI] [PMC free article] [PubMed] [Google Scholar]
- 18.Jakobsson PJ, Morgenstern R, Mancini J, Ford-Hutchinson A, Persson B. Common structural features of MAPEG – a widespread superfamily of membrane associated proteins with highly divergent functions in eicosanoid and glutathione metabolism. Protein Sci. 1999;8(3):689–92. doi: 10.1110/ps.8.3.689. [DOI] [PMC free article] [PubMed] [Google Scholar]
- 19.Singhal SS, Singh SP, Singhal P, Horne D, Singhal J, Awasthi S. Antioxidant role of glutathione S-transferases: 4-Hydroxynonenal, a key molecule in stress-mediated signaling. Toxicol Appl Pharmacol. 2015;289(3):361–70. doi: 10.1016/j.taap.2015.10.006. [DOI] [PMC free article] [PubMed] [Google Scholar]
- 20.Kalinina EV, Chernov NN, Novichkova MD. Role of glutathione, glutathione transferase, and glutaredoxin in regulation of redox-dependent processes. Biochemistry (Moscow) 2014;79(13):1562–83. doi: 10.1134/S0006297914130082. [DOI] [PubMed] [Google Scholar]
- 21.Hengstler JG, Bottger T, Tanner B, Dietrich B, Henrich M, Knapstein PG, Junginger T, Oesch F. Resistance factors in colon cancer tissue and the adjacent normal colon tissue: glutathione S-transferases alpha and pi, glutathione and aldehyde dehydrogenase. Cancer Lett. 1998;128(1):105–12. doi: 10.1016/s0304-3835(98)00059-7. [DOI] [PubMed] [Google Scholar]
- 22.Oguztuzun S, Aydin M, Demirag F, Yazici U, Ozhavzali M, Kilic M, Iscan M. The expression of GST isoenzymes and p53 in non-small cell lung cancer. Folia Histochem Cytobiol. 2010;48(1):122–127. doi: 10.2478/v10042-008-0084-6. [DOI] [PubMed] [Google Scholar]
- 23.Carmichael J, Forrester LM, Lewis AD, Hayes JD, Hayes PC, Wolf CR. Glutathione S-Transferase Isoenzymes and Glutathione-Peroxidase Activity in Normal and Tumor Samples from Human-Lung. Carcinogenesis. 1988;9(9):1617–1621. doi: 10.1093/carcin/9.9.1617. [DOI] [PubMed] [Google Scholar]
- 24.Oguztuzun S, Sezgin Y, Yazici S, Firat P, Ozhavzali M, Ozen H. Expression of glutathione-S-transferases isoenzymes and p53 in exfoliated human bladder cancer cells. Urol Oncol-Semin Ori. 2011;29(5):538–544. doi: 10.1016/j.urolonc.2009.08.001. [DOI] [PubMed] [Google Scholar]
- 25.Chuang Overexpression of glutathione S-transferase alpha in clear cell renal cell carcinoma. (vol 123, pg421, 2005) Am J Clin Pathol. 2005;123(3):421–429. doi: 10.1309/AQXR-6B2Q-PUGD-638C. [DOI] [PubMed] [Google Scholar]
- 26.Giaccia AJ, Lewis AD, Denko NC, Cholon A, Evans JW, Waldren CA, Stamato TD, Brown JM. The Hypersensitivity of the Chinese-Hamster Ovary Variant Bl-10 to Bleomycin Killing Is Due to a Lack of Glutathione S-Transferase-Alpha Activity. Cancer Res. 1991;51(16):4463–4469. [PubMed] [Google Scholar]
- 27.Tew KD. Glutathione-associated enzymes in anticancer drug resistance. Cancer Res. 1994;54(16):4313–20. [PubMed] [Google Scholar]
- 28.Sarkar D, Imai T, Kambe F, Shibata A, Ohmori S, Hayasaka S, Funahashi H, Seo H. Overexpression of glutathione-S-transferase A1 in benign adrenocortical adenomas from patients with Cushing's syndrome. J Clin Endocrinol Metab. 2001;86(4):1653–9. doi: 10.1210/jcem.86.4.7401. [DOI] [PubMed] [Google Scholar]
- 29.Beaumont PO, Moore MJ, Ahmad K, Payne MM, Lee C, Riddick DS. Role of glutathione S-transferases in the resistance of human colon cancer cell lines to doxorubicin. Cancer Res. 1998;58(5):947–55. [PubMed] [Google Scholar]
- 30.Harbottle A, Daly AK, Atherton K, Campbell FC. Role of glutathione S-transferase P1, P-glycoprotein and multidrug resistance-associated protein 1 in acquired doxorubicin resistance. Int J Cancer. 2001;92(6):777–83. doi: 10.1002/ijc.1283. [DOI] [PubMed] [Google Scholar]
- 31.Urig S, Becker K. On the potential of thioredoxin reductase inhibitors for cancer therapy. Semin Cancer Biol. 2006;16(6):452–465. doi: 10.1016/j.semcancer.2006.09.004. [DOI] [PubMed] [Google Scholar]
- 32.Cebula M, Schmidt EE, Arner ESJ. TrxR1 as a Potent Regulator of the Nrf2-Keap1 Response System. Antioxid Redox Signaling. 2015;23(10):823–853. doi: 10.1089/ars.2015.6378. [DOI] [PMC free article] [PubMed] [Google Scholar]
- 33.Harris IS, Treloar AE, Inoue S, Sasaki M, Gorrini C, Lee KC, Yung KY, Brenner D, Knobbe-Thomsen CB, Cox MA, Elia A, Berger T, Cescon DW, Adeoye A, Brustle A, Molyneux SD, Mason JM, Li WDY, Yamamoto K, Wakeham A, Berman HK, Khokha R, Done SJ, Kavanagh TJ, Lam CW, Mak TW. Glutathione and Thioredoxin Antioxidant Pathways Synergize to Drive Cancer Initiation and Progression. Cancer Cell. 2015;27(2):211–222. doi: 10.1016/j.ccell.2014.11.019. [DOI] [PubMed] [Google Scholar]
- 34.Fath MA, Ahmad IM, Smith CJ, Spence J, Spitz DR. Enhancement of Carboplatin-Mediated Lung Cancer Cell Killing by Simultaneous Disruption of Glutathione and Thioredoxin Metabolism. Clin Cancer Res. 2011;17(19):6206–6217. doi: 10.1158/1078-0432.CCR-11-0736. [DOI] [PMC free article] [PubMed] [Google Scholar]
- 35.Trachootham D, Alexandre J, Huang P. Targeting cancer cells by ROS-mediated mechanisms: a radical therapeutic approach? Nat Rev Drug Discovery. 2009;8(7):579–91. doi: 10.1038/nrd2803. [DOI] [PubMed] [Google Scholar]
- 36.Balamuth NJ, Womer RB. Ewing's sarcoma. Lancet Oncol. 2010;11(2):184–92. doi: 10.1016/S1470-2045(09)70286-4. [DOI] [PubMed] [Google Scholar]
- 37.Habermann TM. Antibody therapy in aggressive lymphomas. Hematology Am Soc Hematol Educ Program. 2007;2007:257–64. doi: 10.1182/asheducation-2007.1.257. [DOI] [PubMed] [Google Scholar]
- 38.Horn L, Castellanos EL, Johnson DH. Update on new drugs in small cell lung cancer. Expert Opin Invest Drugs. 2011;20(4):441–5. doi: 10.1517/13543784.2011.553185. [DOI] [PubMed] [Google Scholar]
- 39.Straus DJ. Chemotherapy only for localized Hodgkin lymphoma. J Intern Med. 2011;270(3):197–205. doi: 10.1111/j.1365-2796.2011.02410.x. [DOI] [PubMed] [Google Scholar]
- 40.Sevim H, Parkinson JF, McDonald KL. Etoposide-mediated glioblastoma cell death: dependent or independent on the expression of its target, topoisomerase II alpha? J Cancer Res Clin Oncol. 2011;137(11):1705–12. doi: 10.1007/s00432-011-1046-5. [DOI] [PubMed] [Google Scholar]
- 41.Karpinich NO, Tafani M, Rothman RJ, Russo MA, Farber JL. The course of etoposide-induced apoptosis from damage to DNA and p53 activation to mitochondrial release of cytochrome c. J Biol Chem. 2002;277(19):16547–52. doi: 10.1074/jbc.M110629200. [DOI] [PubMed] [Google Scholar]
- 42.Ratain MJ, Kaminer LS, Bitran JD, Larson RA, Le Beau MM, Skosey C, Purl S, Hoffman PC, Wade J, Vardiman JW, et al. Acute nonlymphocytic leukemia following etoposide and cisplatin combination chemotherapy for advanced non-small-cell carcinoma of the lung. Blood. 1987;70(5):1412–7. [PubMed] [Google Scholar]
- 43.Mistry AR, Felix CA, Whitmarsh RJ, Mason A, Reiter A, Cassinat B, Parry A, Walz C, Wiemels JL, Segal MR, Ades L, Blair IA, Osheroff N, Peniket AJ, Lafage-Pochitaloff M, Cross NC, Chomienne C, Solomon E, Fenaux P, Grimwade D. DNA topoisomerase II in therapy-related acute promyelocytic leukemia. N Engl J Med. 2005;352(15):1529–38. doi: 10.1056/NEJMoa042715. [DOI] [PubMed] [Google Scholar]
- 44.Habig WH, Pabst MJ, Jakoby WB. Glutathione S-transferases. The first enzymatic step in mercapturic acid formation. J Biol Chem. 1974;249(22):7130–9. [PubMed] [Google Scholar]
- 45.Sundberg K, Dreij K, Seidel A, Jernstrom B. Glutathione conjugation and DNA adduct formation of dibenzo[a,l]pyrene and benzo[a]pyrene diol epoxides in V79 cells stably expressing different human glutathione transferases. Chem Res Toxicol. 2002;15(2):170–9. doi: 10.1021/tx015546t. [DOI] [PubMed] [Google Scholar]
- 46.Mosmann T. Rapid colorimetric assay for cellular growth and survival: application to proliferation and cytotoxicity assays. J Immunol Methods. 1983;65(1-2):55–63. doi: 10.1016/0022-1759(83)90303-4. [DOI] [PubMed] [Google Scholar]
- 47.Sundqvist K, Liu Y, Nair J, Bartsch H, Arvidson K, Grafstrom RC. Cytotoxic and genotoxic effects of areca nut-related compounds in cultured human buccal epithelial cells. Cancer Res. 1989;49(19):5294–8. [PubMed] [Google Scholar]
- 48.Jarvis IW, Bergvall C, Bottai M, Westerholm R, Stenius U, Dreij K. Persistent activation of DNA damage signaling in response to complex mixtures of PAHs in air particulate matter. Toxicol Appl Pharmacol. 2013;266(3):408–18. doi: 10.1016/j.taap.2012.11.026. [DOI] [PubMed] [Google Scholar]
- 49.Rahman I, Kode A, Biswas SK. Assay for quantitative determination of glutathione and glutathione disulfide levels using enzymatic recycling method. Nat Protoc. 2006;1(6):3159–3165. doi: 10.1038/nprot.2006.378. [DOI] [PubMed] [Google Scholar]
- 50.Ren XL, Bjornstedt M, Shen B, Ericson ML, Holmgren A. Mutagenesis of Structural Half-Cystine Residues in Human Thioredoxin and Effects on the Regulation of Activity by Selenodiglutathione. Biochemistry. 1993;32(37):9701–9708. doi: 10.1021/bi00088a023. [DOI] [PubMed] [Google Scholar]
- 51.Xu JQ, Arner ESJ. Pyrroloquinoline quinone modulates the kinetic parameters of the mammalian selenoprotein thioredoxin reductase 1 and is an inhibitor of glutathione reductase. Biochem Pharmacol. 2012;83(6):815–820. doi: 10.1016/j.bcp.2011.12.028. [DOI] [PubMed] [Google Scholar]
- 52.Anestal K, Prast-Nielsen S, Cenas N, Arner ESJ. Cell Death by SecTRAPs: Thioredoxin Reductase as a Prooxidant Killer of Cells. PLoS One. 2008;3(4):e1846. doi: 10.1371/journal.pone.0001846. [DOI] [PMC free article] [PubMed] [Google Scholar]
- 53.Cenas N, Nivinskas H, Anusevicius Z, Sarlauskas J, Lederer F, Arner ESJ. Interactions of quinones with thioredoxin reductase -A challenge to the antioxidant role of the mammalian selenoprotein. J Biol Chem. 2004;279(4):2583–2592. doi: 10.1074/jbc.M310292200. [DOI] [PubMed] [Google Scholar]
- 54.Prast-Nielsen S, Cebula M, Pader I, Arner ESJ. Noble metal targeting of thioredoxin reductase - covalent complexes with thioredoxin and thioredoxin-related protein of 14 kDa triggered by cisplatin. Free Radical Biol Med. 2010;49(11):1765–1778. doi: 10.1016/j.freeradbiomed.2010.09.008. [DOI] [PubMed] [Google Scholar]
- 55.Arner ES, Holmgren A. Measurement of thioredoxin and thioredoxin reductase. Curr Protoc Toxicol. 2001;7:4. doi: 10.1002/0471140856.tx0704s05. [DOI] [PubMed] [Google Scholar]
- 56.Shibata A, Nakano Y, Ito M, Araki M, Zhang J, Yoshida Y, Shuto S, Mannervik B, Morgenstern R, Ito Y, Abe H. Fluorogenic probes using 4-substituted-2-nitrobenzenesulfonyl derivatives as caging groups for the analysis of human glutathione transferase catalyzed reactions. Analyst. 2013;138(24):7326–30. doi: 10.1039/c3an01339a. [DOI] [PubMed] [Google Scholar]
- 57.Morgenstern R, Lundqvist G, Andersson G, Balk L, DePierre JW. The distribution of microsomal glutathione transferase among different organelles, different organs, and different organisms. Biochem Pharmacol. 1984;33(22):3609–14. doi: 10.1016/0006-2952(84)90145-x. [DOI] [PubMed] [Google Scholar]
- 58.Lou PJ, Lai PS, Shieh MJ, Macrobert AJ, Berg K, Bown SG. Reversal of doxorubicin resistance in breast cancer cells by photochemical internalization. Int J Cancer. 2006;119(11):2692–8. doi: 10.1002/ijc.22098. [DOI] [PubMed] [Google Scholar]
- 59.Wang X, Teng Z, Wang H, Wang C, Liu Y, Tang Y, Wu J, Sun J, Wang H, Wang J, Lu G. Increasing the cytotoxicity of doxorubicin in breast cancer MCF-7 cells with multidrug resistance using a mesoporous silica nanoparticle drug delivery system. Int J Clin Exp Pathol. 2014;7(4):1337–47. [PMC free article] [PubMed] [Google Scholar]
- 60.Donmez Y, Gunduz U. Reversal of multidrug resistance by small interfering RNA (siRNA) in doxorubicin-resistant MCF-7 breast cancer cells. Biomed Pharmacother. 2011;65(2):85–9. doi: 10.1016/j.biopha.2010.12.007. [DOI] [PubMed] [Google Scholar]
- 61.AbuHammad S, Zihlif M. Gene expression alterations in doxorubicin resistant MCF7 breast cancer cell line. Genomics. 2013;101(4):213–20. doi: 10.1016/j.ygeno.2012.11.009. [DOI] [PubMed] [Google Scholar]
- 62.De U, Chun P, Choi WS, Lee BM, Kim ND, Moon HR, Jung JH, Kim HS. A novel anthracene derivative, MHY412, induces apoptosis in doxorubicin-resistant MCF-7/Adr human breast cancer cells through cell cycle arrest and downregulation of P-glycoprotein expression. Int J Oncol. 2014;44(1):167–76. doi: 10.3892/ijo.2013.2160. [DOI] [PubMed] [Google Scholar]
- 63.Alpsoy A, Yasa S, Gunduz U. Etoposide resistance in MCF-7 breast cancer cell line is marked by multiple mechanisms. Biomed Pharmacother. 2014;68(3):351–5. doi: 10.1016/j.biopha.2013.09.007. [DOI] [PubMed] [Google Scholar]
- 64.Kisara S, Furusawa S, Takayanagi Y, Sasaki K. Effect of glutathione depletion by buthionine sulfoximine on doxorubicin toxicity in mice. Res Commun Mol Pathol Pharmacol. 1995;89(3):401–10. [PubMed] [Google Scholar]
- 65.Cenas N, Nivinskas H, Anusevicius Z, Sarlauskas J, Lederer F, Arner ES. Interactions of quinones with thioredoxin reductase: a challenge to the antioxidant role of the mammalian selenoprotein. J Biol Chem. 2004;279(4):2583–92. doi: 10.1074/jbc.M310292200. [DOI] [PubMed] [Google Scholar]
- 66.Gromer S, Arscott LD, Williams CH, Schirmer RH, Becker K. Human placenta thioredoxin reductase - Isolation of the selenoenzyme, steady state kinetics, and inhibition by therapeutic gold compounds. J Biol Chem. 1998;273(32):20096–20101. doi: 10.1074/jbc.273.32.20096. [DOI] [PubMed] [Google Scholar]
- 67.Omata Y, Folan M, Shaw M, Messer RL, Lockwood PE, Hobbs D, Bouillaguet S, Sano H, Lewis JB, Wataha JC. Sublethal concentrations of diverse gold compounds inhibit mammalian cytosolic thioredoxin reductase (TrxR1) Toxicol In Vitro. 2006;20(6):882–890. doi: 10.1016/j.tiv.2006.01.012. [DOI] [PubMed] [Google Scholar]
- 68.Holohan C, Van Schaeybroeck S, Longley DB, Johnston PG. Cancer drug resistance: an evolving paradigm. Nat Rev Cancer. 2013;13(10):714–726. doi: 10.1038/nrc3599. [DOI] [PubMed] [Google Scholar]
- 69.Nandurdikar RS, Maciag AE, Holland RJ, Cao Z, Shami PJ, Anderson LM, Keefer LK, Saavedra JE. Structural modifications modulate stability of glutathione-activated arylated diazeniumdiolate prodrugs. Bioorg Med Chem. 2012;20(9):3094–3099. doi: 10.1016/j.bmc.2012.02.045. [DOI] [PMC free article] [PubMed] [Google Scholar]
- 70.Doyle LA, Yang WD, Abruzzo LV, Krogmann T, Gao YM, Rishi AK, Ross DD. A multidrug resistance transporter from human MCF-7 breast cancer cells. Proc Natl Acad Sci U S A. 1998;95(26):15665–15670. doi: 10.1073/pnas.95.26.15665. [DOI] [PMC free article] [PubMed] [Google Scholar]
- 71.Wind NS, Holen I. Multidrug resistance in breast cancer: from in vitro models to clinical studies. Int J Breast Cancer. 2011;2011:967419. doi: 10.4061/2011/967419. [DOI] [PMC free article] [PubMed] [Google Scholar]
- 72.Swietach P, Hulikova A, Patiar S, Vaughan-Jones RD, Harris AL. Importance of intracellular pH in determining the uptake and efficacy of the weakly basic chemotherapeutic drug, doxorubicin. PLoS One. 2012;7(4):e35949. doi: 10.1371/journal.pone.0035949. [DOI] [PMC free article] [PubMed] [Google Scholar]
- 73.Webb BA, Chimenti M, Jacobson MP, Barber DL. Dysregulated pH: a perfect storm for cancer progression. Nat Rev Cancer. 2011;11(9):671–7. doi: 10.1038/nrc3110. [DOI] [PubMed] [Google Scholar]
- 74.Xue X, Liang XJ. Overcoming drug efflux-based multidrug resistance in cancer with nanotechnology. Aizheng. 2012;31(2):100–109. doi: 10.5732/cjc.011.10326. [DOI] [PMC free article] [PubMed] [Google Scholar]
- 75.Zeng XH, Morgenstern R, Nystrom AM. Nanoparticle-directed sub-cellular localization of doxorubicin and the sensitization breast cancer cells by circumventing GST-Mediated drug resistance. Biomaterials. 2014;35(4):1227–1239. doi: 10.1016/j.biomaterials.2013.10.042. [DOI] [PubMed] [Google Scholar]
- 76.Safari J, Zarnegar Z. Advanced drug delivery systems:Nanotechnology of health design A review. J Saudi Chem Soc. 2014;18(2):85–99. [Google Scholar]
- 77.Tiwari G, Tiwari R, Sriwastawa B, Bhati L, Pandey S, Pandey P, Bannerjee SK. Drug delivery systems: An updated review. Int J Pharm Investig. 2012;2(1):2–11. doi: 10.4103/2230-973X.96920. [DOI] [PMC free article] [PubMed] [Google Scholar]
- 78.Svensen N, Walton JG, Bradley M. Peptides for cell-selective drug delivery. Trends Pharmacol Sci. 2012;33(4):186–92. doi: 10.1016/j.tips.2012.02.002. [DOI] [PubMed] [Google Scholar]
- 79.Traverso N, Ricciarelli R, Nitti M, Marengo B, Furfaro AL, Pronzato MA, Marinari UM, Domenicotti C. Role of glutathione in cancer progression and chemoresistance. Oxid Med Cell Longevity. 2013;2013:972913. doi: 10.1155/2013/972913. [DOI] [PMC free article] [PubMed] [Google Scholar]
- 80.Jamil S, Lam I, Majd M, Tsai SH, Duronio V. Etoposide induces cell death via mitochondrial-dependent actions of p53. Cancer Cell Int. 2015;15:79. doi: 10.1186/s12935-015-0231-z. [DOI] [PMC free article] [PubMed] [Google Scholar]
- 81.Raza H, Robin MA, Fang JK, Avadhani NG. Multiple isoforms of mitochondrial glutathione S-transferases and their differential induction under oxidative stress. Biochem J. 2002;366:45–55. doi: 10.1042/BJ20020533. [DOI] [PMC free article] [PubMed] [Google Scholar]
- 82.Deponte M. Glutathione catalysis and the reaction mechanismsof glutathione-dependent enzymes. Biochim Biophys Acta, Gen Subj. 2013;1830(5):3217–3266. doi: 10.1016/j.bbagen.2012.09.018. [DOI] [PubMed] [Google Scholar]
- 83.Morgenstern R. A simple alternate substrate test can help determine the aqueous or bilayer location of binding sites for hydrophobic ligands/substrates on membrane proteins. Chem Res Toxicol. 1998;11(6):703–7. doi: 10.1021/tx980013e. [DOI] [PubMed] [Google Scholar]
- 84.Morgenstern R, Lundqvist G, Hancock V, DePierre JW. Studies on the activity and activation of rat liver microsomal glutathione transferase, in particular with a substrate analogue series. J Biol Chem. 1988;263(14):6671–5. [PubMed] [Google Scholar]