

Abstract
Background and Purpose
Recombinant IFN‐ß is one of the first‐line treatments in multiple sclerosis (MS), despite its lack of efficacy in some patients. In this context, mesenchymal stem cells (MSCs) represent a promising therapeutic alternative due to their immunomodulatory properties and multipotency. Moreover, by taking advantage of their pathotropism, these cells can be genetically modified to be used as carriers for delivering or secreting therapeutic drugs into injured tissues. Here, we report the therapeutic effect of systemic delivery of adipose‐derived MSCs (AdMSCs), transduced with the IFN‐β gene, into mice with experimental autoimmune encephalomyelitis (EAE).
Experimental Approach
Relapsing–remitting and chronic progressive EAE were induced in mice. Cells were injected i.v. Disease severity, inflammation and tissue damage were assessed clinically, by flow cytometry of spleens and histopathological evaluation of the CNS respectively.
Key Results
Genetic engineering did not modify the biological characteristics of these AdMSCs (morphology, growth rate, immunophenotype and multipotency). Furthermore, the transduction of IFN‐ß to AdMSCs maintained and, in some cases, enhanced the functional properties of AdMSCs by ameliorating the symptoms of MS in EAE models and by decreasing indications of peripheral and central neuro‐inflammation.
Conclusion and Implications
Gene therapy was found to be more effective than cell therapy in ameliorating several clinical parameters in both EAE models, presumably due to the continuous expression of IFN‐β. Furthermore, it has significant advantages over AdMSC therapy, and also over systemic IFN‐ß treatment, by providing long‐term expression of the cytokine at therapeutic concentrations and reducing the frequency of injections, while minimizing dose‐limiting side effects.
Abbreviations
- AdMSCs
adipose‐derived MSCs
- AdMSCs‐IFN‐ß
AdMSCs that constitutively produced IFN‐ß
- C57
C57Bl/6
- CP‐EAE
chronic progressive EAE
- EAE
experimental autoimmune encephalomyelitis
- Iba1
ionized calcium‐binding adapter molecule 1
- MBP
myelin basic protein
- MS
multiple sclerosis
- MSCs
mesenchymal stem cells
- NeuN
neuronal nuclear antigen
- Olig2
oligodendrocyte transcription factor
- RR‐EAE
relapsing–remitting EAE
- SJL
SJL/JCrl
Tables of Links
| TARGETS | |
|---|---|
| Other protein targets a | Enzymes c |
| CD74 | CASP3 |
| Catalytic receptors b | |
| CD25 (IL‐2 receptor α) | |
| IFNAR2 |
These Tables list key protein targets and ligands in this article which are hyperlinked to corresponding entries in http://www.guidetopharmacology.org, the common portal for data from the IUPHAR/BPS Guide to PHARMACOLOGY (Southan et al., 2016), and are permanently archived in the Concise Guide to PHARMACOLOGY 2015/16 (a,b,cAlexander et al., 2015a,b,c).
Introduction
Multiple sclerosis (MS) is a chronic autoimmune demyelinating disorder characterized by inflammation of the CNS. The clinical symptoms of MS are thought to be due to combined injury to oligodendrocytes and myelin, and irreversible axonal loss (Bar‐Or and Darlington, 2011; Darlington et al., 2011).
Although not effective in every patient, recombinant IFN‐β continues to be one of the most widely prescribed immunomodulators for MS patients, since it reduces relapse frequency and the risk of sustained disease progression and decreases MRI lesion activity and brain atrophy (Galligan et al., 2010; Garg and Smith, 2015; Severa et al., 2015). Although the precise mechanisms underlying the therapeutic efficacy of IFN‐β are unclear, there is evidence that it blocks T‐cell activation, shifting the environment from pro‐ to anti‐inflammatory, prevents cell migration across the blood–brain barrier and promotes the repair of damaged neural cells by favouring the differentiation of neural stem cells into oligodendrocytes (Platanias, 2005; Martin‐Saavedra et al., 2008; Kieseier, 2011; Severa et al., 2015).
However, the short half‐life of IFN‐ß in serum and its inability to amass in the CNS necessitates patients having long‐term repeated injections, which, typically, are associated with several side effects (Walther and Hohlfeld, 1999). Therefore, there is an urgent need to develop more effective therapies aimed not only at preventing the immune‐mediated injury but also at providing protection against the neurodegeneration in MS (Darlington et al., 2011).
In this context, mesenchymal stem cells (MSCs) represent a promising tool as a therapy in MS. The rationale for their use in MS was originally based on their differentiation and immunoregulatory capacities (Dominici et al., 2006; Tyndall et al., 2007; Constantin et al., 2009; Ben‐Ami et al., 2011; Mizuno et al., 2012). In mice with experimental autoimmune encephalomyelitis (EAE), the animal model most frequently used for MS that mimics the T‐cell‐mediated demyelination that occurs in the CNS (Friese et al., 2006; Steinman and Zamvil, 2006; Moreno et al., 2012), the transplant of MSCs ameliorates the clinical symptoms, the infiltration of inflammatory cells into the CNS, demyelination and axonal damage (Uccelli et al., 2006; Constantin et al., 2009; Newman et al., 2009; Freedman et al., 2010; Marin‐Bańasco et al., 2014). Their potential mechanisms include the suppression of both innate and adaptive immune cells and the up‐regulation of the generation of regulatory T‐cells (Uccelli et al., 2008; Newman et al., 2009; Cohen, 2013). MSC‐secreted soluble factors such as indoleamine‐2,3‐dioxygenase, TGF‐β, hepatocyte growth factor, nitric oxide and soluble human leukocyte antigen‐G have been proposed to mediate these immunomodulatory effects (Le Blanc et al., 2003; Zappia et al., 2005; Nasef et al., 2007), although other mechanisms such as cell contact (Krampera et al., 2003) and bystander effects (Newman et al., 2009) have also been implicated.
Furthermore, the ability of stem cells to migrate into inflamed CNS (Ji et al., 2004; Ponte et al., 2007) and once there to differentiate into neural‐like cells, promote the differentiation of endogenous neural stem cells and modulate the inflammatory process and neurorepair has fuelled interest in their therapeutic potential in MS (Uccelli et al., 2008; Darlington et al., 2011; Cohen, 2013; Cornelissen et al., 2015).
This tropism of MSCs also makes them useful for the delivery of therapeutic molecules to target the sites of injury in MS, as it is possible to introduce exogenous genes to be expressed by MSCs, aiming both to enhance their homing capacities and to increase their therapeutic potential (Moloney et al., 2010; Cobo et al., 2013; Wyse et al., 2014).
In this study, we have genetically manipulated our previously characterized murine adipose‐derived MSCs (AdMSCs) (Marin‐Bańasco et al., 2014) to constitutively produce IFN‐ß (AdMSCs‐IFN‐ß), in order to use them as autologous and allogeneic gene therapy in models of both relapsing–remitting EAE (RR‐EAE)and chronic progressive EAE (CP‐EAE).
Methods
Mice
All experiments were conducted using adult (6–8 weeks old, 20‐23 g weight) female SJL/JCrl (SJL) (H2s) and C57Bl/6 (C57) (H2b) mice inbred, purchased from Charles Rivers (Germany). The animals were housed in clear plastic cages under specific pathogen‐free conditions in accordance with institutional guidelines. The mice were kept in a controlled temperature (23 ± 1°C), a 12:12‐h light/dark cycle and had free access to food and water. Efforts were made to minimize the number of animals used and their suffering. Care conditions were adapted to facilitate the hydration and food access ab libitum to the animals during the development of EAE. Animal studies are reported in compliance with the ARRIVE guidelines (Kilkenny et al., 2010; McGrath and Lilley, 2015). The study was approved by the institutional ethical committees (Comité de Ética de la Investigación Provincial de Málaga and ComitéÉtico de Experimentación de la Universidad de Málaga), and all experiments were performed in compliance with the European Animal Research Laws (European Communities Council Directives 2010/63/EU, 90/219/EEC, Regulation (EC) No. 1946/2003) and the Spanish National and Regional Guidelines for Animal Experimentation and Use of Genetically Modified Organisms (Real Decreto 53/2013 and 178/2004, Ley 32/2007 and 9/2003, Decreto 320/2010).
AdMSC culture
AdMSCs were isolated from SJL mice. After the mice had been killed by cervical dislocation, adipose tissue fragments were obtained from s.c. abdominal fat. The isolation, culture and expansion of murine AdMSCs were performed as described previously (Marin‐Bańasco et al., 2014). Cells were resuspended in Complete MesenCult® Medium (STEMCELLS Technologies, Grenoble, France), supplemented with streptomycin and penicillin (PAA Laboratories GmbH, Pasching, Austria) seeded in six‐well culture plates (1 × 10⁶ cells per 9.6 cm2 dish) and, thereafter, expanded with the aforementioned medium from 1 up to 10 passages (p). Genetic modification of AdMSCs‐IFN‐β started at passages 2–3, being the passages in which the number of cells was taken to be transduced.
Lentiviral production and AdMSC transduction
Lentiviral construction
Musmusculus IFN‐β 1 fibroblast (Ifnb1), ID: ref|NM_010510.1) cDNA, was synthesized by Genescript (Piscataway, NJ, USA) with the addition of BamH1 and pst1 endonuclease site subsequently used for cloning in the CMV promoter‐enhanced GFP woodchuck hepatitis post‐transcriptional regulatory element (CEWP) lentiviral plasmid (Benabdellah et al., 2014). The plasmid generated was named CIFNbWP.
Vector production and titration
The human immunodeficiency virus and the packaging (pCMVΔR8.9) and envelope (pMD2.G) plasmids were produced as described previously (Zufferey et al., 1998). Vector production was performed as described previously (Toscano et al., 2004). Briefly, 293T cells were plated on amine‐coated Petri dishes (Sarsted, Newton, NC, USA). The vector, packaging and envelope plasmids (plasmid proportion 3:2:1) were resuspended in 1.5 mL of Opti‐MEM (Thermo Fisher Scientific, Waltham, MA, USA) and transfected into the 293T cells using 60 μL of Lipofectamine 2000 (Thermo Fisher Scientific). The 293T cells were incubated for 6–8 h, washed and cultured for 48 h. Viral supernatants were collected and filtered through a 0.45 μm (pore size) filter (Nalgene, Rochester, NY, USA) and frozen or concentrated by ultrafiltration at 2000 g and 4°C, using 100 Kd centrifugal filter devices (Amicon Ultra‐15; Millipore, Billerica, MA, USA). For vector titration, 293T cells were plated at 1 × 10⁵ cells per well in a 24‐well tissue culture plate for 24 h. Then they were incubated for 5 h with different concentrations of viral supernatant (CEWP), washed, cultured until they reached confluence and analysed by flow cytometry to determine the number of vectors per cell.
AdMSC transduction
Cells were transduced as follows. Briefly, 2 × 10⁶ AdMSCs were incubated with 500 μL of CIFNbWP lentivirus supernatants in MesenCult for 2 min and seeded at 105 cells cm‐2 for 5 h. The cells were then trypsinized with 0.05% trypsin/EDTA (Thermo Fisher Scientific) and replated at a density of 104 cells cm‐2. Twenty‐four hours later, nonadherent cells were removed and the medium replaced with 1.5 mL of fresh medium. Cells were subjected to two additional rounds of this transduction procedure, each called ‘Hit’. Thus, we generated three genetically modified cell lines producing murine IFN‐β (AdMSC‐IFN‐β: 1Hit, 2Hits or 3Hits). Once the transduction processes had been completed, cells were expanded in the same conditions as described above for untransfected AdMSCs, up to passage 10. Four replicates were performed for each cell line. Each replicate was a mixture of AdMSCs obtained from two SJL mice.
Quantification of lentiviral integration in AdMSC cultures by quantitative PCR
Vector copy number per cell was calculated by quantitative PCR (Q‐PCR) using 0.6 μg of genomic DNA (=100.000 genomes) and 10‐fold increasing amounts of plasmid DNA (from 102 to 107 copies) for the standard curve. The Q‐PCR (Mx3005P, Stratagene, La Jolla, CA, USA) reaction consisted of 40 cycles at 94°C (15 s), followed by 60°C (30 s) and 72°C(30 s). We used primers for the WPRE sequence: WPRE‐F: 5′‐CACCACCTGTCAGCTCCTTT and WPRE‐R: 5′‐ACAACACCACGGAATTGTCA.
To determine the number of CIFNbWP vectors integrated in each of the different Hits, the Ct values obtained by Q‐PCR were divided by the number of starting cell populations (1 × 10⁵).
In vitro determination of IFN‐β protein levels in supernatants of cell cultures by a quantitative elisa
For IFN‐β production to be detected, 1 × 10⁶ cells of AdMSCs‐IFN‐β (1Hit, 2Hits and 3Hits) were cultured (at p7–p8, n = 1 per each experimental cell line, in triplicate) with MESENCULT®. Supernatants (4 mL per culture) were collected at 24 and 48 h, concentrated (600–700 μL) by specific protein filters (Vivaspin Turbo 15, 10 kDa MWCO; Sartorious Stedim Biotech, Spain) and assayed by a quantitative elisa (VeriKineTM Mouse IFN‐β elisa kit; PBL Interferon source, Piscataway, NJ, USA) following the manufacturer's instructions. As control values, data were obtained from supernatants of 1 × 10⁶ of non‐transfected AdMSC cultures. The concentration of IFN‐β was calculated using a standard curve for mouse IFN‐β expressed in mammalian cells (range 15.6–1000 pg·mL−1).
We also quantified the IFN‐β production in supernatants from cell lines differentiated into adipocytes, osteoblasts and chondrocytes and transdifferentiated into neuronal cells (p7) and seeded at the described experimental conditions. Supernatants were collected 48 h after MESENCULT or differentiation medium replacement and were stored at −80°C until their use.
Biological characterization of the AdMSC‐IFN‐β populations
As the transduction processes started at culture p2–p3 and each of the 3Hits cell line replicates underwent three consecutive transduction processes, we analysed and compared the biological characteristics of the three IFN‐β‐secreting cell lines from p6 to p10. Cell morphology, growth rate and surface marker expression were determined as previously described (Marin‐Bańasco et al., 2014).
AdMSC‐IFN‐β multipotency and transdifferentiation assays
Multipotency
The adipogenic, osteogenic and chondrogenic potential was demonstrated in AdMSCs‐IFN‐β (1Hit, 2Hits and 3Hits) and non‐transfected AdMSC populations at p7 (n = 2 per each experimental cell line, and in duplicate). Induction was done by replacing the growth medium for the supplemented MSC Adipogenic, Osteogenic or Chondrogenic Differentiation Medium (Ready‐to‐use) (PromoCell GMBH, Heidelberg, Germany), with minor modifications to the manufacturer's instructions, according to the protocol described previously (Marin‐Bańasco et al., 2014).
Transdifferentiation
All cell lines mentioned were incubated for 5 days with the supplemented MSCs Neurogenic Differentiation Medium (PromoCell GMBH). The protocol was performed following the manufacturer's instructions. The characteristic granular structures unique to the soma of neuronal cells, the Nissl bodies, were detected by specific staining with cresyl violet, (PromoCell GMBH).
As negative controls of the differentiation assays, all cell populations were seeded in the same conditions but incubated with MESENCULT. Differentiation images were captured at 10× or 20× magnification, with an inverted phase contrast microscope (Leica DMIL LED) to acquire images of adipocytes, osteocytes and neurons and an Olympus BX41 Microscope (Olympus Iberia S.A.U., Barcelona, Spain) for chondrocyte images.
EAE induction and clinical evaluation
RR‐EAE and CP‐EAE were induced in SJL and C57 mice, respectively, by s.c. immunization with the proteolipid protein 139–151 peptide (HSLGKWLGHPDKF) (300 μg; GenScript, Piscataway NJ, USA) or the myelin oligodendrocyte glycoprotein 35–55 peptide (MEVGWYRSPFSRVVHLYRNGK) (200 μg; GenScript), respectively, emulsified in complete Freund's adjuvant containing 0.8 mg·mL−1 heat‐inactivated Mycobacterium tuberculosis (Becton Dickinson) in a final volume of 100 μL. Fifty microlitres of this emulsion was injected on each side of the midline on the lower back. A total dose of 300 ng of pertussis toxin (Sigma‐Aldrich Química S.L., Spain) was administered i.p. on days 0 and 2 post immunization.
The clinical score was assessed according to a standard 0 to 5 scale (Moline‐Velazquez et al., 2011; Marin‐Bańasco et al., 2014): 0, healthy; 0.5, flaccidity and partial paralysis of the tail; 1, limp tail; 1.5, weakness in one hindlimb; 2, hindlimb paresis; 2.5, partial hindlimb paralysis; 3, total hindlimb paralysis; 3.5, partial forelimb paralysis; 4, forelimb paralysis; 4.5, body/front limb paresis/paralysis; and 5, moribund. Scoring was performed without knowledge of the treatments. The humane end points were established as follows: weight decrement by more than 20%, abnormal behaviour, appearances and clinical signs (piloerection, back arched, nasal/ocular discharge, stereotypies, convulsions, coma, self‐mutilation and severe dehydration). These clinical signs were evaluated daily by staff of the Experimental Animal Centre of the University of Malaga. None of the animals showed any of these signs during the experimental period.
RR‐EAE‐induced animals were monitored over a 50 day period and CP‐EAE‐induced animals over 35 days. Three RR‐EAE‐treated animals were found dead in the cage during the study, presumably due to the aggressiveness of the EAE. The end point evaluation included a variety of parameters that reflect the disease severity, such as the disease incidence and mortality, the day of the disease onset, the mean of maximum score, the mean score reached in the chronic phase in CP‐EAE animals, the duration and mean scores of the relapsing periods in RR‐EAE mice and the cumulative score over the duration of the experiment.
Treatment protocols
When RR‐EAE‐ and CP‐EAE‐induced animals reached a clinical score between 0.5 and 1, they were randomly distributed into groups of five mice per cage to receive an i.v. injection of the following treatments:
Saline (control group) (n = 11 in RR‐EAE; n = 9 in CP‐EAE).
Non‐transduced AdMSCs (cell therapy) (n = 11 in RR‐EAE; n = 8 in CP‐EAE).
Transduced AdMSCs (1Hit) (gene therapy) (n = 9 in RR‐EAE; n = 11 in CP‐EAE).
For each therapy, the animals received a unique i.v. administration of 1 × 10⁶ cells resuspended in 400 μL saline through the vein of the tail. EAE‐control groups received only vehicle (saline) by the same protocol.
Tissue extraction and processing
Animals were killed by i.p. administration of a lethal dose of pentobarbital. Fresh extraction of blood, spleen, brain and spinal cord was performed at the peak of the second relapse (48 days post immunization; dpi) in RR‐EAE mice and in the chronic period (35 dpi) in CP‐EAE animals. Blood was centrifuged to isolate the serum samples, which were stored at −20°C until their use. Spleens were placed in Hibernate® medium (Thermo Fisher Scientific) until processing. Part of the lumbar spinal cord was placed in 4% paraformaldehyde (PFA) (Sigma‐Aldrich Química, S.L.), cryoprotected in 30% (w.v‐1) sucrose and cut in 40 μm‐thick cryostat sections for its histopathological analysis. The other part of the lumbar spinal area and the brain were frozen in liquid nitrogen and were used later in the RT‐PCR studies detailed below.
Determination of IFN‐β protein levels in serum of EAE mice
Serum IFN‐β levels were assessed by the same quantitative elisa kit (VeriKineTM Mouse IFN‐β) described for supernatants, in EAE mice treated with saline, AdMSC or AdMSC‐IFN‐β at day 35 (CP‐EAE) and at day 48 after immunization (RR‐EAE) (n = 3 mice per group). However, serum IFN‐β levels were under the limit of quantification of the kit (15.6 pg·mL−1) in all cases.
Analysis of splenic subsets in EAE mice by flow cytometry
After removal of the Hibernate® medium, a single splenocyte suspension was obtained by filtering through a 40 μm nylon cell strainer (BD Falcon). After red blood cell lysis in ACK lysis buffer (Panreac), 106 splenocytes were resuspended in 50 μL of staining buffer [sterile PBS supplemented with 25 mM HEPES, 2% penicillin/streptavidin and 10% FBS (Linus)], and the Fc receptors were blocked for 10 min at 4°C with anti‐CD16/CD32 antibodies (10 μg·mL−1; BD Biosciences, Madrid, Spain). The cells were then labelled for an additional 30 min at 4°C in the dark, with 50 μL of the corresponding antibody in staining buffer. Splenocytes were washed twice with staining buffer, recovered by centrifugation at 269 x g for 5 min at RT, resuspended in PBS and, finally, assayed in a FACS Canto II cytometer (BD Biosciences). Anti‐mouse antibodies for the myeloid subset included an FITC‐conjugated Ly‐6C, R‐PE‐conjugated Ly‐6G, a PerCP Cy5.5‐conjugated CD11b (all from BD Biosciences), APC‐conjugated CD11c and e‐Fluor‐450‐conjugated F4/80 (from eBioscience). Anti‐mouse antibodies for the lymphoid panel included an FITC‐conjugated CD8, R‐PE‐conjugated CD4, Pacific Blue‐conjugated CD3 (from BD Biosciences), PE‐Cy5.5‐conjugated CD25, APC‐conjugated CD69 (from eBiosciences) and isotype controls conjugated with FITC, R‐PE, Pacific Blue, APC, PerCP, PE‐Cy5.5 and e‐Fluor‐450. The activation markers CD25 and CD69 (Tran et al., 2000) were analysed by gating on CD3+ cell subsets for the lymphoid panel and for CD11b+ cells for the myeloid panel with FlowJo 7.6.4 software (TreeStar Inc.). Data were obtained from spleens of five animals per experimental group, without knowledge of the treatments.
Immunohistochemistry analysis of histopathology in CNS
Immunohistochemistry was carried out in the IBIMA imaging Common Research Facilities, by the following protocol: analysis of spinal T‐cell infiltrates, microglial activation, demyelination, oligodendroglial cell state and neuronal number were determined by free‐floating immunostaining of 40 μm slices, using antibodies against CD3 (rabbit polyclonal, 1:100), ionized calcium‐binding adapter molecule 1 (Iba1, goat polyclonal, 1:1000), myelin basic protein (MBP, rat monoclonal, 1:200) (Abcam plc, Cambridge, UK), oligodendrocyte transcription factor (Olig2, rabbit polyclonal, 1:750) and neuronal nuclear antigen (NeuN, mouse monoclonal, 1:500) (Millipore) respectively. For their detection, Extravidin® peroxidase (Sigma‐Aldrich Química, S.L.) and 3,3′‐diaminobenzidine (Sigma‐Aldrich Química, S.L.) methods were used as described previously (Marin‐Bańasco et al., 2014).
Analyses were carried out over 4× and 10× images (three or four images per animal per antibody). The area of demyelination was expressed as the percentage of total myelinated area per section. The inflammatory infiltrates, microglial activation, Olig2 and NeuN positive cells were determined by counting the number of labelled cells in 200 μm2. Data were obtained from three slices of five to six animals per experimental group, without knowledge of the treatments.
Gene expression analysis in the CNS
Total RNA was isolated from 100 mg of lumbar spinal cord and brain, following the instructions of ‘RNeasy Lipid Tissue Mini Kit’ (QIAGEN, Madrid, Spain). RNA concentration and purity were analysed in a NanoDrop 2000 Spectrophotometer (Thermo Fisher Scientific). Total RNA (1 μg) was reverse‐transcribed using cDNA Reverse Transcription Kit (Thermo Fisher Scientific). All samples were run in the same reaction, and the resulting cDNA was controlled for purity and transcription efficiency on the NanoDrop. QRT‐PCR for 14 genes was performed in duplicate using TaqMan® Gene Expression Assay (Thermo Fisher Scientific) and was run on a 7500 Fast Real‐Time PCR System (Thermo Fisher Scientific). The genes tested were SEMA3F (ref: Mm00441325_m1) and VCAM1 (ref: Mm01320970_m1) (both involved in cellular migration capacity); CD74 (ref: Mm00658576_m1), IL‐17 (ref: Mm00439618_m1) and SPP1 (ref: Mm00436767_m1) (all involved in inflammatory response); IFN‐β (ref: Mm00439552_s1), IFNAR2 (ref: Mm00494916_m1), IFN‐γ (ref: Mm01168134_m1), FoxP3 (ref: Mm00475162_m1) and IL‐4 (ref: Mm00445259_m1) (all with immunomodulatory activity); and PDGFA (ref: Mm01205760_m1), CSPG4 (ref: Mm00507257_m1), OLIG2 (ref: Mm01210556_m1) and CASP3 (ref: Mm01195085_m1) (all involved in neuronal damage and regeneration). β‐actin (Act B) (ref: Mm00607939_s1) was used as a reference gene. Differential expression levels of genes were analysed by comparison of ΔΔCt values. Data were obtained from the CNS of five to six animals per experimental group, without knowledge of the treatments.
Statistical analysis
The data are expressed as the mean ± SEM and were analysed with Sigma Stat or SPSS 15.0 (SPSS Inc., IBM Corporation, New York, NY, USA). Nonparametric tests (Kruskal–Wallis followed by Mann–Whitney), when appropriate, were performed to compare the mean values of clinical features of the end points between different groups, flow cytometry analysis, immunohistochemistry and gene expression parameters. Minimal statistical significance was set at P < 0.05. The data and statistical analysis comply with the recommendations on experimental design and analysis in pharmacology (Curtis et al., 2015).
Results
Generation and characterization of gene‐modified MSCs expressing IFN‐β (AdMSC‐IFN‐β)
Three IFN‐β secreting AdMSC lines (AdMSCs‐IFN‐β) were satisfactorily generated from AdMSCs from SJL mice, transduced with lentiviral vectors. AdMSCs subjected to one transduction process were called ‘1Hit’, and those that underwent two or three consecutive transduction processes were named ‘2Hits’ or ‘3Hits’ respectively. Results for these three IFN‐β‐secreting cell lines were compared with those obtained from non‐transduced cells isolated from the same mouse strain.
Quantification of the number of IFN‐β gene integrations in cultured AdMSC‐IFN‐β
The results showed a high number of the transgene copies inserted per cell in the 1Hit line when compared with the values obtained in 2 and 3Hits populations (Table 1). The lowest integration values were observed in the 2Hits cell line.
Table 1.
Integration of CIFNbwp vector in AdMSC cultures
| AdMSCs cultures | Replicates | Ct | [DNA] | Copy per cell |
|---|---|---|---|---|
| IFN‐β 1Hit | R1 | 24.34 | 4.69E+04 | 0.47 |
| R2 | 24.81 | 3.21E+04 | 0.32 | |
| IFN‐β 2Hits | R1 | 26.86 | 6.24E+03 | 0.06 |
| R2 | 29.49 | 7.55E+02 | 0.01 | |
| IFN‐β 3Hits | R1 | 26.56 | 7.90E+03 | 0.08 |
| R2 | 26.99 | 5.58E+03 | 0.06 |
Quantification of the number of IFN‐β genes integrated in cultured AdMSC‐IFN‐β. Ct values and DNA concentration were obtained directly by the Mx3005P (Agilent) after Q‐PCR. The number of copies of the inserted vector per cell was determined by dividing the DNA concentration ([DNA]) obtained by 100 000 starting cells.
Determination of IFN‐β protein levels in AdMSC‐IFN‐β cultures
No detectable levels of IFN‐β were found in supernatants from non‐transduced AdMSC lines, either at 24 or at 48 h (Figure 1). However, all the transfected cells were able to produce IFN‐β at considerable levels, the 1Hit AdMSC‐IFN‐β cell line being the one that secreted the highest levels at 24 h. After 48 h of incubation, IFN‐β production in the 1Hit cell line was reduced to values similar to those obtained from the other two cell lines. No important differences in IFN‐β levels between 2Hits and 3Hits cells were found at 24 or 48 h.
Figure 1.
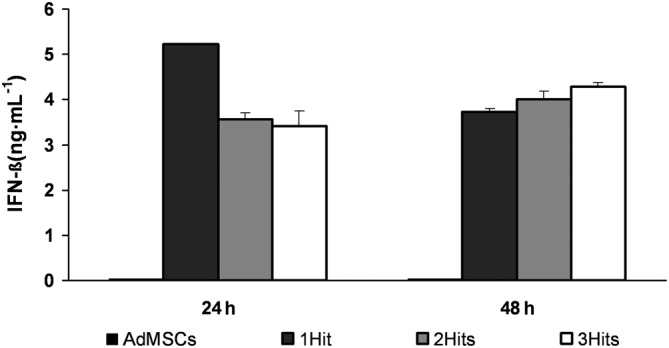
Determination of IFN‐β protein levels in AdMSC‐IFN‐β cultures. Graphs show the IFN‐β concentration (ng·mL−1) in supernatants from AdMSCs (not transduced) and in 1Hit, 2Hits and 3Hits cultures, at 24 and 48 h after being seeded, determined by elisa. IFN‐β concentrations were calculated by extrapolating their absorbance measured at 450 nm in a standard curve. Data represent the mean ± SEM of the three replicates per each of the experimental conditions.
Morphology, cell expansion and surface marker expression of the AdMSCs‐IFN‐β lines
All transduced cell lines displayed a volume, a morphology and a growth rate similar to non‐transduced AdMSCs (please see Supporting Information Figure S1A, B). The analysis of the immunophenotypic profile showed that the expression of haematopoietic markers remained negative and the expression of stromal markers was variably positive in the three IFN‐ß‐secreting cell lines along passages (please see Supporting Information Figure S1C), showing no statistically significant differences when compared with non‐transduced AdMSCs.
Differentiation and transdifferentiation potential of AdMSCs‐IFN‐ß cell lines
In vitro differentiation was induced into adipogenic, osteogenic and chondrogenic lineages at culture p9–p10. Both transduced and non‐transduced cells showed multipotent capacity to differentiate into the three cell lines (please see Supporting Information Figure S2). However, AdMSCs‐IFN‐ß lines showed a reduction in the percentages of differentiated cells into adipocytes (1Hit, 85–90%; 2Hits, 60–65%; 3Hits, 40–45% of differentiated cells vs. 95% of non‐transduced cells) and osteoblasts (1Hit, 90%; 2Hits, 65%; 3Hits, 50% of differentiated cells vs. 95% of non‐transduced cells), which positively correlated with the number of Hits of transduction. No differences were found in their chondrogenic differentiation capacity.
Both the non‐transduced and transduced cells were able to differentiate into neural‐like shape cells, with dendritic structure and Nissl bodies (Figure 2).
Figure 2.
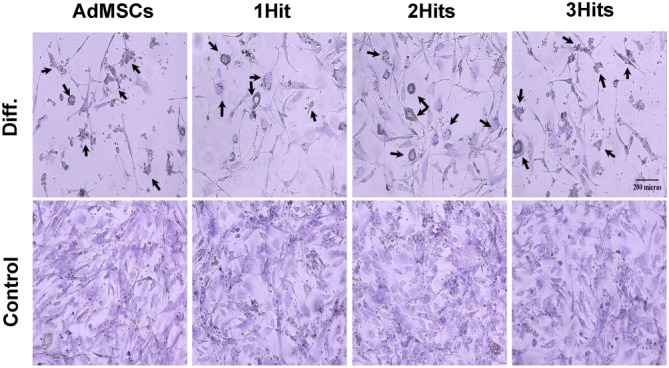
AdMSCs and AdMSCs‐IFN‐ß transdifferentiation. Images show the cell populations at culture passages 7. Cell cultures were maintained in the growth media (Control) or stimulated to differentiate (Diff.) by incubation with the specific media (data were compiled from two independent experiments and in duplicate each time). Neurogenic phenotype was confirmed by cresyl violet staining, which shows up the characteristic granular structures within the soma of neuronal cells, that is, the Nissl bodies, indicated by black arrows (original magnification, 20×).
Once differentiated into cells from mesodermal and ectodermal origin, non‐transduced AdMSCs produced no detectable levels of IFN‐ß, while the 1Hit and 3Hits cell lines continued releasing IFN‐ß at a lower extent than before differentiation. In the 2Hits line, IFN‐ß levels were detected after transdifferentiation but were undetectable after their differentiation into cells of mesodermal origin (data not shown).
Clinical and neuropathological effects of 1Hit transduced AdMSCs
We decided to test the in vivo efficacy of the 1Hit cell line (gene therapy) as it was the cell population with the most similarities to the non‐transduced cells (cell therapy).
It was assumed that AdMSCs isolated from SJL mice and transplanted into RR‐EAE mice was an autologous transplant, as the RR‐EAE animals share the same genetic background, whereas their administration into CP‐EAE mice, with C57‐genetic background, was considered an allogeneic transplant.
Gene therapy as autologous transplant
As previously found (Marin‐Bańasco et al., 2014), autologous cell therapy ameliorated the clinical course of the RR‐EAE (Figure 3A); this was reflected in a significant reduction in the parameters indicating disease severity (Figure 3B) when compared with saline‐treated animals. Gene therapy diminished the MS symptoms in mice; they developed a clinically moderate EAE (Figure 3A), with a significant reduction in the mean maximum score (1.8 ± 0.2 vs. 3.2 ± 0.3) and mean cumulative score (46.1 ± 4.6 vs. 58.4 ± 5.2) when compared with saline‐treated animals (Figure 3B). In addition, gene therapy decreased both the duration of the first and second relapses (4 days vs. 13 days, and 6 days vs. 16 days), and the mean of neurological dysfunction reached in those periods (1.6 ± 0.1 vs. 2.3 ± 0.1; 1.4 ± 0.1 vs. 1.9 ± 0.1, respectively). Moreover, it is important to highlight that gene therapy resulted more effective than cell therapy in reducing all the parameters of aggressiveness, reaching statistically significant differences in the maximum score and the second relapse score when compared between them (# in Figure 3B).
Figure 3.
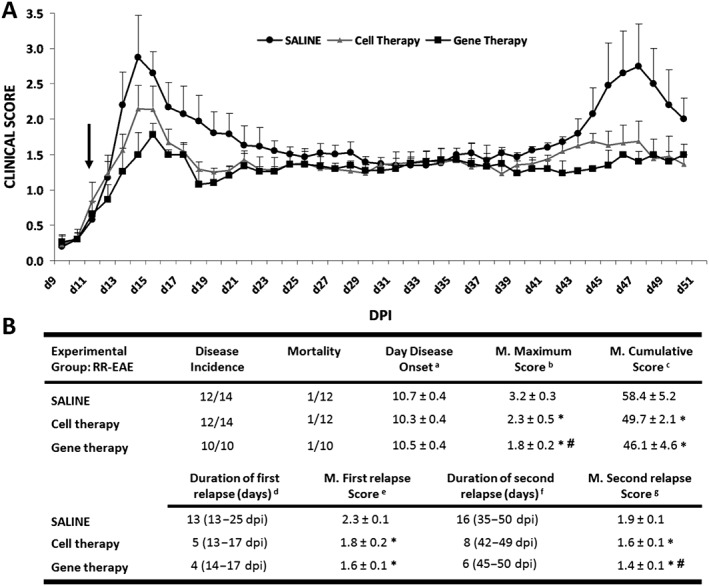
Clinical outcome of RR‐EAE model. (A) Graphs show the clinical score progression of EAE model over the experimental period (n = 11 in RR‐EAE groups treated with saline and with cell therapy and n = 9 in RR‐EAE group treated with gene therapy). Black arrow indicates the day at which the treatment (saline, cell therapy or gene therapy) started. (B) In the tables, the values are presented as mean ± SEM. Statistical analysis to perform single comparisons was carried out using Kruskal–Wallis followed by Mann–Whitney test.*P < 0.05 versus saline; #P < 0.05 cell therapy versus gene therapy. In (B): aDisease onset, first day on which animals showed any clinical symptoms (clinical score ≥0.5). b Mean maximum score, average of the maximum EAE score reached from each mouse over the entire experiment. c Mean cumulative score, average of the accumulated clinical score from each mouse over the entire experiment [50 dpi (days post immunization)]. d,f Duration of the first/second relapse, days of the first/second relapse. The beginning of the relapse was established when the animals had a clinical score of 1.5 or higher and the end when the score returned to that value. e,g Mean of the first/second relapse score, average of the EAE score from each mouse over the mentioned relapsing periods.
After the RR‐EAE mice had been killed at the peak of the second relapse, the spleens were analysed to assess peripheral immune cell populations. At this point, none of the treatments induced differences in the myeloid cell subsets, that is, dendritic cells, macrophages and neutrophils (data not shown), or in the percentages of CD3+, CD4+ and CD8+ T lymphoid subsets with respect to the total splenocyte content (Figure 4A, B; please see Supporting Information Figure S3A). However, the gene therapy group showed a lower degree of activation of the CD4+ T‐cells (CD25+ or CD25+CD69+) when compared with both the saline and cell therapy groups (Figure 4C). The same activation markers within the CD8+ T‐cell subset did not show any significant differences (please see Supporting Information Figure S3B).
Figure 4.
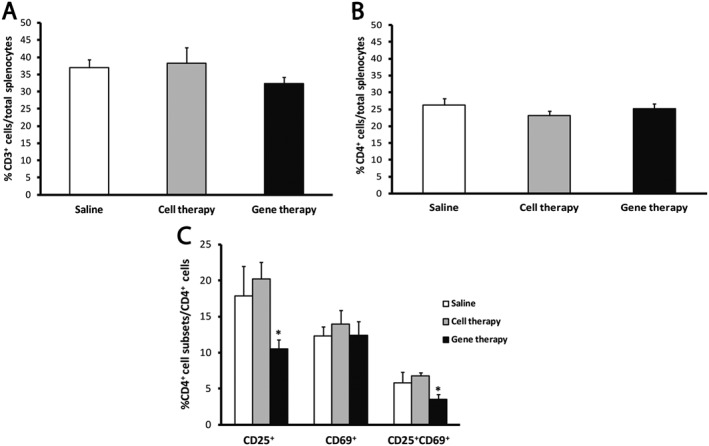
The gene therapy in RR‐EAE mice diminishes the activation level of CD4+ T‐cells. (A, B) The analysis of the splenic content of the RR‐EAE mice shows no differences among the percentage of total T‐cell (A) and the CD4+ T‐cell content (B) with respect to total splenocytes. (C) The analysis of the different activity state subsets shows a significantly lower percentage of CD4+ T‐cells presenting the activation marker CD25 alone or in combination with CD69 in the gene therapy group when compared with vehicle and cell therapy groups. Data were obtained from spleens of five animals per experimental group. The statistical analysis was carried out using Kruskal–Wallis followed by Mann–Whitney test: *P < 0.05 gene therapy versus saline and cell therapy.
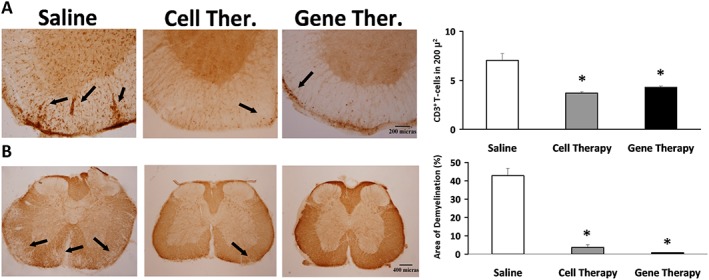
The lumbar spinal cords of each experimental RR‐EAE group were processed to test whether the clinical score amelioration observed after treatments correlated with a reduction in the neurohistopathological damage in CNS. Cell therapy significantly reduced the number of infiltrating CD3+ T‐cells and the total demyelinated area, when compared with saline (Figure 5A, B). Consistent with the clinical data, the effect of gene therapy was very noticeable and similar to that induced by cell therapy, reducing the T‐cell infiltrates (14.5 ± 1) and the percentage of the total demyelinated area in the white matter of the lumbar spinal cord (5.6 ± 0.1%) (Figure 5A, B).
Figure 5.
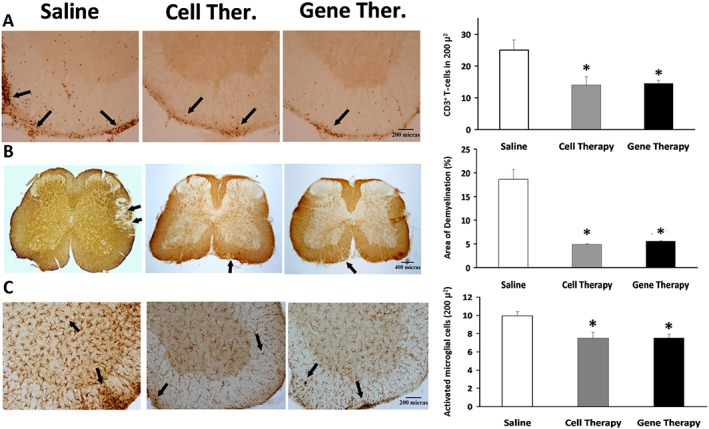
Effects of cell and gene therapies on inflammatory infiltrates, demyelination and activated microglia in the spinal cord of RR‐EAE mice. Representative lumbar spinal cord sections from RR‐EAE mice, stained with (A) anti‐CD3 to detect infiltrated lymphocytes, (B) anti‐MBP to determine the degree of demyelination or (C) anti‐Iba1 antibodies to analyse the activation of microglia, after cell and gene therapies, at the peak of the second relapse (45 dpi) in EAE‐induced animals. Black arrows indicate (A) CD3+ T‐cells, (B) lack of MBP staining and (C) Iba1+ cells. Magnification: (A) 10×, (B) 4× and (C) 10×. Graphs show the mean ± SEM of the number of T‐cells stained with CD3 in 200 μ2 (A); the demyelinated area, characterized by a lack of MBP staining related to the total area (B); or the number of activated microglial cells in 200 μ2 (C). Data were obtained from three sections of five animals per experimental group. The statistical analysis was carried out using Kruskal–Wallis followed by Mann–Whitney test: *P < 0.05 versus saline.
The number of activated microglial cells stained with anti‐Iba1 in the spinal cords, considered as an indicator of inflammation, was clearly diminished after cell therapy and gene therapy in comparison with saline‐treated animals (Figure 5C).
We also tested the efficacy of the experimental therapies on the number of NeuN+ neuronal population in the ventral spinal cord grey area and on the expression of the transcriptional factor Olig2, which is overexpressed in oligodendrocyte precursor cells (OPCs) favouring their differentiation to myelinating mature oligodendrocytes in tissue injury states (Wegener et al., 2015). No statistically significant differences were found in the number of any of the two labelled cell populations after cell or gene therapies when compared with saline (please see Supporting Information Figure S4A).
After the brain and lumbar spinal cord of the RR‐EAE mice had been processed, we determined whether cell or gene therapies modified the expression of genes related to the pathogeny of this disease. Cell therapy reduced the expression level of CASP3 in CNS, whereas gene therapy increased the expression levels of IFN‐ß, IFN‐γ and VCAM genes (Figure 6A). No differences in the expression levels of any of the other genes evaluated were found, irrespective of the treatment administered (data not shown).
Figure 6.
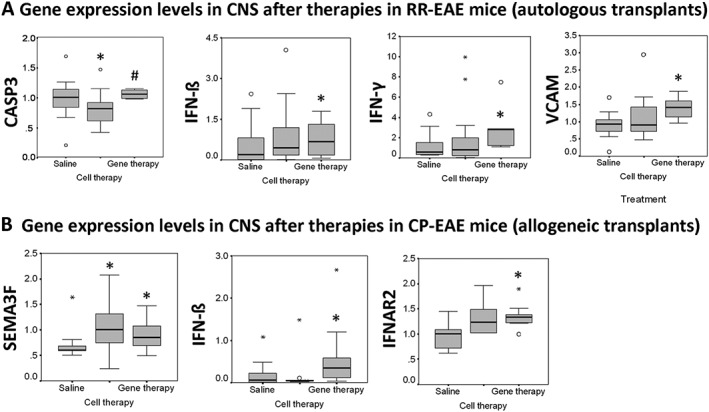
Differential expression of genes in the CNS. (A) Autologous transplants. Graphs show expression levels of CASP3, IFN‐ß, IFN‐γ and VCAM after cell and gene therapies in the CNS of RR‐EAE mice at the peak of the second relapse (45 dpi) (n = 5 animals per experimental group). (B) Allogeneic transplants. Graphs show expression levels of SEMA3F, IFN‐ß and IFNAR2 after cell and gene therapies in the CNS of CP‐EAE mice in the chronic period (35 dpi) (n = 6 animals per experimental group). Mann–Whitney test; *P < 0.05 versus saline; #P < 0.05 cell therapy versus gene therapy.
Gene therapy as allogeneic transplant
The CP‐EAE that developed in mice followed a typical chronic progressive clinical course, characterized by the appearance of one relapse followed by a symptomatic stabilization period (Figure 7A). The allogeneic transplant with cell therapy diminished the clinical course of EAE, as reflected in a moderate reduction in all the end point parameters evaluated (Figure 7A, B) when compared with saline. Gene therapy ameliorated the clinical course of CP‐EAE (Figure 7A, B), showing a significant reduction in the mean maximum score (1.7 ± 0.1 vs. 2.4 ± 0.1), the mean score in chronic phase (1.5 ± 0.1 vs. 2 ± 0.1) and the mean cumulative score (38.6 ± 1.2 vs. 41.4 ± 2.0) when compared with saline. Moreover, gene therapy significantly diminished the chronic phase score when compared to cell therapy (# in Figure 7B).
Figure 7.
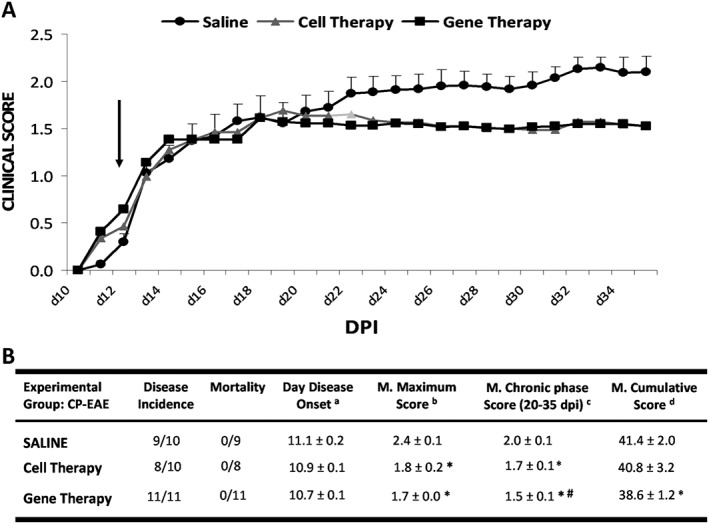
Clinical outcome of CP‐EAE model. (A) Graphs show the clinical score progression of EAE model over the experimental period (n = 9 in RR‐EAE group treated with saline, n = 8 in RR‐EAE group treated with cell therapy and n = 11 in RR‐EAE group treated with gene therapy). Black arrow indicates the day at which the treatment (saline, cell therapy or gene therapy) started. (B) In the table, the values are presented as mean ± SEM. Statistical analysis to perform single comparisons was carried out using Kruskal–Wallis followed by Mann–Whitney test. *P < 0.05 versus saline; #P < 0.05 cell therapy versus gene therapy. a Day disease onset, first day on which animals show any clinical symptoms (clinical score ≥0.5). b Mean maximum score, average of the maximum EAE score reached for each mouse over the entire experiment. c Mean chronic phase score, mean EAE score from each experimental group over the chronic phase in chronic progressive model (from 20 to 35 dpi). d Mean cumulative score, average of the accumulated EAE score from each mouse over the entire experiment (35 dpi). DPI, days post immunization.
CP‐EAE mice were killed in the chronic period. As in the case of RR‐EAE, the analysis of spleens showed no differences between groups among the myeloid cell subsets (data not shown). However, there was a significant decrease in the percentage of activated CD4+ T‐cells in the gene therapy group when compared with the saline‐administered or cell therapy ones (Figure 8). There was a trend towards an increase in the percentage of CD69+ CD4+ T‐cells in the gene therapy group although this did not reach statistical significance. Neither the CD8+ T total cell content nor the CD8+ T‐cell activation showed differences between the groups (please see Supporting Information Figure S3C, D).
Figure 8.
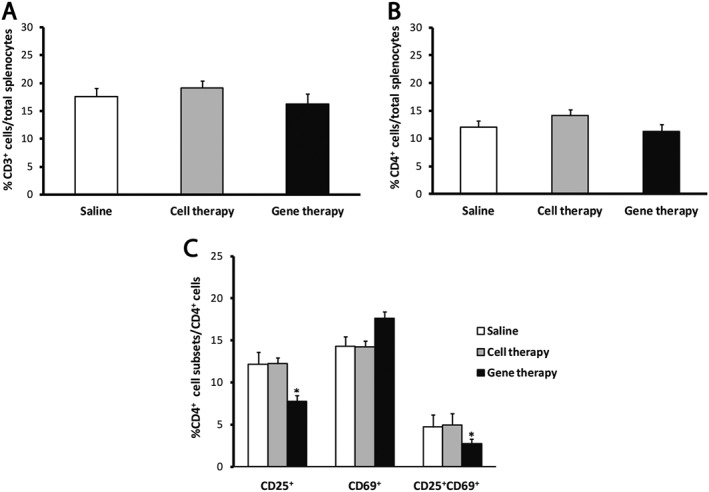
The analysis of the spleens of CR‐EAE mice shows a decrease in the percentage of activated CD4+ T‐cells. (A, B) The percentages of CD3+ cells (A) and CD4+ T‐cells (B) were not different between groups. (C) The gene therapy significantly decreased the percentage of CD4+ T‐cells presenting the CD25 marker alone or in combination with CD69, in comparison with the rest of the groups. Data were obtained from spleens of five animals per experimental group. The statistical analyses were carried out using Kruskal–Wallis followed by Mann–Whitney test: *P < 0.05 gene therapy versus saline and cell therapy.
Immunohistological analysis of spinal cords showed that cell therapy reduced the number of infiltrated CD3+ T‐cells and the total demyelinated area when compared with control animals (Figure 9). After gene therapy, a significant decrease in CD3+ T‐cell infiltrates (Figure 9A) and a dramatic reduction in the demyelinated areas were found (Figure 9B). No statistically significant differences in the other cell populations evaluated (activated microglia, Olig2+ oligodendrocytes nor NeuN+ neurons), after cell or gene therapies were observed, when compared with control animals (please see Supporting Information Figure S4B).
Figure 9.
Effects of cell and gene therapies on inflammatory infiltrates and demyelination in the spinal cord of CP‐EAE mice. Representative lumbar spinal cord sections from CP‐EAE mice, stained with (A) anti‐CD3 to detect infiltrated lymphocytes and (B) anti‐MBP to determine the degree of demyelination after cell and gene therapies, in the chronic period (35 dpi) in EAE‐induced animals. Black arrows indicate(A) CD3+ T‐cells and (B) lack of MBP staining. Magnification: (A) 10× and (B) 4×. Graphs show the mean ± SEM of the number of T‐cells stained with CD3 in 200 μ2 (A) and the demyelinated area, characterized by a lack of MBP staining related to the total area (B). Data were obtained from three sections of six animals per experimental group. The statistical analysis was carried out using Kruskal–Wallis followed by Mann–Whitney test. *P < 0.05 versus saline.
In the chronic period, the analysis of gene expression in the CNS revealed that cell and gene therapies increased the levels of SEMA3F. Although cell therapy did not modify the expression of any of the other genes evaluated (data not shown), gene therapy was able to increase IFN‐ß and IFNAR2 gene expression (Figure 6B).
Discussion
Classical approaches to treat disease progression in MS patients are oriented to fight the inflammatory process that leads to demyelination in the CNS. The drugs currently available are not always effective in all patients and usually require long‐term therapy, which is associated with several adverse effects. In recent years, IFN‐ß gene therapy has appeared as a promising alternative in MS (Makar et al., 2008; Sims et al., 2008; Ryu et al., 2013; Wyse et al., 2014); it offers the advantage of long‐lasting protein expression, an increase in IFN‐ß bioavailability and a reduced frequency of drug administration.
In this context, the use of AdMSCs, endowed with the ability to migrate towards sites of inflammation and injury for the delivery or secretion of therapeutic proteins, offers additional advantages for treating neuroimmune diseases (Steingen et al., 2008; Uccelli et al., 2008; Payne et al., 2013; Cornelissen et al., 2015). Administration of MSCs expressing the vasoactive intestinal peptide prevented progression and reduced symptoms when administered at the peak of EAE disease, correlating with lower levels of inflammation and demyelination and higher neuronal integrity in the CNS (Cobo et al., 2013). In addition, xenogenic transplant of human bone marrow MSCs or mice CD34+ bone marrow MSC, expressing IFN‐ß, exhibited therapeutic effects and prevented the progression of EAE in mice (Ryu et al., 2013; Makar et al., 2008).
Here, we have genetically modified AdMSCs from the SJL mice, to constitutively secrete murine IFN‐ß with a lentivirus‐based delivery system that ensures its long‐term expression (Wyse et al., 2014) with a safe integration profile (Schröder et al., 2002). The genetic manipulation of these AdMSCs did not alter their mesenchymal biological properties nor their differentiation ability, the 1Hit cell line being the one that shares more similarities with non‐transduced cells. Moreover, this line maintained its IFN‐ß‐secreting ability after differentiation and transdifferentiation, clearly increasing the therapeutic potential of these cells.
So in order to test whether AdMSCs‐IFN‐ß (gene therapy) were able to improve the reported therapeutic effects of non‐transduced AdMSCs (cell therapy) (Karussis and Kassis, 2008; Chang et al., 2014; Schwerk et al., 2015; Bonafede et al., 2016), we investigated their efficacy in two experimental models of MS: the RR and CP‐EAE, as there is much controversy over whether the effects of autologous MSCs are indistinguishable (Kassis et al., 2013) or not (Zhang et al., 2014) from the effects induced by allogeneic MSCs in ameliorating the clinical score of EAE.
Serum IFN‐β levels were undetectable in both models after any of the treatments, in accordance with the results reported by others, who also found them undetectable (Makar et al., 2008) or <12 pg·mL−1 (Ryu et al., 2013), below the limit of quantification of our elisa kit. One reason may be that the grafted AdMSCs‐IFN‐ß synthesize and secrete IFN‐β by paracrine mechanisms, and this cytokine diffuses over a relatively short distance.
When administered early in the disease course as an autologous transplant in RR‐EAE mice, AdMSC‐IFN‐ß improved clinical symptoms and reduced all severity parameters. Furthermore, when compared with cell therapy, gene therapy was more effective in reducing maximum score and second relapse score, suggesting that IFN‐β gene expression could be contributing to the increased potency of AdMSCs in modulating the clinical course of EAE and, therefore, its therapeutic efficacy.
No peripheral effects were found after autologous cell therapy on the percentage of the splenic T‐cell populations or on their activation state. Conversely, gene therapy decreased the activation state of the inflammatory CD4+ T‐cell subset when compared with saline and cell therapy, which may represent an amelioration of the peripheral, EAE‐induced inflammatory processes.
With regard to CNS effects, cell therapy reduced both central inflammation and demyelination, corroborating previous reports in EAE models (Ben‐Ami et al., 2011; Marin‐Bańasco et al., 2014). Gene therapy also induced a significant reduction in central inflammation and demyelination, in agreement with others (Makar et al., 2008; Ryu et al., 2013). However, we did not find significant differences when compared with cell therapy, so it remains unclear whether these immunomodulatory effects were due to the constitutive expression of the IFN‐β gene or to the widely known neuroimmunomodulatory properties of AdMSCs.
In contrast, no neuroprotective effects were observed with either cell or gene therapy when compared with controls. The lack of an extensive bibliography on the neuroprotective effects of engineered stem cells suggests that further experiments are needed to determine the mechanisms of action of this therapy.
In addition, we evaluated the effects of autologous therapies over the expression levels of some genes in the CNS. Cell therapy decreased the mRNA expression of CASP3, a proenzyme that requires activation to exert its apoptotic actions, according to the reported ability of MSCs to protect neurons and oligodendrocytes from apoptosis (Uccelli et al., 2008). Gene therapy increased the expression levels of IFN‐ß, IFN‐γ and VCAM. The concomitant presence of IFN‐γ has been reported to increase the immunoregulatory effects of IFN‐β (Axtell et al., 2010) and to enhance the immunosuppressive activity of AdMSCs (Sivanathan et al., 2014). Regarding the increase in VCAM expression, recent studies have shown that this increase in neural stem cells is involved in the regulation of adult neurogenesis (Lehtinen, 2012) and is essential to maintain the neurogenic niche (Kokovay et al., 2012).
When administered early as an allogeneic transplant in CP‐EAE mice, gene therapy induced a moderate clinical course, with a strong decrease in the degree of neurological impairments at the chronic phase and an amelioration of all the indicators of severity evaluated, accompanied by significant changes in both peripheral and central tissues. In addition, gene therapy showed significantly decreased the chronic phase score when compared with cell therapy. Allogeneic cell and gene therapy did not modify the percentage of either the myeloid or the lymphoid splenic content. However, gene therapy significantly diminished the activation state of the CD4+ T‐cell subset, assessed by the expression of CD25, which is associated with a decrease in EAE severity, and also promoted an increase in the percentage of CD69+ CD4+ T‐cells. This could be explained by the recently discovered subset of regulatory CD4+FoxA1+CD47+CD69+PD‐L1hiFoxP3− T‐cells, developed in response to autoimmune inflammation, that are indeed promoted by IFN‐ß (Liu et al., 2014).
In the CNS, both allogeneic cell and gene therapies induced a significant decrease in the perivascular CD3+ T‐cell infiltrates and a strong reduction in the total demyelinated area of spinal cord tissues, with no differences between their effects. These results corroborate those previously reported with allogeneic transplant of human bone marrow‐secreting IFN‐β cells in EAE mice (Ryu et al., 2013).
In contrast, the analysis of the expression of genes revealed that both cell and gene therapies increased the expression of SEMA3F, a chemoattractant molecule related to OPCs migration, which is expressed in MS lesions in a differential way; whereas high levels of SEMA3F have been found in acute active lesions (more inflammatory and more likely to remyelinate), lower levels appeared in chronic active lesions (less inflammatory and less likely to remyelinate) (Boyd et al., 2013). So our results suggest that AdMSCs, regardless of their ability to secrete IFN‐β, could favour the migration of OPCs towards damaged tissues to facilitate several processes orchestrated by them, such as remyelination, even in the chronic period of the CP‐EAE, when the endogenous repair mechanisms seem to be insufficient to repair damage. As expected, allogeneic gene therapy also increased the gene expression of IFN‐ß and its receptor subunit IFNAR2.
Taken together, these results corroborate the known influence of AdMSCs on the inflammatory processes induced by the EAE and the distinct advantage provided by the constitutive expression of IFN‐ß over their beneficial therapeutic effects.
Although during the clinical evaluation of gene therapy in both EAE models, no side effects were observed in mice, a long‐term evaluation of this treatment is warranted to assess the effects of longterm exposure to IFN‐β. One strategy to manage an uncontrolled overexpression of IFN‐β by transfected cells may be the introduction of an inducible promoter to promote IFN‐β expression. For future experiments, our group is working on the development of doxycycline‐inducible lentiviruses expressing IFN‐β, based on the work of Benabdellah et al. (2011). As soon as the administration of doxycycline stops, so will the production of IFN‐β from the transduced MSCs. This system is also able to induce the expression of different levels of the transgene depending on the dose of doxycycline.
In conclusion, we have generated an AdMSC line genetically modified by inserting the IFN‐β gene, which constitutively secretes this cytokine at therapeutic concentrations while displaying no significant changes in the biological and functional properties of MSCs. Gene therapy has proved more effective than cell therapy in ameliorating several clinical parameters and peripheral activation of CD4+ T‐cells in both EAE models, presumably due to the continuous expression of IFN‐β. Although further experiments are needed to clarify whether the positive effects in the CNS are due to the activity of the AdMSCs or to the increased bioavailability of IFN‐β, we propose that gene therapy could be a useful pharmacological tool in preclinical and clinical studies not only for relapses but also for chronic periods of MS, considering the different neuroimmuno‐pathological mechanisms underlying these phases of the disease.
The promising results found in the EAE models with gene therapy supports the continuation of preclinical studies aimed at addressing its safety and toxicity, in order to consider its suitability for a first‐in‐man clinical trial in MS patients. The small differences regarding the efficacy of autologous versus allogeneic gene therapies on several immunohistological parameters, and on the gene expression pattern, seem to be related more to the time course of the disease in which they have been assessed (relapse in RR‐EAE and chronicity in CP‐EAE) rather than to the differences in the genetic background of the animals in which the cells were transplanted.
Author contributions
L.L., F.M. and M.S contributed to the design and concept of the study. C.M.‐B., K.B., C.M.‐J., B.O., I.H.‐G., M.J.P.‐M. and M.S performed the experiments. D.C., F.deC., O.F., L.L., F.M. and M.S analysed and interpreted the data. F.M, D.C. and M.S drafted the manuscript. L.L., O.F. and M.S revised the manuscript.
Conflict of interest
O.F. received honoraria as a consultant to advisory boards and as a chairman or lecturer in meetings and has participated in clinical trials and other research projects promoted by Almirall, Actelion, Allergan, Bayer‐Schering, Biogen‐Idec, Novartis, Merck‐Serono, Roche and Teva. D.C. received honoraria as lecturer in meetings promoted by Novartis. The authors have no other relevant affiliations or financial involvement with any organization or entity with a financial interest in or financial conflict with the subject matter or materials discussed in the manuscript apart from those disclosed.
Declaration of transparency and scientific rigour
This Declaration acknowledges that this paper adheres to the principles for transparent reporting and scientific rigour of preclinical research recommended by funding agencies, publishers and other organisations engaged with supporting research.
Supporting information
Figure S1 A) Images of the AdMSCs and AdMSCs‐IFN‐ß (1Hit, 2 Hits, 3Hits) cultures showing the morphology of the cell populations. Images from passages 6 (P6) to 10 (P10) show that all plastic adherent cell lines have a fibroblastic morphology and expand primarily over the surface of culture dishes (original magnification 10X). B) Doubling times of the AdMSC and AdMSCs‐IFN‐ß populations. Comparison of the growth potential between the untransduced AdMSC and transduced AdMSC populations at passages (P) 6–10. Population doubling times (DT) were calculated using the Schwartz formula. Table shows the mean ± SEM (SEM) of DT values obtained from the cell cultures of three replicate plates of each experimental condition per passage. Data are expressed in h (h). C) Expression of stromal and haematopoietic markers in the AdMSCs and AdMSCs‐IFN‐ß populations by flow cytometry. Graphs show the average (mean) of each CD marker expression percentage value ± SEM at passages 6 to 10. The Mann–Whitney U‐test was performed to compare the expression between cell cultures. No statistically significant differences were found between groups.
Figure S2 AdMSCs and AdMSCs‐IFN‐ß differentiation. Images show the cell populations at culture passages 7 (P7). Cell cultures were maintained in the growth media (Control) and stimulated to differentiation (Diff.) by incubation with the specific media. A) Adipogenic induction. Adipogenic phenotype was confirmed by staining cells with an Oil Red‐O solution and counterstaining with haematoxylin and eosin. Adipocytes showed a high percentage of round cells with lipid vesicles occupying the cytoplasm, which is consistent with the phenotype of mature adipocytes (original magnification, 20×). B) Osteogenic induction. Osteoclast led to dense nodules from which radiated highly elongated spindle‐shaped cells, and were characterized by Alizarin Red staining, which stain cell calcium deposits (original magnification, 10×). C) Chondrogenic induction. Differentiated chondrocytes were positively stained by Alcian blue, specific for the glycosaminoglycans in cartilage matrix (original magnification, 10×).
Figure S3 Analysis of the CD8+ T‐cell splenic content. A‐D) No differences were found between groups in the percentage of CD8+ T‐cell content respect to total splenocytes (A, C), and between the different CD8+ cell subsets (B, D), both in RR‐EAE (A‐B) and CP‐EAE mice (C‐D). Kruskal–Wallis test was used for the statistical analyses.
Figure S4 Effects of Cell and Gene therapies in neurohistopathological damage in CNS. A) As autologous transplant. Effects in Olig2 positive oligodendrocyte populations and NeuN positive neural population, in the spinal cord of RR‐EAE mice at the peak of the second relapse (45 dpi). Graphs show the mean ± SEM of the number of Olig2 and NeuN positive cells in 200 μ2 from 3–4 slices of 5–6 animals per experimental group. B) As allogenic transplant. Effects in activated microglia, Olig2 positive oligodendrocyte populations and NeuN positive neural population, in the spinal cord of CP‐EAE mice at chronification period (35 dpi). Graphs show the mean ± SEM of the number of activated microglial cells, Olig2 and NeuN positive cells in 200 μ2 from3 slices of 5–6 animals per experimental group. Kruskal–Wallis test was used for the statistical analyses.
Figure S1. Supporting info item
Figure S2. Supporting info item
Figure S3. Supporting info item
Figure S4. Supporting info item
Figure S4. Supporting info item
Acknowledgements
We gratefully acknowledge Ana I. Gómez‐Conde and Lourdes Sánchez‐Salido from IBIMA Image ECAI (Common Research Facilities) for their technical assistance in the immunohistological procedures, Iris Sánchez‐Raya for her technical assistance and Dr Virginia Vila‐del Sol for her help with the flow cytometry analysis. This work was supported by Fondo de Investigaciones Sanitarias ISCIII (Spain) and Fondo Europeo de Desarrollo Regional (FEDER) from the European Union through the research grants PI12/01097 and PI15/00963 and ISCIII Red de Terapia Celular TerCel RD12/0019/0006 to F.M., by the Consejería de Economía, Innovación, Ciencia y Empleo, Junta de Andalucía‐FEDER/Fondo de Cohesion Europeo (FSE) de Andalucía through the research grants P09‐CTS‐04532, PI‐57069 and PAIDI‐Bio‐326 to F.M. and PI‐0160/2012 to K.B. M.J.P.‐M. has been supported by grants from Red Temática de InvestigaciónCooperativa Red Española de Esclerosis Múltiple REEM (RD07/0060 and RD12/0032). B.O. is financed by a contract from Excelent Project CTS‐7670/11 from Consejería de Economía, Innovación, Ciencia y Empleo (Junta de Andalucía).
Marin‐Bañasco, C. , Benabdellah, K. , Melero‐Jerez, C. , Oliver, B. , Pinto‐Medel, M. J. , Hurtado‐Guerrero, I. , de Castro, F. , Clemente, D. , Fernández, O. , Martin, F. , Leyva, L. , and Suardíaz, M. (2017) Gene therapy with mesenchymal stem cells expressing IFN‐ß ameliorates neuroinflammation in experimental models of multiple sclerosis. British Journal of Pharmacology, 174: 238–253. doi: 10.1111/bph.13674.
References
- Alexander SPH, Kelly E, Marrion N, Peters JA, Benson HE, Faccenda E et al. (2015a). The Concise Guide to PHARMACOLOGY 2015/16: Overview. Br J Pharmacol 172: 5729–5143. [DOI] [PMC free article] [PubMed] [Google Scholar]
- Alexander SPH, Fabbro D, Kelly E, Marrion N, Peters JA, Benson HE et al. (2015b). The Concise Guide to PHARMACOLOGY 2015/16: Catalytic receptors. Br J Pharmacol 172: 5979–6023. [DOI] [PMC free article] [PubMed] [Google Scholar]
- Alexander SPH, Fabbro D, Kelly E, Marrion N, Peters JA, Benson HE et al. (2015c). The Concise Guide to PHARMACOLOGY 2015/16: Enzymes. Br J Pharmacol 172: 6024–6109. [DOI] [PMC free article] [PubMed] [Google Scholar]
- Axtell RC, de Jong BA, Boniface K, van der Voort LF, Bhat R, De Sarno P et al. (2010). T helper type 1 and 17 cells determine efficacy of interferon‐beta in multiple sclerosis and experimental encephalomyelitis. Nat Med 16: 406–412. [DOI] [PMC free article] [PubMed] [Google Scholar]
- Bar‐Or A, Darlington PJ (2011). The immunology of MS In: Cohen JA, Rudick RA. (eds). MS Therapeutics, Vol. 4 Cambridge University Press: Cambridge, UK. [Google Scholar]
- Ben‐Ami E, Berrih‐Aknin S, Miller A (2011). Mesenchymal stem cells as an immunomodulatory therapeutic strategy for autoimmune diseases. Autoimmun Rev 10: 410–415. [DOI] [PubMed] [Google Scholar]
- Benabdellah K, Cobo M, Muñoz P, Toscano MG, Martin F (2011). Development of an all‐in‐one lentiviral vector system based on the original TetR for the easy generation of Tet‐ON cell lines. PLoS One 6: e23734. [DOI] [PMC free article] [PubMed] [Google Scholar]
- Benabdellah K, Gutierrez‐Guerrero A, Cobo M, Muńoz P, Martin F (2014). A chimeric HS4‐SAR insulator (IS2) that prevents silencing and enhances expression of lentiviral vectors in pluripotent stem cells. PLoS One 9: e84268. [DOI] [PMC free article] [PubMed] [Google Scholar]
- Bonafede R, Scambi I, Peroni D, Potrich V, Boschi F, Benati D et al. (2016). Exosome derived from murine adipose‐derived stromal cells: Neuroprotective effect on in vitro model of amyotrophic lateral sclerosis. Exp Cell Res 340: 150–158. [DOI] [PubMed] [Google Scholar]
- Boyd A, Zhang H, Williams A (2013). Insufficient OPC migration into demyelinated lesions is a cause of poor remyelination in MS and mouse models. Acta Neuropathol 125: 841–859. [DOI] [PMC free article] [PubMed] [Google Scholar]
- Chang KA, Lee JH, Suh YH (2014). Therapeutic potential of human adipose‐derived stem cells in neurological disorders. J Pharmacol Sci 126: 293–301. [DOI] [PubMed] [Google Scholar]
- Cobo M, Anderson P, Benabdellah K, Toscano MG, Muñoz P, Garcia‐Perez A et al. (2013). Mesenchymal stem cells expressing vasoactive intestinal peptide ameliorate symptoms in a model of chronic multiple sclerosis. Cell Transplant 22: 839–854. [DOI] [PubMed] [Google Scholar]
- Cohen JA (2013). Mesenchymal stem cell transplantation in multiple sclerosis. J Neurol Sci 333: 43–49. [DOI] [PMC free article] [PubMed] [Google Scholar]
- Constantin G, Marconi S, Rossi B, Angiari S, Calderan L, Anghileri E et al. (2009). Adipose‐derived mesenchymal stem cells ameliorate chronic experimental autoimmune encephalomyelitis. Stem Cells 27: 2624–2635. [DOI] [PubMed] [Google Scholar]
- Cornelissen AS, Maijenburg MW, Nolte MA, Voermans C (2015). Organ‐specific migration of mesenchymal stromal cells: who, when, where and why? Immunol Lett 168: 159–169. [DOI] [PubMed] [Google Scholar]
- Curtis MJ, Bond RA, Spina D, Ahluwalia A, Alexander SP, Giembycz MA et al. (2015). Experimental design and analysis and their reporting: new guidance for publication in BJP. Br J Pharmacol 172: 3461–3471. [DOI] [PMC free article] [PubMed] [Google Scholar]
- Darlington PJ, Boivin MN, Bar‐Or A (2011). Harnessing the therapeutic potential of mesenchymal stem cells in multiple sclerosis. Expert Rev Neurother 11: 1295–1303. [DOI] [PMC free article] [PubMed] [Google Scholar]
- Dominici M, Le Blanc K, Mueller I, Slaper‐Cortenbach I, Marini F, Krause D et al. (2006). Minimal criteria for defining multipotent mesenchymal stromal cells. The International Society for Cellular Therapy position statement. Cytotherapy 8: 315–317. [DOI] [PubMed] [Google Scholar]
- Freedman MS, Bar‐Or A, Atkins HL, Karussis D, Frassoni F, Lazarus H et al. (2010). The therapeutic potential of mesenchymal stem cell transplantation as a treatment for multiple sclerosis: consensus report of the International MSCT Study Group. Mult Scler 16: 503–510. [DOI] [PubMed] [Google Scholar]
- Friese MA, Montalban X, Willcox N, Bell JI, Martin R, Fugger L (2006). The value of animal models for drug development in multiple sclerosis. Brain 129: 1940–1952. [DOI] [PubMed] [Google Scholar]
- Galligan CL, Pennell LM, Murooka TT, Baig E, Majchrzak‐Kita B, Rahbar R et al. (2010). Interferon‐beta is a key regulator of proinflammatory events in experimental autoimmune encephalomyelitis. Mult Scler 16: 1458–1478. [DOI] [PubMed] [Google Scholar]
- Garg N, Smith TW (2015). An update on immunopathogenesis, diagnosis, and treatment of multiple sclerosis. Brain Behav 5: e00362. [DOI] [PMC free article] [PubMed] [Google Scholar]
- Ji JF, He BP, Dheen ST, Tay SS (2004). Interactions of chemokines and chemokine receptors mediate the migration of mesenchymal stem cells to the impaired site in the brain after hypoglossal nerve injury. Stem Cells 22: 415–427. [DOI] [PubMed] [Google Scholar]
- Karussis D, Kassis I (2008). The potential use of stem cells in multiple sclerosis: an overview of the preclinical experience. Clin Neurol Neurosurg 110: 889–896. [DOI] [PubMed] [Google Scholar]
- Kassis I, Petrou P, Halimi M, Karussis D (2013). Mesenchymal stem cells (MSC) derived from mice with experimental autoimmune encephalomyelitis (EAE) suppress EAE and have similar biological properties with MSC from healthy donors. Immunol Lett 154: 70–76. [DOI] [PubMed] [Google Scholar]
- Kieseier BC (2011). The mechanism of action of interferon‐beta in relapsing multiple sclerosis. CNS Drugs 25: 491–502. [DOI] [PubMed] [Google Scholar]
- Kilkenny C, Browne W, Cuthill IC, Emerson M, Altman DG (2010). Animal research: reporting in vivo experiments: the ARRIVE guidelines. Br J Pharmacol 160: 1577–1579. [DOI] [PMC free article] [PubMed] [Google Scholar]
- Kokovay E, Wang Y, Kusek G, Wurster R, Lederman P, Lowry N et al. (2012). VCAM1 is essential to maintain the structure of the SVZ niche and acts as an environmental sensor to regulate SVZ lineage progression. Cell Stem Cell 11: 220–230. [DOI] [PubMed] [Google Scholar]
- Krampera M, Glennie S, Dyson J, Scott D, Laylor R, Simpson E et al. (2003). Bone marrow mesenchymal stem cells inhibit the response of naive and memory antigen‐specific T cells to their cognate peptide. Blood 101: 3722–3729. [DOI] [PubMed] [Google Scholar]
- Le Blanc K, Tammik L, Sundberg B, Haynesworth SE, Ringden O (2003). Mesenchymal stem cells inhibit and stimulate mixed lymphocyte cultures and mitogenic responses independently of the major histocompatibility complex. Scand J Immunol 57: 11–20. [DOI] [PubMed] [Google Scholar]
- Lehtinen MK (2012). Adult neurogenesis: VCAM stems the tide. Cell Stem Cell 11: 137–138. [DOI] [PMC free article] [PubMed] [Google Scholar]
- Liu Y, Carlsson R, Comabella M, Wang J, Kosicki M, Carrion B et al. (2014). FoxA1 directs the lineage and immunosuppressive properties of a novel regulatory T cell population in EAE and MS. Nat Med 20: 272–282. [DOI] [PubMed] [Google Scholar]
- Makar TK, Trisler D, Bever CT, Goolsby JE, Sura KT, Balasubramanian S et al. (2008). Stem cell based delivery of IFN‐beta reduces relapses in experimental autoimmune encephalomyelitis. J Neuroimmunol 196: 67–81. [DOI] [PubMed] [Google Scholar]
- Marin‐Bańasco C, Suardiaz Garcia M, Hurtado Guerrero I, Maldonado Sįnchez R, Estivill‐Torrus G, Leyva Fernandez L et al. (2014). Mesenchymal properties of SJL mice‐stem cells and their efficacy as autologous therapy in a relapsing–remitting multiple sclerosis model. Stem Cell Res Ther 5: 134. [DOI] [PMC free article] [PubMed] [Google Scholar]
- Martin‐Saavedra FM, Gonzalez‐Garcia C, Bravo B, Ballester S (2008). Beta interferon restricts the inflammatory potential of CD4+ cells through the boost of the Th2 phenotype, the inhibition of Th17 response and the prevalence of naturally occurring T regulatory cells. Mol Immunol 45: 4008–4019. [DOI] [PubMed] [Google Scholar]
- McGrath JC, Lilley E (2015). Implementing guidelines on reporting research using animals (ARRIVE etc.): new requirements for publication in BJP. Br J Pharmacol 172: 3189–3193. [DOI] [PMC free article] [PubMed] [Google Scholar]
- Mizuno H, Tobita M, Uysal AC (2012). Concise review: adipose‐derived stem cells as a novel tool for future regenerative medicine. Stem Cells 30: 804–810. [DOI] [PubMed] [Google Scholar]
- Moline‐Velazquez V, Cuervo H, Vila‐Del Sol V, Ortega MC, Clemente D, de Castro F (2011). Myeloid‐derived suppressor cells limit the inflammation by promoting T lymphocyte apoptosis in the spinal cord of a murine model of multiple sclerosis. Brain Pathol 21: 678–691. [DOI] [PMC free article] [PubMed] [Google Scholar]
- Moloney TC, Rooney GE, Barry FP, Howard L, Dowd E (2010). Potential of rat bone marrow‐derived mesenchymal stem cells as vehicles for delivery of neurotrophins to the Parkinsonian rat brain. Brain Res 1359: 33–43. [DOI] [PubMed] [Google Scholar]
- Moreno B, Espejo C, Mestre L, Suardiaz M, Clemente D, de Castro F et al. (2012). Guidelines on the appropriate use of animal models for developing therapies in multiple sclerosis. Rev Neurol 54: 114–124. [PubMed] [Google Scholar]
- Nasef A, Mathieu N, Chapel A, Frick J, François S, Mazurier C et al. (2007). Immunosuppressive effects of mesenchymal stem cells: involvement of HLA‐G. Transplantation 84: 231–237. [DOI] [PubMed] [Google Scholar]
- Newman RE, Yoo D, LeRoux MA, Danilkovitch‐Miagkova A (2009). Treatment of inflammatory diseases with mesenchymal stem cells. Inflamm Allergy Drug Targets 8: 110–123. [DOI] [PubMed] [Google Scholar]
- Payne NL, Sun G, McDonald C, Layton D, Moussa L, Emerson‐Webber A et al. (2013). Distinct immunomodulatory and migratory mechanisms underpin the therapeutic potential of human mesenchymal stem cells in autoimmune demyelination. Cell Transplant 22: 1409–1425. [DOI] [PubMed] [Google Scholar]
- Platanias LC (2005). Mechanisms of type‐I‐ and type‐II‐interferon‐mediated signalling. Nat Rev Immunol 5: 375–386. [DOI] [PubMed] [Google Scholar]
- Ponte AL, Marais E, Gallay N, Langonne A, Delorme B, Herault O et al. (2007). The in vitro migration capacity of human bone marrow mesenchymal stem cells: comparison of chemokine and growth factor chemotactic activities. Stem Cells 25: 1737–1745. [DOI] [PubMed] [Google Scholar]
- Ryu CH, Park KY, Hou Y, Jeong CH, Kim SM, Jeun SS (2013). Gene therapy of multiple sclerosis using interferon ß‐secreting human bone marrow mesenchymal stem cells. Biomed Res Int 2013: 696738. [DOI] [PMC free article] [PubMed] [Google Scholar]
- Schröder AR, Shinn P, Chen H, Berry C, Ecker JR, Bushman F (2002). HIV‐1 integration in the human genome favors active genes and local hotspots. Cell 110: 521–529. [DOI] [PubMed] [Google Scholar]
- Schwerk A, Altschüler J, Roch M, Gossen M, Winter C, Berg J et al. (2015). Adipose‐derived human mesenchymal stem cells induce long‐term neurogenic and anti‐inflammatory effects and improve cognitive but not motor performance in a rat model of Parkinson's disease. Regen Med 10: 431–446. [DOI] [PubMed] [Google Scholar]
- Severa M, Rizzo F, Giacomini E, Salvetti M, Coccia EM (2015). IFN‐ß and multiple sclerosis: cross‐talking of immune cells and integration of immunoregulatory networks. Cytokine Growth Factor Rev 26: 229–239. [DOI] [PubMed] [Google Scholar]
- Sims TL, Hamner JB, Bush RA, Williams RF, Zhou J, Kim SU et al. (2008). Neural progenitor cell‐mediated delivery of interferon beta improves neuroblastoma response to cyclophosphamide. Ann Surg Oncol 15: 3259–3267. [DOI] [PMC free article] [PubMed] [Google Scholar]
- Sivanathan KN, Gronthos S, Rojas‐Canales D, Thierry B, Coates PT (2014). Interferon‐gamma modification of mesenchymal stem cells: implications of autologous and allogeneic mesenchymal stem cell therapy in allotransplantation. Stem Cell Rev 10: 351–375. [DOI] [PubMed] [Google Scholar]
- Southan C, Sharman JL, Benson HE, Faccenda E, Pawson AJ, Alexander SP et al. (2016). The IUPHAR/BPS Guide to PHARMACOLOGY in 2016: towards curated quantitative interactions between 1300 protein targets and 6000 ligands. Nucleic Acids Res 44: D1054–D1068. [DOI] [PMC free article] [PubMed] [Google Scholar]
- Steingen C, Brenig F, Baumgartner L, Schmidt J, Schmidt A, Bloch W (2008). Characterization of key mechanisms in transmigration and invasion of mesenchymal stem cells. J Mol Cell Cardiol 44: 1072–1084. [DOI] [PubMed] [Google Scholar]
- Steinman L, Zamvil SS (2006). How to successfully apply animal studies in experimental allergic encephalomyelitis to research on multiple sclerosis. Ann Neurol 60: 12–21. [DOI] [PubMed] [Google Scholar]
- Toscano MG, Frecha C, Ortega C, Santamaría M, Martin F, Molina IJ (2004). Efficient lentiviral transduction of Herpesvirus saimiri immortalized T cells as a model for gene therapy in primary immunodeficiencies. Gene Ther 11: 956–961. [DOI] [PubMed] [Google Scholar]
- Tran EH, Prince EN, Owens T (2000). IFN‐gamma shapes immune invasion of the central nervous system via regulation of chemokines. J Immunol 164: 2759–2768. [DOI] [PubMed] [Google Scholar]
- Tyndall A, Walker UA, Cope A, Dazzi F, De Bari C, Fibbe W et al. (2007). Immunomodulatory properties of mesenchymal stem cells: a review based on an interdisciplinary meeting held at the Kennedy Institute of Rheumatology Division, London, UK, 31 October 2005. Arthritis Res Ther 9: 301. [DOI] [PMC free article] [PubMed] [Google Scholar]
- Uccelli A, Moretta L, Pistoia V (2006). Immunoregulatory function of mesenchymal stem cells. Eur J Immunol 36: 2566–2573. [DOI] [PubMed] [Google Scholar]
- Uccelli A, Moretta L, Pistoia V (2008). Mesenchymal stem cells in health and disease. Nat Rev Immunol 8: 726–736. [DOI] [PubMed] [Google Scholar]
- Walther EU, Hohlfeld R (1999). Multiple sclerosis: side effects of interferon beta therapy and their management. Neurology 53: 1622–1627. [DOI] [PubMed] [Google Scholar]
- Wegener A, Deboux C, Bachelin C, Frah M, Kerninon C, Seilhean D et al. (2015). Gain of Olig2 function in oligodendrocyte progenitors promotes remyelination. Brain 138: 120–135. [DOI] [PMC free article] [PubMed] [Google Scholar]
- Wyse RD, Dunbar GL, Rossignol J (2014). Use of genetically modified mesenchymal stem cells to treat neurodegenerative diseases. Int J Mol Sci 15: 1719–1745. [DOI] [PMC free article] [PubMed] [Google Scholar]
- Zappia E, Casazza S, Pedemonte E, Benvenuto F, Bonanni I, Gerdoni E et al. (2005). Mesenchymal stem cells ameliorate experimental autoimmune encephalomyelitis inducing T‐cell anergy. Blood 106: 1755–1761. [DOI] [PubMed] [Google Scholar]
- Zhang X, Bowles AC, Semon JA, Scruggs BA, Zhang S, Strong AL et al. (2014). Transplantation of autologous adipose stem cells lacks therapeutic efficacy in the experimental autoimmune encephalomyelitis model. PLoS One 9: e85007. [DOI] [PMC free article] [PubMed] [Google Scholar]
- Zufferey R, Dull T, Mandel RJ, Bukovsky A, Quiroz D, Naldini L et al. (1998). Self‐inactivating lentivirus vector for safe and efficient in vivo gene delivery. J Virol 72: 9873–9880. [DOI] [PMC free article] [PubMed] [Google Scholar]
Associated Data
This section collects any data citations, data availability statements, or supplementary materials included in this article.
Supplementary Materials
Figure S1 A) Images of the AdMSCs and AdMSCs‐IFN‐ß (1Hit, 2 Hits, 3Hits) cultures showing the morphology of the cell populations. Images from passages 6 (P6) to 10 (P10) show that all plastic adherent cell lines have a fibroblastic morphology and expand primarily over the surface of culture dishes (original magnification 10X). B) Doubling times of the AdMSC and AdMSCs‐IFN‐ß populations. Comparison of the growth potential between the untransduced AdMSC and transduced AdMSC populations at passages (P) 6–10. Population doubling times (DT) were calculated using the Schwartz formula. Table shows the mean ± SEM (SEM) of DT values obtained from the cell cultures of three replicate plates of each experimental condition per passage. Data are expressed in h (h). C) Expression of stromal and haematopoietic markers in the AdMSCs and AdMSCs‐IFN‐ß populations by flow cytometry. Graphs show the average (mean) of each CD marker expression percentage value ± SEM at passages 6 to 10. The Mann–Whitney U‐test was performed to compare the expression between cell cultures. No statistically significant differences were found between groups.
Figure S2 AdMSCs and AdMSCs‐IFN‐ß differentiation. Images show the cell populations at culture passages 7 (P7). Cell cultures were maintained in the growth media (Control) and stimulated to differentiation (Diff.) by incubation with the specific media. A) Adipogenic induction. Adipogenic phenotype was confirmed by staining cells with an Oil Red‐O solution and counterstaining with haematoxylin and eosin. Adipocytes showed a high percentage of round cells with lipid vesicles occupying the cytoplasm, which is consistent with the phenotype of mature adipocytes (original magnification, 20×). B) Osteogenic induction. Osteoclast led to dense nodules from which radiated highly elongated spindle‐shaped cells, and were characterized by Alizarin Red staining, which stain cell calcium deposits (original magnification, 10×). C) Chondrogenic induction. Differentiated chondrocytes were positively stained by Alcian blue, specific for the glycosaminoglycans in cartilage matrix (original magnification, 10×).
Figure S3 Analysis of the CD8+ T‐cell splenic content. A‐D) No differences were found between groups in the percentage of CD8+ T‐cell content respect to total splenocytes (A, C), and between the different CD8+ cell subsets (B, D), both in RR‐EAE (A‐B) and CP‐EAE mice (C‐D). Kruskal–Wallis test was used for the statistical analyses.
Figure S4 Effects of Cell and Gene therapies in neurohistopathological damage in CNS. A) As autologous transplant. Effects in Olig2 positive oligodendrocyte populations and NeuN positive neural population, in the spinal cord of RR‐EAE mice at the peak of the second relapse (45 dpi). Graphs show the mean ± SEM of the number of Olig2 and NeuN positive cells in 200 μ2 from 3–4 slices of 5–6 animals per experimental group. B) As allogenic transplant. Effects in activated microglia, Olig2 positive oligodendrocyte populations and NeuN positive neural population, in the spinal cord of CP‐EAE mice at chronification period (35 dpi). Graphs show the mean ± SEM of the number of activated microglial cells, Olig2 and NeuN positive cells in 200 μ2 from3 slices of 5–6 animals per experimental group. Kruskal–Wallis test was used for the statistical analyses.
Figure S1. Supporting info item
Figure S2. Supporting info item
Figure S3. Supporting info item
Figure S4. Supporting info item
Figure S4. Supporting info item