Abstract
The reversible thermal denaturation of apo α-lactalbumin (α-LA) and lysozyme was measured in the absence and presence of multiple concentrations of each of seven saccharides (glucose, galactose, fructose, sucrose, trehalose, raffinose, and stachyose) at multiple pH values. It was observed that with increasing pH, the absolute stability of α-LA decreased, whereas the stabilizing effect per mole of all saccharides increased, and that the absolute stability of lysozyme increased, whereas the stabilizing effect per mole of all saccharides decreased. All of the data may be accounted for quantitatively by straightforward electrostatic generalization of a previously introduced coarse-grained model for stabilization of proteins by sugars.
Keywords: conformational change, oligosaccharide, protein stability, protein structure, thermodynamics, excluded volume, osmolytes, thermal stability
Introduction
One of the mechanisms utilized by living organisms to combat stressful changes in external conditions involves accumulation of osmolytes as stress protectants (1–4). Osmolytes are compatible organic solutes that provide stability to macromolecules and other cell organelles in vitro and in vivo, and maintain the normal functioning of organism during stress conditions (1, 5–7). On the basis of their chemical nature, they are classified into amino acids and their derivatives, methylamines, polyols, and sugars (1). A relatively small number of such compounds is commonly used by a wide range of organisms (8). The disaccharide trehalose accumulates in yeast in response to thermal stress (9), and yeast mutants lacking the ability to synthesize trehalose exhibit reduced tolerance to heat shock (10). Trehalose at physiologically relevant concentrations has been shown to stabilize proteins against thermal denaturation in vitro and in vivo (11, 12). On the basis of in vitro studies, it has been proposed that unfavorable interaction of stabilizing osmolytes with the peptide backbone leads to their preferential exclusion from protein surface or preferential hydration of the protein. This preferential interaction alters the thermodynamic equilibrium between the native (N) and unfolded (U) states (i.e. N ↔ U) of the protein by shifting it toward that state with the least exposed surface, i.e. the native state (13–18).
In our efforts to understand how osmolytes mediate these effects, we recently determined the impact of seven different saccharides as representative osmolytes on the thermal stability of two model proteins, apo α-lactalbumin (α-LA)3 and lysozyme, at pH 7.0, and were able to quantitatively account for the relative stabilization of each protein by each sugar with a single temperature-independent parameter (19). It was noted that each sugar stabilized α-LA to a greater extent than lysozyme, despite their nearly identical molar masses and sizes of their native states. We therefore hypothesized that conformational differences between the proteins due to differences in electrostatic interactions between charged residues in the native and unfolded states were the reason for the difference in sugar-mediated stabilization. To test this “electrostatic hypothesis,” we have assessed the pH dependence of reversible thermal denaturation of apo α-LA and lysozyme at multiple concentrations of each of the seven saccharides. It was found that although the absolute thermal stability of each protein decreased as the pH of the solution moved away from the protein pI, the stabilizing effect of added sugar at that pH increased. Both observations may be accounted for by a straightforward generalization of the previously proposed coarse-grained model for stabilization of proteins by sugars (19). The generalized model, depicted schematically in Fig. 1, is described fully in the section “Data Analysis.” It will be shown below that the difference in the pH dependence of thermal stabilization between the two proteins may be accounted for by an increase in the net charge of each protein resulting in a corresponding increase in volume excluded to sugar by the unfolded state.
FIGURE 1.
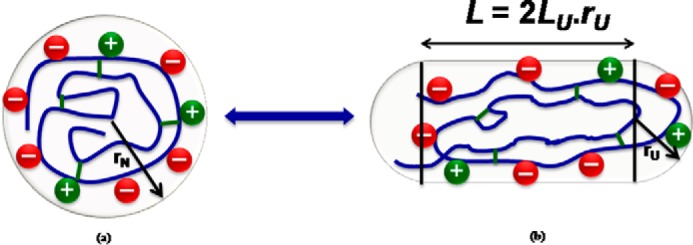
Schematic diagram of spherical native state (a) and spherocylindrical unfolded state (b) of a protein at a pH value away from its pI. LU represents the cylindrical length to diameter ratio (L/2r), and the (+) and (−) signs represent the charged residues of the protein.
Results
Thermal unfolding experiments were performed on α-LA and lysozyme solutions in the presence of different saccharides of various degrees of oligomerization: mono- (glucose, galactose, and fructose), di- (sucrose and trehalose), tri- (raffinose), and tetra- (stachyose) saccharides at different pH values. Thermal denaturations of α-LA were measured at pH values of 7.0, 6.5, 6.0, 5.5, and 5.0, whereas, in case of lysozyme, the pH values were 7.0, 6.0, 5.0, 4.0, and 3.0. Thermal denaturation curves of both proteins under all conditions are plotted in supplemental Figs. S1–S6. Reversibility of denaturation was checked as described under “Experimental Procedures,” and was found that under the conditions of our experiments, thermal unfolding of both proteins was reversible for all sugar concentrations at every pH of measurement.
Figs. 2 and 3 are plots of the experimental thermal denaturation data obtained from measurements on α-LA and lysozyme in the absence and presence of different concentrations of glucose at different pH values. Thermal denaturation curves of both proteins in the presence of other sugars at different pH values are qualitatively similar and are plotted in the supplemental information. The temperature dependence of Δϵ measured in the presence of multiple concentrations of glucose at a given pH value were globally fit by Equations 3–8 of Beg et al. (19) to obtain the best-fit value of α at that pH. The best-fit functions calculated using this model with parameter values given in the figure captions are plotted together with the data in Figs. 2 and 3. The value of Tm0 obtained from the best-fit of Equations 4–6 of Beg et al. (19) to denaturation curves obtained in the absence of added sugar are plotted against the pH value for both proteins in supplemental Fig. S7.
FIGURE 2.
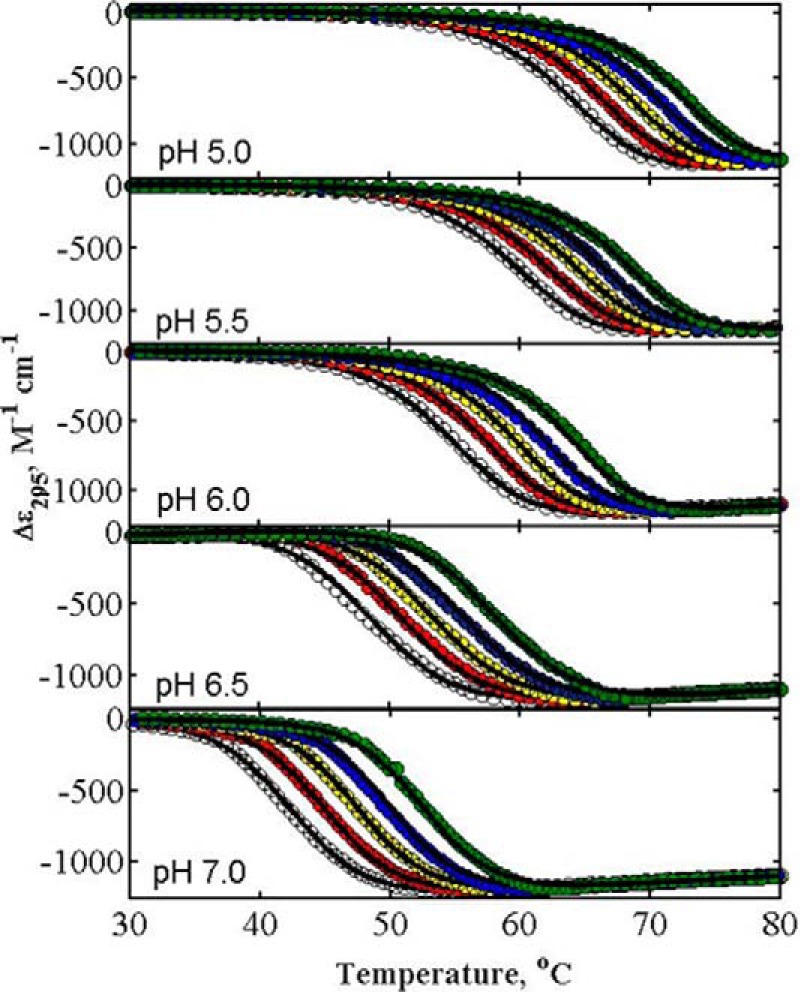
Representative curves of thermal denaturations of α-LA in the absence and presence of different concentrations of glucose at different pH values. Data sets in each panel from left to right represent the increasing concentration of glucose, 0.0, 0.50, 1.00, 1.50, and 2.00 m. Solid curves are plotted according to Equations 3–8 of Beg et al. (see Ref. 18) using the best-fit value of α for glucose plotted in Fig. 4. Although all denaturation curves were measured in the temperature range of 20–85 °C, for the sake of clarity plots cover a reduced temperature range.
FIGURE 3.
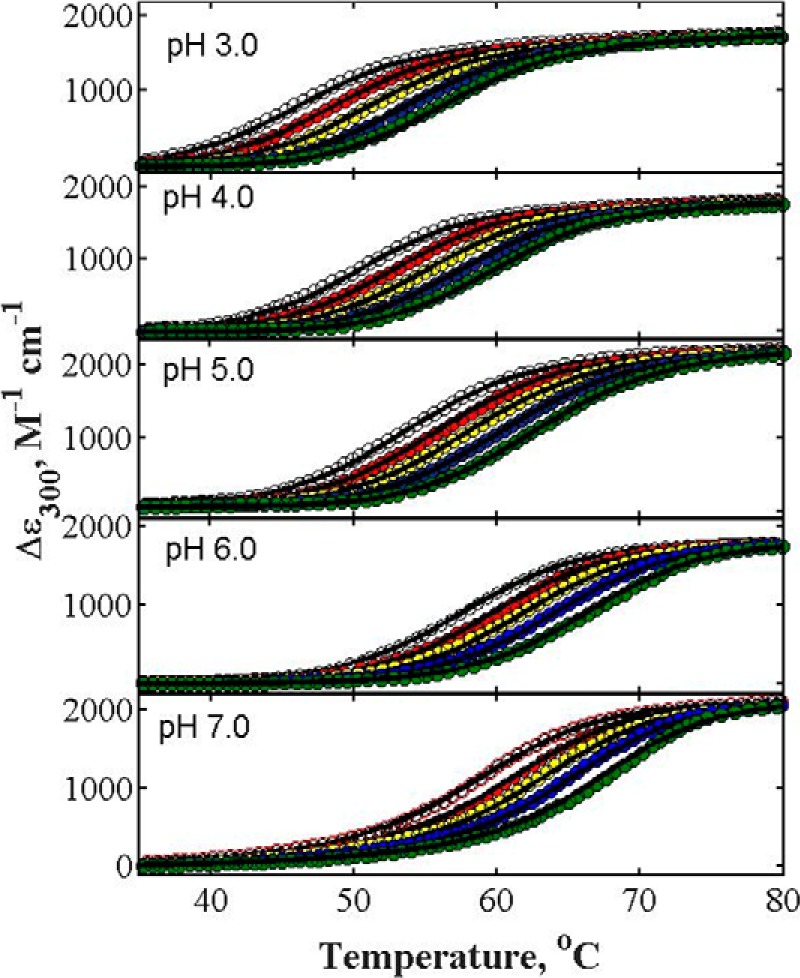
Representative curves of thermal denaturations of lysozyme in the absence and presence of different concentrations of glucose at different pH values. Data sets in each panel from left to right represent increasing concentrations of glucose, 0.0, 0.50, 1.00, 1.50, and 2.00 m. Solid curves are plotted according to Equations 3–8 of Beg et al. (see Ref. 18) using the best-fit value of α for glucose plotted in Fig. 4. Although all denaturation curves were measured in the temperature range of 20–85 °C, for the sake of clarity plots cover a reduced temperature range. Thermal denaturation of lysozyme was carried out in the presence of 2 m GdmCl, as described under “Experimental Procedures.”
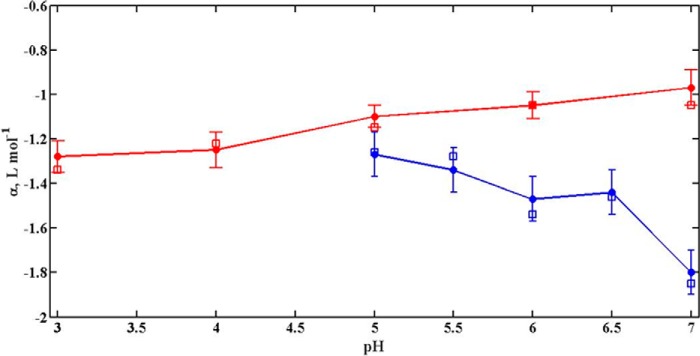
The approximate method described in the section on “Data Analysis” was also used to estimate the values of α for α-LA and lysozyme in the presence of glucose at different pH values. To facilitate comparison, values of α obtained both from full modeling and the approximate method are plotted together as functions of pH in Fig. 4 for these proteins. It is seen in this figure that both the approximate and fully modeled estimates of α agree to within the uncertainties of estimate at every pH. This comparison shows that the approximate method is sufficiently accurate that detailed modeling is not required to obtain a reliable estimate of α for all conditions. We have therefore used the approximate method to estimate the values of α for both proteins in the presence of all saccharides at all of the different pH values. Tables 1 and 2, respectively, indicate the values of α so obtained for α-LA and lysozyme in the presence of different saccharides and at various pH values. The pH dependence of α for both proteins and all sugars is plotted in Figs. 5 and 6.
FIGURE 4.
Plot of pH-dependence of α, estimated by using different methods, for α-LA (blue) and lysozyme (red) in the presence of glucose. Values of α estimated by using the rapid approximate method are represented by open square (□), and by excluded volume model are represented by closed circle (●) with standard error for both proteins.
TABLE 1.
Calculated values of α for α-LA in the presence of different sugars at different pH values
| Sugar | pH |
||||
|---|---|---|---|---|---|
| 7.0 | 6.5 | 6.0 | 5.5 | 5.0 | |
| −α (liter mol−1)a | |||||
| Glucose | 1.80 (1.85 ± 0.20)b | 1.36 | 1.51 | 1.31 | 1.29 |
| Galactose | 1.86 (1.80 ± 0.30) | 1.41 | 1.54 | 1.36 | 1.31 |
| Fructose | 1.76 (1.45 ± 0.20) | 1.38 | 1.52 | 1.29 | 1.26 |
| Sucrose | 3.13 (3.28 ± 0.30) | 2.34 | 2.30 | 2.17 | 1.81 |
| Trehalose | 3.16 (3.43 ± 0.30) | 2.30 | 2.31 | 2.21 | 1.83 |
| Raffinose | 3.88 (3.75 ± 0.80) | 3.20 | 3.00 | 2.75 | 2.25 |
| Stachyose | 5.40 (5.25 ± 1.00) | 4.01 | 3.82 | 3.74 | 3.32 |
a The negative sign indicates the exclusion of saccharide from the protein domain.
b Values in parentheses were taken from Beg et al. (19), and these values were obtained using best–fit model. The ± indicates uncertainties that correspond to mean ± 2 S.E. of estimate (95% confidence limits).
TABLE 2.
Calculated values of α for lysozyme in the presence of different sugars at different pH values
| Sugar | pH |
||||
|---|---|---|---|---|---|
| 7.0 | 6.0 | 5.0 | 4.0 | 3.0 | |
| −α (liter mol−1)a | |||||
| Glucose | 1.01 (1.03 ± 0.26)b | 1.08 | 1.09 | 1.16 | 1.30 |
| Galactose | 0.95 (0.99 ± 0.20) | 1.04 | 1.07 | 1.13 | 1.27 |
| Fructose | 1.03 (1.06 ± 0.30) | 1.06 | 1.10 | 1.15 | 1.32 |
| Sucrose | 1.50 (1.49 ± 0.20) | 1.54 | 1.62 | 1.81 | 1.87 |
| Trehalose | 1.52 (1.74 ± 0.30) | 1.56 | 1.63 | 1.83 | 1.89 |
| Raffinose | 1.83 (1.81 ± 0.36) | 2.02 | 2.17 | 2.77 | 2.86 |
| Stachyose | 2.13 (2.17 ± 0.40) | 2.37 | 2.43 | 3.29 | 3.50 |
a The negative sign indicates the exclusion of saccharide from the protein domain.
b Values in parentheses were taken from Beg et al. (19), and these values were obtained using best–fit model. The ± indicates uncertainties that correspond to mean ± 2 S.E. of estimate (95% confidence limits).
FIGURE 5.
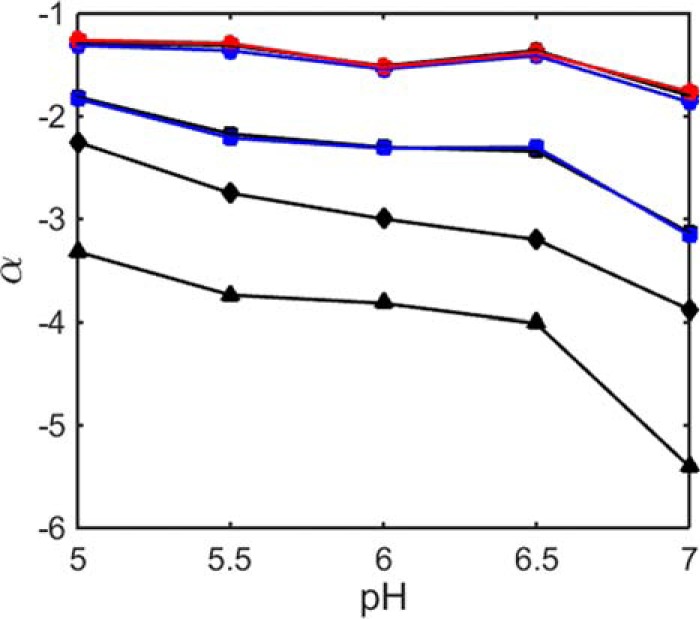
pH dependence of the stabilization parameter α for α-LA in the presence of different saccharides. Symbols: black circle, glucose; blue circle, galactose; red circle, fructose; black square, sucrose; blue square, trehalose; black diamond, raffinose; black triangle, stachyose.
FIGURE 6.
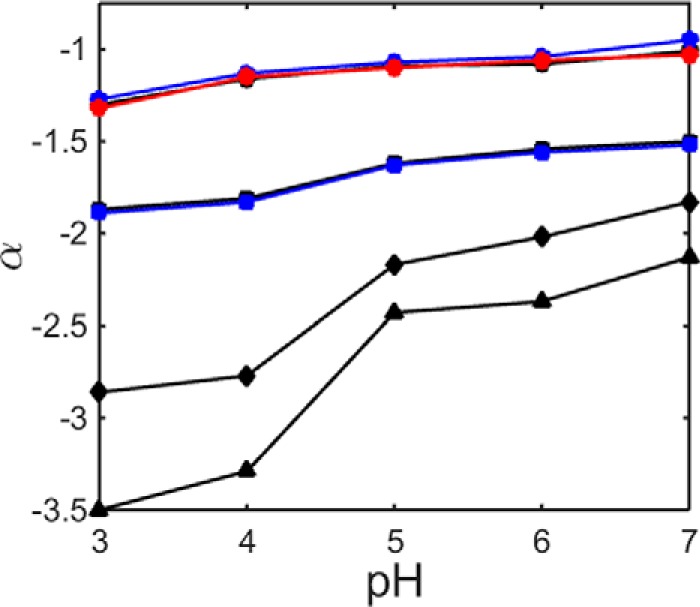
pH dependence of stabilization parameter α for lysozyme in the presence of different saccharides. Symbols have the same meaning as described in the legend to Fig. 5.
Discussion
The pH dependence of the net charge of a protein of known amino acid sequence can be estimated by assuming that the protein as a whole titrates as if it were a collection of independently titrating amino acid residues (20). The result of this calculation is plotted in Fig. 7. We note that this estimate is only approximate, as it neglects nonuniform effects of the local environment on nominally identical titratable residues and electrostatic interaction between the residues. Nonetheless, it is probably qualitatively accurate to say that as the pH decreases from 7 to 5, the net charge of α-LA decreases, whereas as the pH decreases from 7 to 3, the net charge on lysozyme increases. Our electrostatic hypothesis thus predicts that as the pH decreases, the stabilizing effect of all sugars upon α-LA as quantified by the magnitude of α will decrease, but the stabilizing effect of all sugars upon lysozyme as quantified by the magnitude of α will increase. These predictions are borne out by the results plotted in Figs. 5 and 6. The electrostatic hypothesis also predicts that the conformation of the U state will become increasingly elongated with increasing net charge, and the best-fit values of LU are in qualitative agreement with that observation, as may be seen in supplemental Fig. S8. Although we have represented the unfolded conformation of each protein as a spherocylinder within the context of our simplified excluded volume model, it should be noted this representation is neither necessary nor unique. It is sufficient to assign to the unfolded state a simple representation that excludes more volume to cosolutes than does the model for the native state, such as the expanded sphere utilized in our previous treatment (19). Our choice of the spherocylindrical representation was dictated by polyelectrolyte theory and experiment, as described under “Data Analysis.”
FIGURE 7.
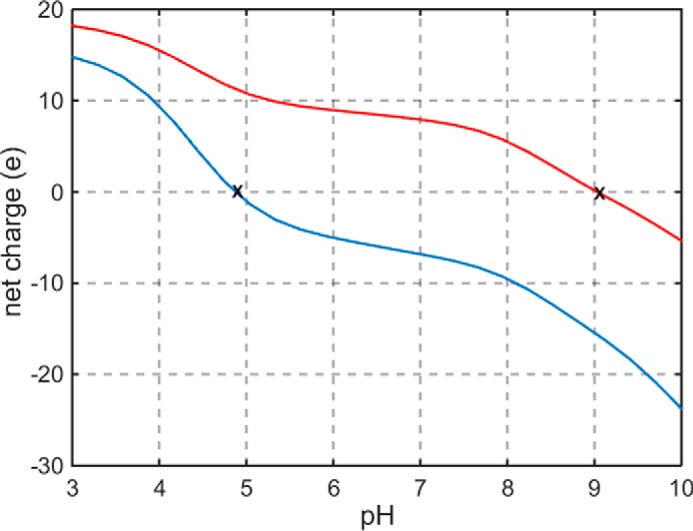
pH dependence of net charge on α-LA (blue) and lysozyme (red), calculated as described in text using amino acid sequences obtained from Protein Data Bank data files 1HFZ (bovine α-lactalbumin) and 5KXK (hen egg lysozyme). The isoelectric points (pI) of α-LA and lysozyme, indicated by X marks on the plot, are estimated to be ∼4.9 and ∼9, respectively.
Although not the main subject of this report, the electrostatic hypothesis also predicts that the intrinsic thermal stability of each protein (i.e. in the absence of added saccharide) will progressively decrease as the pH of measurement deviates from the pI of the protein. The dependence of Tm0 upon pH for both proteins is plotted in supplemental Fig. S7. The stability of α-LA decreases as the pH progressively deviates from its pI (≈4.9), and the stability of lysozyme decreases as the pH progressively deviates from its pI (≈9).
In summary, the reversible thermal denaturation of α-LA and lysozyme has been measured in the absence and presence of multiple concentrations of each of seven mono- and oligosaccharides at multiple pH values. The dependence of stability of each protein upon the concentration of sugar may be accounted for quantitatively and parsimoniously by a two-state model for unfolding, in which it is assumed that the stabilization of each protein by all sugars is essentially entropic in origin, due to an increase in volume excluded to sugar by the protein upon unfolding. Xie and Timasheff (21) and Kaushik and Bhat (22) had earlier concluded that the stabilization of RNase A, lysozyme, and chymotrypsinogen in the presence of trehalose is entropic in origin, and our reanalysis of the data published in these papers under supplemental information quantitatively confirms these conclusions. Poddar et al. (23) also measured the effects of various mono- and oligosaccharides on RNase A and observed that these saccharides increased the stabilization of protein without affecting the enthalpy of protein unfolding. Although Senske et al. (24) claimed that the stabilization of ubiquitin by glucose is enthalpically rather than entropically based, our reanalysis of the actual data (supplemental information) affirms that these data are entirely consistent with the entropic stabilization model utilized here and in Beg et al. (19).
It cannot be emphasized too highly that that the total amount of data presented and analyzed here, in addition to data from other publications presented and analyzed in the supplementary information, far exceeds that presented in any previously published study of the thermal stabilization of proteins by sugars. The success of the simple excluded volume model in accounting quantitatively for all of these data, which includes both the concentration dependence of the stabilizing effect of all sugars at every pH, and the dependence of the stabilizing effect upon the degree of oligomerization of the various mono- and oligosaccharides, provides strong evidence for the validity of the assumptions underlying this model. Finally, the difference between the pH dependence of stabilization of the two proteins may be accounted for qualitatively by assuming that an increase in the net charge of each protein results in a corresponding increase in volume excluded by the unfolded state to sugar.
Experimental Procedures
Materials
Commercially lyophilized proteins (bovine α–lactalbumin and hen egg white lysozyme), sodium cacodylate trihydrate, and all sugars (glucose, fructose, galactose, trehalose, sucrose, raffinose, and stachyose) used in this study were purchased from Sigma and used without further purification. Potassium chloride, glycine, and sodium acetate trihydrate were purchased from Merck India. Guanidinium chloride (GdmCl) was the ultrapure sample from MP Biomedicals. All chemicals and reagents used were of analytical grade.
Holo α-lactalbumin and lysozyme were extensively dialyzed against 0.1 m KCl, at pH 7.0. The apo form of α-LA was prepared by adding 5 mm EGTA to the solution of holo α-lactalbumin during dialysis. Protein stock solutions were filtered using a 0.22-μm Millipore filter. Concentration of the solutions of α-LA (25) and lysozyme (26) were determined experimentally using molar absorbance coefficient (ϵ) values of 29,210 and 39,000 m−1 cm−1, respectively, at 280 nm. Concentrations of stock solutions of GdmCl (27) and sugars (glucose, fructose, and sucrose) (28) were determined by refractive index measurements. However, the concentration of stock solutions of other sugars (galactose, trehalose, raffinose, and stachyose), which do not have the value of refractive indices were determined by dissolving a known amount of the respective sugar in the desired buffer. All measurements were taken in the desired degassed buffer. In our experiments, various buffer solutions were used for the measurements at different pH values: 0.05 m glycine-HCl buffer for pH 3.0; 0.05 m sodium acetate buffer for pH 4.0; and 0.05 m sodium cacodylate buffer for the range of pH 5.0–7.0, and all buffer solutions contained 0.1 m KCl. Because of the high stability of lysozyme in the pH 7.0–3.0 range, we could not get an entire denaturation curve within the range of accessible temperature at this pH range. Therefore, to measure the thermal denaturation curves of lysozyme within the range of accessible temperature, we added 2 m GdmCl to destabilize the lysozyme in this pH range.
Experimental Methods
Absorbance was measured in a Jasco V-660 UV-visible spectrophotometer equipped with a Peltier-type temperature controller (ETCS-761). Thermal denaturations of both proteins, α-LA and lysozyme, were monitored by following changes in the absorbance at the UV absorbance maximum of each protein (295 nm for α-LA and 300 nm for lysozyme) as a function of temperature. Thermal denaturations were measured in the temperature range of 20–85 °C with the heating rate of 1 °C/min. This heating rate provides adequate time for equilibration. Concentrations of α-LA and lysozyme used for absorbance studies were 0.40 and 0.50 mg ml−1, respectively. The raw absorbance data obtained from thermal denaturation for each sample were converted into the change in molar absorbance coefficient (Δϵ, m−1 cm−1) at a given wavelength λ, which is the difference between molar absorbance coefficient (ϵ) at any temperature T and at 20 °C.
Thermal denaturation of α-LA and lysozyme in the presence of fructose was monitored by following changes in ellipticity at 222 nm as a function of temperature in the range of 20–85 °C, and the rate of heating was 1 °C/min. Temperature-dependent ellipticity changes were measured in a Jasco 1500 spectropolarimeter equipped with a temperature controller (PTC-100). The raw CD data (ellipticity) were converted into mean residue ellipticity [θ]λ (degree cm2 dmol−1) at a given wavelength λ, using the relationship,
| (Eq. 1) |
where θλ is the observed ellipticity in millidegrees at wavelength λ, Mo is the mean residue weight of the protein, c is the protein concentration in mg ml−1, and l is the path length in centimeters.
All measurements were performed in triplicate, and the results reported here are the mean of the three values recorded at a given temperature. The precision of the data are indicated by the results obtained for replicates of a typical measurement, plotted in supplemental Fig. S9. The reversibility of thermal denaturation was ascertained by measurement of absorbance change with slow cooling to monitor refolding. The results of heating and cooling experiments are plotted together in supplemental Fig. S10, and their superposition shows that equilibrium was reached at all temperatures. In addition, superposition of the spectra of a protein before and after heating and recooling, shown in the supplemental information of Ref. 19, indicates the absence of irreversible aggregation leading to wavelength-dependent scattering and the resultant distortion of recorded spectra.
Data Analysis
Estimation of the Value of Stabilization Parameter α
Data obtained from thermal denaturations of α-LA and lysozyme in the presence of different sugars and at different pH values were analyzed in the context of a model for reversible two-state thermal unfolding N ↔ U derived from first-order excluded volume theory (19, 29). This model assumes that the equilibrium constant for unfolding at any temperature varies with the concentration of added saccharide according to
| (Eq. 2) |
where KNU and KNU0, respectively, denote two-state equilibrium constants for unfolding at temperature T in the presence and absence of sugar, and cS denotes the molar concentration of sugar. It is assumed that α is characteristic of a particular protein-sugar pair, sensitive to experimental conditions such as buffer composition and pH, but insensitive to temperature, as elaborated in the supplemental information (see descriptions of supplemental Equations S1 and S2). This is equivalent to assuming that the stabilizing increase in free energy of unfolding resulting from the addition of sugar is essentially entirely entropic in origin. Two different methods were used to estimate the value of α.
(i) Global Modeling of Thermal Denaturation Profiles
A complete description of the model equations and modeling procedure were provided earlier (19). In brief, data sets describing the dependence of an optical signal, either absorbance or ellipticity, upon temperature from solutions of a single protein in the absence and presence of multiple concentrations of a single saccharide were simultaneously fit by model equations assuming that the enthalpy and heat capacity of unfolding were independent of sugar concentration, and that the equilibrium constant for unfolding at any temperature could be specified by Equation 2.
(ii) Rapid Approximate Method
This method does not require global modeling of the thermodynamic data. Two thermal denaturation curves, one obtained in the absence of sugar, and one obtained at the highest concentration utilized in the study, are separately fit by a two-state model in which the temperature dependence of the free energy of unfolding, ΔKNU0(T), is specified by the integrated Gibbs-Helmholtz relationship (30),
| (Eq. 3) |
where Tm denotes the temperature at which the protein is half-unfolded, ΔHNU0 denotes the enthalpy of unfolding at that temperature, and ΔCp denotes the change in heat capacity upon unfolding. The dependence of half-unfolding temperature upon the equilibrium constant for unfolding is given approximately by (31),
| (Eq. 4) |
where R denotes the molar gas constant (2 cal degree−1 mol−1) and Tm0 the temperature at which the protein is half-unfolded in the absence of added sugar. Combination of Equations 2 and 4 leads to Equation 5.
| (Eq. 5) |
Coarse-grained Structure-based Model for pH Dependence of Sugar Stabilization
The conformation of the native (N) state is assumed to be unaffected by changes in pH due to the presence of stabilizing short-range intramolecular interactions (e.g. hydrophobic, H-bonding) that are independent of charge density (32). Within the context of a coarse-grained model we represent the native state as a spherical particle with a radius equal to that of a sphere with the same mass and specific volume (19). Lacking the stabilizing intramolecular interactions characteristic of the native state, the conformation of the unfolded (U) state is assumed to be sensitive to changes in longer-ranged intramolecular electrostatic interactions. In the previous report (19) the U state was treated as an expanded sphere. However, polyelectrolyte theory predicts, and experiments verify that as the charge density of a polyelectrolyte increases, the conformation becomes increasingly extended to relieve repulsive electrostatic interactions to the maximum extent possible (33–35). In our revised coarse-grained model, we take into account an increase in the linear extension of the U state by representing unfolded protein as a spherocylinder of cylindrical length/diameter ratio LU, where rU (cylindrical radius of the spherocylinder representing the unfolded state) is given by Equation 6.
| (Eq. 6) |
In Equation 6, rN denotes the radius of the sphere representing the native state. Equation 6 derives from the assumption that the absolute volumes of native (N) and unfolded (U) states are equal, although their excluded volume will differ for LU > 0. Note that a sphere is just a special case of spherocylinder with LU = 0. Convex hard particle representations of the N and U states are portrayed schematically in Fig. 1. As in the prior treatment, the native states of both proteins, monosaccharides and water are represented, respectively, by spheres of 16, 4, and 1.5 Å, and each oligosaccharide is represented by a spherocylinder of radius 4 Å and a ratio of cylindrical length to diameter L = 2(n − 1)/3, where n is the degree of oligomerization of the saccharide (19).
As before, the stabilization factor α is calculated according to,
| (Eq. 7) |
where VXY denotes the volume excluded by species X to species Y in units of Å3/molecule. Here X = N for the native state or U for the unfolded state, and Y = S for saccharide and H for water.
Excluded volumes are calculated using the Kihara relationship for convex hard particles (29),
| (Eq. 8) |
where Hi, Si, and Vi, respectively, denote the Kihara supporting function, surface area and volume of particle representing species i. For a spherocylinder, these functions are given as Equations 9–11.
| (Eq. 9) |
| (Eq. 10) |
| (Eq. 11) |
Author Contributions
I. A., I. M. H., and F. A. designed the experiments. I. B. performed the experiments. I. B., F. A., and A. P. M. analyzed the data and wrote the report.
Supplementary Material
Acknowledgment
We thank Prof. Rajiv Bhat, Jawaharlal Nehru University, New Delhi, for helpful and constructive comments on a draft of this report.
This work was supported by Council of Scientific and Industrial Research, India, Research Grants 37(1603)/13/EMRII and 37(1604)/13/EMRII) (to F. A. and A. I.) and the National Institutes of Health Intramural Research Program of the NIDDK (to A. P. M). The authors declare that they have no conflicts of interest with the contents of this article. The content is solely the responsibility of the authors and does not necessarily represent the official views of the National Institutes of Health.

This article contains supplemental Figs. S1–S10 and Equations S1 and S2.
- α-LA
- apo α-lactalbumin
- GdmCl
- guanidinium chloride.
References
- 1. Yancey P. H., Clark M. E., Hand S. C., Bowlus R. D., and Somero G. N. (1982) Living with water stress: evolution of osmolyte systems. Science 217, 1214–1222 [DOI] [PubMed] [Google Scholar]
- 2. Jaenicke R. (1991) Protein stability and molecular adaptation to extreme conditions. Eur. J. Biochem. 202, 715–728 [DOI] [PubMed] [Google Scholar]
- 3. Welsh D. T. (2000) Ecological significance of compatible solute accumulation by micro-organisms: from single cells to global climate. FEMS Microbiol. Rev. 24, 263–290 [DOI] [PubMed] [Google Scholar]
- 4. Krasensky J., and Jonak C. (2012) Drought, salt, and temperature stress-induced metabolic rearrangements and regulatory networks. J. Exp. Bot. 63, 1593–1608 [DOI] [PMC free article] [PubMed] [Google Scholar]
- 5. Yancey P. H. (2005) Organic osmolytes as compatible, metabolic and counteracting cytoprotectants in high osmolarity and other stresses. J. Exp. Biol. 208, 2819–2830 [DOI] [PubMed] [Google Scholar]
- 6. Burg M. B., and Ferraris J. D. (2008) Intracellular organic osmolytes: function and regulation. J. Biol. Chem. 283, 7309–7313 [DOI] [PMC free article] [PubMed] [Google Scholar]
- 7. Davis-Searles P. R., Saunders A. J., Erie D. A., Winzor D. J., and Pielak G. J. (2001) Interpreting the effects of small uncharged solutes on protein-folding equilibria. Annu. Rev. Biophys. Biomol. Struct. 30, 271–306 [DOI] [PubMed] [Google Scholar]
- 8. Singh L. R., Poddar N. K., Dar T. A., Rahman S., Kumar R., and Ahmad F. (2011) Forty years of research on osmolyte-induced protein folding and stability. J. Iran Chem. Soc. 8, 1–23 [Google Scholar]
- 9. Attfield P. V. (1987) Trehalose accumulates in Saccharomyces cerevisiae during exposure to agents that induce heat shock response. FEBS Lett. 225, 259–263 [DOI] [PubMed] [Google Scholar]
- 10. De Virgilio C., Hottiger T., Dominguez J., Boller T., and Wiemken A. (1994) The role of trehalose synthesis for the acquisition of thermotolerance in yeast: I. genetic evidence that trehalose is a thermoprotectant. Eur. J. Biochem. 219, 179–186 [DOI] [PubMed] [Google Scholar]
- 11. Hottiger T., De Virgilio C., Hall M. N., Boller T., and Wiemken A. (1994) The role of trehalose synthesis for the acquisition of thermotolerance in yeast: II. physiological concentrations of trehalose increase the thermal stability of proteins in vitro. Eur. J. Biochem. 219, 187–193 [DOI] [PubMed] [Google Scholar]
- 12. Singer M. A., and Lindquist S. (1998) Multiple effects of trehalose on protein folding in vitro and in vivo. Mol. Cell 1, 639–648 [DOI] [PubMed] [Google Scholar]
- 13. Auton M., Rösgen J., Sinev M., Holthauzen L. M., and Bolen D. W. (2011) Osmolyte effects on protein stability and solubility: a balancing act between backbone and side-chains. Biophys. Chem. 159, 90–99 [DOI] [PMC free article] [PubMed] [Google Scholar]
- 14. Timasheff S. N. (1993) The control of protein stability and association by weak interactions with water: how do solvents affect these processes? Annu. Rev. Biophys. Biomol. Struct. 22, 67–97 [DOI] [PubMed] [Google Scholar]
- 15. Timasheff S. N. (2002) Protein hydration, thermodynamic binding, and preferential hydration. Biochemistry 41, 13473–13482 [DOI] [PubMed] [Google Scholar]
- 16. Timasheff S. N. (2002) Protein-solvent preferential interactions, protein hydration, and the modulation of biochemical reactions by solvent components. Proc. Natl. Acad. Sci. U.S.A. 99, 9721–9726 [DOI] [PMC free article] [PubMed] [Google Scholar]
- 17. Bolen D. W. (2001) Protein stabilization by naturally occurring osmolytes. Methods Mol. Biol. 168, 17–36 [DOI] [PubMed] [Google Scholar]
- 18. Bolen D. W., and Baskakov I. V. (2001) The osmophobic effect: natural selection of a thermodynamic force in protein folding. J. Mol. Biol. 310, 955–963 [DOI] [PubMed] [Google Scholar]
- 19. Beg I., Minton A. P., Hassan I., Islam A., and Ahmad F. (2015) Thermal stabilization of proteins by mono- and oligosaccharides: measurement and analysis in the context of an excluded volume model. Biochemistry 54, 3594–3603 [DOI] [PubMed] [Google Scholar]
- 20. Tanford C. (1961) Physical chemistry of macromolecules, John Wiley and Sons, New York [Google Scholar]
- 21. Xie G., and Timasheff S. N. (1997) The thermodynamic mechanism of protein stabilization by trehalose. Biophys. Chem. 64, 25–43 [DOI] [PubMed] [Google Scholar]
- 22. Kaushik J. K., and Bhat R. (2003) Why is trehalose an exceptional protein stabilizer? an analysis of the thermal stability of proteins in the presence of the compatible osmolyte trehalose. J. Biol. Chem. 278, 26458–26465 [DOI] [PubMed] [Google Scholar]
- 23. Poddar N. K., Ansari Z. A., Singh R. K., Moosavi-Movahedi A. A., and Ahmad F. (2008) Effect of monomeric and oligomeric sugar osmolytes on ΔGD, the Gibbs energy of stabilization of the protein at different pH values: is the sum effect of monosaccharide individually additive in a mixture? Biophys. Chem. 138, 120–129 [DOI] [PubMed] [Google Scholar]
- 24. Senske M., Törk L., Born B., Havenith M., Herrmann C., and Ebbinghaus S. (2014) Protein stabilization by macromolecular crowding through enthalpy rather than entropy. J. Am. Chem. Soc. 136, 9036–9041 [DOI] [PubMed] [Google Scholar]
- 25. Sugai S., Yashiro H., and Nitta K. (1973) Equilibrium and kinetics of the unfolding of α-lactalbumin by guanidine hydrochloride. Biochim. Biophys. Acta 328, 35–41 [DOI] [PubMed] [Google Scholar]
- 26. Hamaguchi K., and Kurono A. (1963) Structure of muramidase (lysozyme): I. the effect of guanidine hydrochloride on muramidase. J. Biochem. 54, 111–122 [PubMed] [Google Scholar]
- 27. Pace C. N. (1986) Determination and analysis of urea and guanidine hydrochloride denaturation curves. Methods Enzymol. 131, 266–280 [DOI] [PubMed] [Google Scholar]
- 28. Weast R. C. (1972) Handbook of Chemistry and Physics, CRC Press, Cleveland, OH [Google Scholar]
- 29. Minton A. P. (1998) Molecular crowding: analysis of effects of high concentrations of inert cosolutes on biochemical equilibria and rates in terms of volume exclusion. Methods Enzymol. 295, 127–149 [DOI] [PubMed] [Google Scholar]
- 30. Becktel W. J., and Schellman J. A. (1987) Protein stability curves. Biopolymers 26, 1859–1877 [DOI] [PubMed] [Google Scholar]
- 31. Minton A. P. (2000) Effect of a concentrated “inert” macromolecular cosolute on the stability of a globular protein with respect to denaturation by heat and by chaotropes: a statistical-thermodynamic model. Biophys. J. 78, 101–109 [DOI] [PMC free article] [PubMed] [Google Scholar]
- 32. Pace C. N., Alston R. W., and Shaw K. L. (2000) Charge-charge interactions influence the denatured state ensemble and contribute to protein stability. Protein Sci. 9, 1395–1398 [DOI] [PMC free article] [PubMed] [Google Scholar]
- 33. Kirwan L. J., Papastavrou G., Borkovec M., and Behrens S. H. (2004) Imaging the coil-to-globule conformational transition of a weak polyelectrolyte by tuning the polyelectrolyte charge density. NanoLetters 4, 149–152 [Google Scholar]
- 34. Kim W. K., and Sung W. (2011) Charge density and bending rigidity of a rod-like polyelectrolyte: effects of multivalent counterions. Phys. Rev. E Stat. Nolin. Soft Matter Phys. 83, 051926 [DOI] [PubMed] [Google Scholar]
- 35. Dou S., and Colby R. H. (2006) Charge density effects in salt-free polyelectrolyte solution rheology. J. Polym. Sci. Part B Polymer Phys. 44, 2001–2013 [Google Scholar]
Associated Data
This section collects any data citations, data availability statements, or supplementary materials included in this article.


