Abstract
Regulatory T (Treg) cells expressing the transcription factor FOXP3 play a pivotal role in maintaining immunologic self-tolerance. We and others have shown previously that EZH2 is recruited to the FOXP3 promoter and its targets in Treg cells. To further address the role for EZH2 in Treg cellular function, we have now generated mice that lack EZH2 specifically in Treg cells (EZH2Δ/ΔFOXP3+). We find that EZH2 deficiency in FOXP3+ T cells results in lethal multiorgan autoimmunity. We further demonstrate that EZH2Δ/ΔFOXP3+ T cells lack a regulatory phenotype in vitro and secrete proinflammatory cytokines. Of special interest, EZH2Δ/ΔFOXP3+ mice develop spontaneous inflammatory bowel disease. Guided by these results, we assessed the FOXP3 and EZH2 gene networks by RNA sequencing in isolated intestinal CD4+ T cells from patients with Crohn's disease. Gene network analysis demonstrates that these CD4+ T cells display a Th1/Th17-like phenotype with an enrichment of gene targets shared by FOXP3 and EZH2. Combined, these results suggest that the inflammatory milieu found in Crohn's disease could lead to or result from deregulation of FOXP3/EZH2-enforced T cell gene networks contributing to the underlying intestinal inflammation.
Keywords: epigenetics, forkhead box P3 (FOXP3), histone methylation, inflammatory bowel disease (IBD), T helper cells, Crohn's disease, EZH2, regulatory T cell, transcriptional corepressor
Introduction
CD4+ T cells, crucial for physiologic immune response to pathogens, are increasingly recognized to be key players in human immune-mediated diseases such as multiple sclerosis, rheumatoid arthritis, and Crohn's disease (1). T cell receptor for antigen activation coupled with co-stimulation and cytokine signaling networks induces naïve CD4+ T cells to acquire differentiated phenotypes characterized by cytokine production and function (i.e. Th1, Th2, Th17, and Treg3) (2). Of these phenotypes, the Treg cell, defined by constitutive expression of the lineage-specific transcription factor FOXP3, plays a unique role in maintaining homeostasis between tolerizing and activating immune responses (3). Treg cells can either be generated in the thymus or induced in the periphery or in vitro from naïve T cells activated in the presence of TGF-β and IL-2 (4). The importance of FOXP3-expressing Treg cells is highlighted by the fact that humans with FOXP3 mutations develop the life-threatening autoimmune disorders, immune dysregulation, polyendocrinopathy and enteropathy, X-linked syndrome (IPEX) (5, 6). Similarly, mice lacking FOXP3 succumb to a severe lymphoproliferative autoimmune disease also attributed to the lack of functional Treg cells (7). Thus, FOXP3 represents the major transcriptional regulator maintaining the normal Treg cellular phenotype, and disruption leads to severe human disease.
The central role for epigenetic complexes in the determination of T cell lineage fate decisions has yet to be fully characterized. However, the importance of the histone methyltransferase enhancer of Zeste homolog 2 (EZH2) in these processes has been recently recognized (4). EZH2, the catalytic subunit of the Polycomb repressive complex 2 (PRC2), is a histone methyltransferase (HMT) that catalyzes the methylation of histone H3 at lysine 27 (H3K27) to generate trimethylated H3K27 (H3K27me3) (8). Although the canonical function of EZH2 is the regulation of gene repression, the role of this enzyme in T cell immune responses is controversial. EZH2 has been implicated in T cell development (9), cytokine production (10), and Th1/Th2 lineage fate determination in vitro (11). In fact, we demonstrated previously that EZH2 is recruited to the silenced Foxp3 promoter through a Polycomb response element (12). Others extended this observation, demonstrating the histone mark of EZH2 activity (H3K27me3) at silenced FOXP3 target genes in Treg cells (13), and disruption of EZH2 in Treg cells led to either impaired in vivo function (14) or senescence (4). In addition, FOXP3 binds to EZH2 (13), suggesting that this HMT may function as a cofactor for the regulation of Treg-specific gene networks. However, the role these interactions may have in either initiating or maintaining inflammation in human disease remains to be established.
In this report, we ascribe a proinflammatory phenotype to FOXP3+ cells deficient in EZH2 and, most importantly, demonstrate evidence for deregulation of this critical epigenetic pathway in human inflammatory bowel disease (IBD). Specifically, we show that EZH2 deficiency in FOXP3+ T cells in mice results in multiorgan autoimmunity and decreased survival. We further demonstrate that EZH2-deficient FOXP3+ T cells do not maintain a regulatory phenotype but instead secrete proinflammatory cytokines. Of special interest, these mice developed spontaneous IBD of both the small and large intestine. Congruently, analysis of gene expression networks of human CD4+ T cells isolated from the intestine of patients with human IBD indicated disruption of EZH2-regulated networks and differential expression of proinflammatory genes typical of Th1/Th17 effector T cells. Thus, these data support the idea that deregulation of EZH2-enforced T cell gene networks perpetuates intestinal inflammation in both murine models and human IBD. Therefore, these data provide insight into the mechanisms of human disease.
Results
Deletion of the EZH2 SET Domain in FOXP3+ Cells Results in Multiorgan Inflammation and Early Mortality
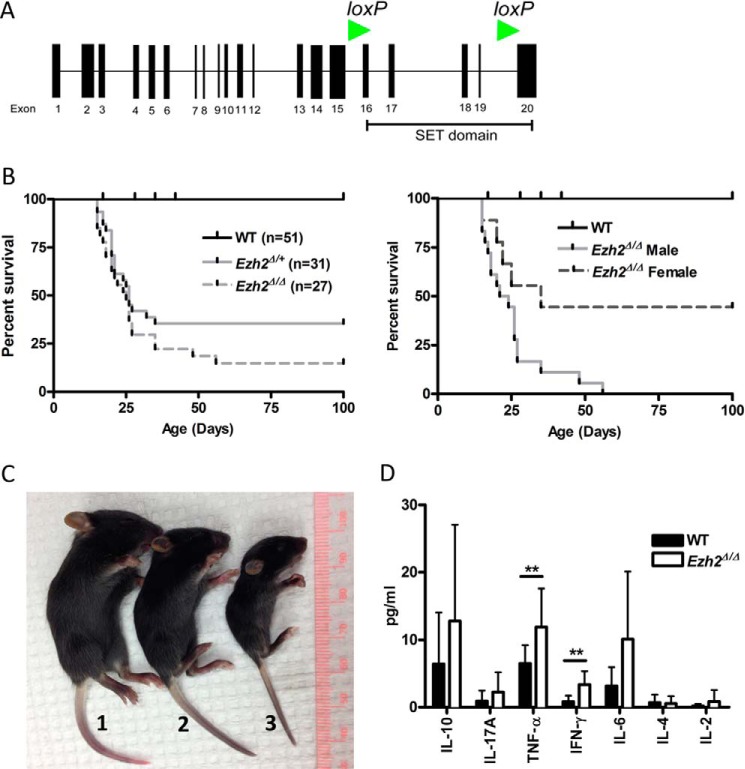
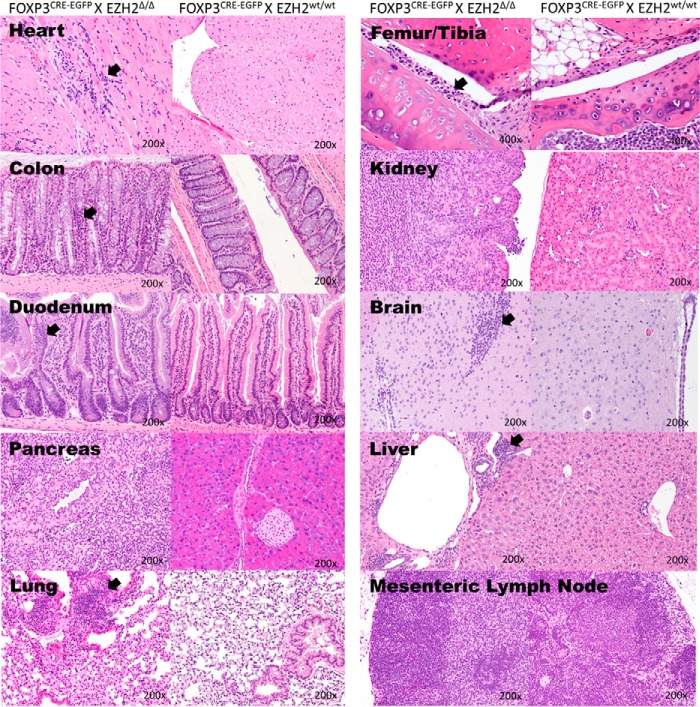
To extend our previous observations that the FOXP3 core promoter represented a Polycomb recruitment element (12), we generated a conditional knockout model for EZH2 in FOXP3-expressing cells. Mice with transgenic expression of CRE recombinase under promotional control of the FOXP3 promoter (B6-Tg(Foxp3EGFP-cre)1aJbs/J) were bred with mutant mice bearing LoxP insertion sites flanking the enzymatically active EZH2 SET domain (EZH2fl/fl) (Fig. 1A). The majority of pups homozygous for conditional EZH2 deficiency (EZH2Δ/ΔFOXP3+) were moribund by 3 weeks of age and displayed increased mortality (85.2%; Fig. 1, B and C). Conditional EZH2 deletion was particularly lethal in male mutants (100%; Fig. 1B, right panel). The analysis of serum for cytokines by multiplex ELISA supported a marked inflammatory process. We identified significantly elevated levels of TNF-α (11.9 pg/ml versus 6.5 pg/ml, p = 0.003) and IFN-γ (3.35 versus 0.8 pg/ml, p = 0.0002) in the serum of 14- to 17-day-old EZH2Δ/ΔFOXP3+ mice compared with littermate control animals (Fig. 1D). Homozygous mutant mice surviving beyond 3 weeks developed multiorgan inflammatory disease by 6–8 weeks of age (Fig. 2). Clinically, the EZH2Δ/ΔFOXP3+ animals distinguished themselves from FOXP3-null animals (scurfy mutation) in early lethality (14 days versus 24 days (15)) and the absence of inflammation around the ears, eyes, or tail (Fig. 1C). Thus, the severe clinical phenotype demonstrates the critical role for EZH2 in Treg function in vivo and suggests an altered function rather than a lack of function of EZH2-deficient Treg cells.
FIGURE 1.
Conditional deletion of the SET domain of EZH2 in FOXP3+ Treg cells in mice (EZH2Δ/Δ FOXP3+ or EZH2Δ/+ FOXP3+) results in poor survival. A, exon map of mouse EZH2 indicating the EZH2 catalytic SET domain that was conditionally deleted by flanking LoxP insertion sites (green arrowheads). B, survival analysis of EZH2Δ/Δ (n = 27) or EZH2Δ/+ (n = 31) mice compared with WT (n = 51) (left panel) and mutant mice distinguished by gender (right panel). The data are cumulative of over 10 litters, and all offspring are represented. C, representative images depicting the clinical appearance of experimental littermates and the size of FOXP3wt EZH2fl/fl (WT, 1), EZH2wt/Δ FOXP3+ (EZH2Δ/+, 2) and EZH2Δ/Δ FOXP3+ (EZH2Δ/Δ, 3) pups and lack of ear, eye, and tail inflammation 21 days after birth. D, mean (S.E.) serum cytokine concentrations as measured by multiplex cytokine analysis. Data are from 15 biological replicates (unique animals) and represent independent experiments. Error bars denote S.E., n = 15 mice/group. Non-parametric unpaired t test was performed using Mann-Whitney t test, and p < 0.05 was considered statistically significant. **, p < 0.01.
FIGURE 2.
EZH2Δ/Δ FOXP3+mice develop end organ lymphoid infiltrates, either diffuse, nodular, or both. Shown are the heart, colon, small bowel, pancreas, lung, femoral-tibial joint, kidney, brain, liver, and mesenteric lymph node. Abnormal lymphoid infiltrate is evident in both a diffuse and nodular pattern (arrows). Four EZH2wt/wtFOXP3+ and 7 EZH2Δ/Δ FOXP3+ animals of both sexes were examined by histology. Representative images are shown. Histology was assessed by our participating pathologist blinded to study grouping.
EZH2Δ/ΔFOXP3+ Lymphocytes Transform to a Proinflammatory Phenotype
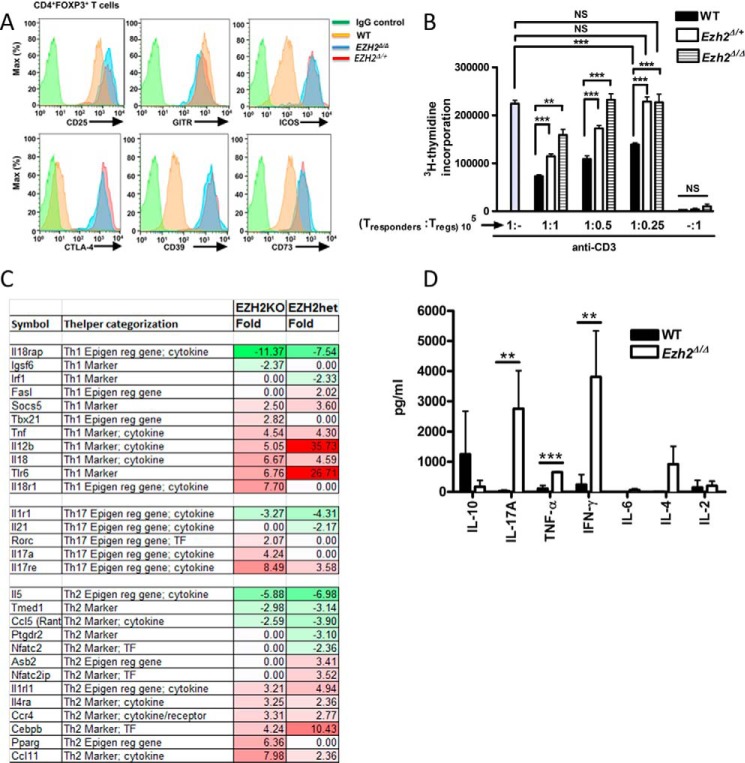
To address the role for EZH2Δ/ΔFOXP3+ T cells in this severe multiorgan inflammatory phenotype, we systematically assessed the phenotype and function of EZH2Δ/ΔFOXP3+ cells through cell surface marker characterization, cytokine production, and an in vitro functional assay. Analysis of splenocytes from EZH2Δ/ΔFOXP3+ mice showed a normal distribution of CD4+ and CD8+ T cells. In addition, CD4+ T cells displayed similar frequencies of naïve, memory, and FOXP3+ T cell subsets compared with WT mice (data not shown). Similar to control Treg cells, EZH2Δ/ΔFOXP3+ T cells displayed enhanced expression of the IL2Rα chain, CD25, and glucocorticoid-induced tumor necrosis factor receptor (TNFR) (glucocorticoid-induced TNFR family related gene (GITR)) (Fig. 3A). (16) Suggestive of an activated effector phenotype of EZH2Δ/Δ and EZH2Δ/+FOXP3+ cells, we observed greater expression of inducible T-cell costimulatory (ICOS), CTLA-4, CD39, and CD73 compared with FOXP3+ cells of littermate control mice (Fig. 3A, red and blue histograms versus yellow WT histogram) (14, 17–19). EZH2Δ/ΔFOXP3+ cells displayed an impaired in vitro suppressive function when co-cultured with responder T cells (1:1 ratio, 159,211 ± 11,989 versus 73,418 ± 2825, mean ± S.E. thymidine counts, p = 0.0073, Fig. 3B). Thus, despite the enhanced expression of regulatory molecules, EZH2Δ/ΔFOXP3+ cells do not properly function in vitro. Indeed, the intermediate suppressive capacity of FOXP3+ cells isolated from littermates heterozygous for EZH2 suggested a dose-dependent effect of EZH2 on regulatory function.
FIGURE 3.
EZH2Δ/ΔFOXP3+ lymphocytes transform to a proinflammatory phenotype. A, the expression of cell surface markers in Treg cells (CD4+FOXP3+) measured by flow cytometry. Data are representative of three independent experiments (n = 3 mice/experimental group). B, suppression assay measuring the degree of Treg-mediated suppression of CD4+ T responder cells (105) in response to anti-CD3 ± CD4+CD25+ Treg titrations (105, 0.5 × 10⁵, or 0.25 × 10⁵ cells) from either EZH2Δ/Δ, EZH2Δ/+, or WT mice. The rate of cell proliferation is directly proportional to titrated [3H]thymidine uptake but inversely proportional to Treg-suppressive capability. The result demonstrated represents the mean (S.E.) of four independent experiments (n = 4 biological replicates). Additionally, each independent experiment was performed in triplicate. Statistical significance was performed via non-parametric unpaired t test (Mann-Whitney t test). **, p < 0.01; ***, p < 0.001; NS, not significant. C, gene-targeted microarray demonstrating broad deregulation of inflammatory genes. Color shading corresponds to -fold change (Fold) in mutant sample (EZH2KO or heterozygous, EZH2het) compared with WT samples. Note the general up-regulation (red shading) of gene sets associated with Th1/Th17 T cell phenotypes. D, cytokine concentrations from supernatants of stimulated FOXP3+ cells as measured by multiplex cytokine analysis. Data are mean (S.E.) of four unique biological replicates (n = 4 mice/group). Statistical significance was determined via Mann-Whitney t test for significance. **, p < 0.01; ***, p < 0.001.
Having established impaired function in cellular assays, we subsequently addressed the possibility that the EZH2Δ/ΔFOXP3+ cells contribute to inflammation through the production of proinflammatory cytokines. To phenotype the EZH2-deficient CD4+ lymphocytes by gene expression profiling, RNA was isolated from FACS-sorted FOXP3+ splenocytes isolated from individual 14- to 21-day-old EZH2Δ/ΔFOXP3+ (n = 3), EZH2Δ/+FOXP3+ (n = 3), and WT control (n = 3) animals. In these moribund young animals, limited cell recovery precluded genome-wide RNA sequencing; thus, we performed gene-targeted microarray. Genes differentially expressed between experimental groups are listed in Fig. 3C. The color shading represents the degree of differential expression concordant between homozygous and heterozygous EZH2 mutant mice compared with the WT control. The pattern of gene expression within EZH2-deficent Treg cells demonstrated broad deregulation of proinflammatory genes across Th1, Th2, and Th17 profiles (Fig. 3C). To confirm this finding at the level of protein expression, we demonstrate in Fig. 3D that stimulated EZH2Δ/ΔFOXP3+ CD4+ T cells produce significantly more IL-17A, TNF-α, and IFN-γ compared with WT FOXP3+ CD4+ T cells. Specifically, the levels of IFN-γ (3807.8 versus 240.2 pg/ml, p = 0.0005), IL-17A (2763.1 versus 31.8 pg/ml, p = 0.006), and TNF-α (652.7 versus 107.1 pg/ml, p = 0.0004) in culture supernatants were significantly higher compared with WT CD4+ Treg cells following ex vivo stimulation with anti-CD3/anti-CD28 antibodies. Taken together, our data support the concept that, in FOXP3+ T cells, EZH2 is critical in maintaining the regulatory T cell phenotype and suppresses proinflammatory cytokine production, which is consistent with the previously established functional and physical interaction between this HMT and FOXP3. Indeed, TNFα (20) and IFNγ (4) are established EZH2 targets.
Pharmacologic Inhibition of EZH2 Results in Heightened Intestinal Immune Reactivity
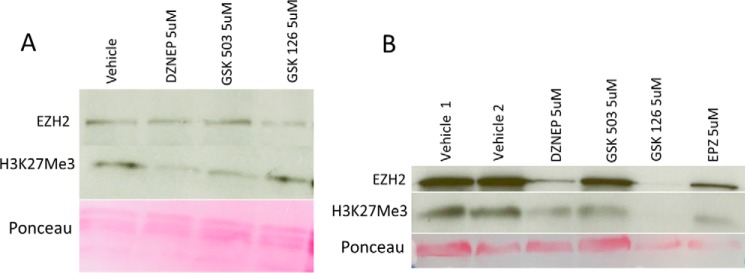
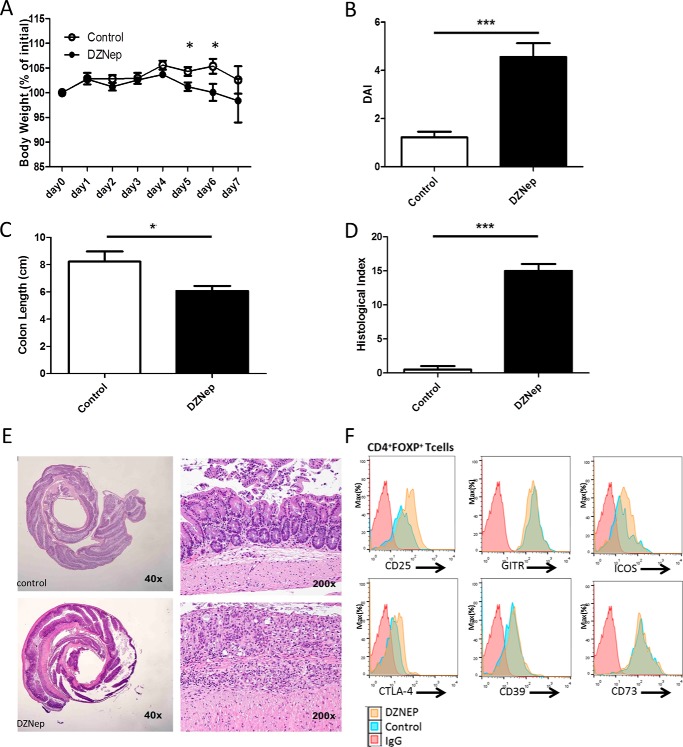
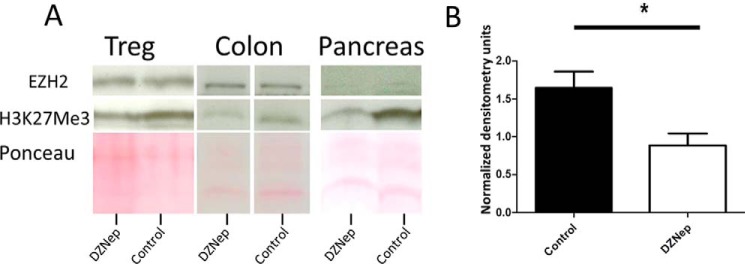
EZH2 hyperactivation or mutations are found in various malignancies (21, 22), and EZH2 inhibitors are under investigative protocols for cancer therapy. Interested in an effect of systemic EZH2 inhibitory therapy on immune-regulatory function, we first demonstrated the in vitro capacity of EZH2 inhibitors to disrupt global H3K27me3 in differentiated, freshly isolated Treg cells (Fig. 4A) and throughout the differentiation process of Treg induction (Fig. 4B). To varying degrees, all four inhibitors tested decreased H3K27me3 levels under both conditions. Furthermore, 3-deazaneplanocin A (DZNep) decreased EZH2 levels, most closely mimicking our genetic KO without significant cellular toxicity (Fig. 4B). Thus, we treated WT mice with DZNep, an inhibitor of EZH2 (23–25). Over 7 days, no obvious clinical or histologic abnormalities were evident (data not shown); thus, we stimulated the mucosal immune response using oral dextran sodium sulfate (DSS) dosed to induce minimal chemical colitis in WT C57/BL6 mice (2% DSS (26)). DZNep-treated mice experienced a marked mucosal immune response to DSS, as demonstrated by weight loss, gross colitis at necropsy, shortening of the colon, and severe colitis upon blinded histologic assessment (Fig. 5). Reminiscent of the activated effector phenotype of EZH2Δ/Δ Treg cells, FOXP3+ cells isolated from DZNep-treated animals displayed greater expression of CD25, ICOS, and CTLA-4 compared with FOXP3+ cells of vehicle-treated control mice (Fig. 5F, yellow histograms versus blue histograms). Furthermore, we confirmed an expected global reduction in H3K27me3 levels in lymphocytes and tissue from DZNep-treated animals (Fig. 6).
FIGURE 4.
Pharmacologic inhibition of EZH2 reduces global H3K27me3 levels in vitro. A, immunoblot analysis of EZH2 and H3K27me3 levels in CD4+CD25+ cells cultured in the presence of the indicated inhibitors for 18 h. B, immunoblot analysis of EZH2 and H3K27me3 levels in CD4+CD62L+ cells cultured under Treg-stimulating conditions (see “Experimental Procedures”) in the presence of the indicated inhibitors for 36 h. Note the toxicity of GSK126 and EPZ4638, as evident by reduction of Ponceau staining under these conditions.
FIGURE 5.
Pharmacologic inhibition of EZH2 results in heightened intestinal immune reactivity. A–D, demonstration of weight change (A), clinical disease activity index (DAI, B), colon length (C), and blinded histologic inflammatory index (D) in DZNep-treated animals versus sham-treated controls exposed to 2% DSS. E, representative colon histologic section demonstrating significant inflammation and ulceration. Statistical significance for weight change was determined using the Holm-Sidak method, with α = 5.000% (p < 0.05). Each time point was analyzed individually without assuming a consistent S.D. For colon length and histologic and disease activity index, significance was determined using a non-parametric unpaired t test of significance (Mann-Whitney), p < 0.05. The data are generated from n = 20 animals, 10/group. F, expression of cell surface markers in Treg cells (CD4+FOXP3+) measured by flow cytometry. Data are representative of n = 4 mice/experimental group. *, p ≤ 0.05; ***, p ≤ 0.0001.
FIGURE 6.
Pharmacologic inhibition of EZH2 reduces global H3K27me3 levels in vivo. A, representative immunoblot analysis of EZH2 and H3K27me3 levels in CD4+CD25+ cells, colon, and pancreas harvested from DZNep + 2% DSS-treated animals. B, quantification by densitometry of H3K27me3 immunoblot bands from isolated Treg cells in four independent experiments. For densitometry analysis, significance was determined using a non-parametric, unpaired t test of significance (Mann-Whitney). *, p < 0.05. The data are generated from n = 8 animals, 4/group.
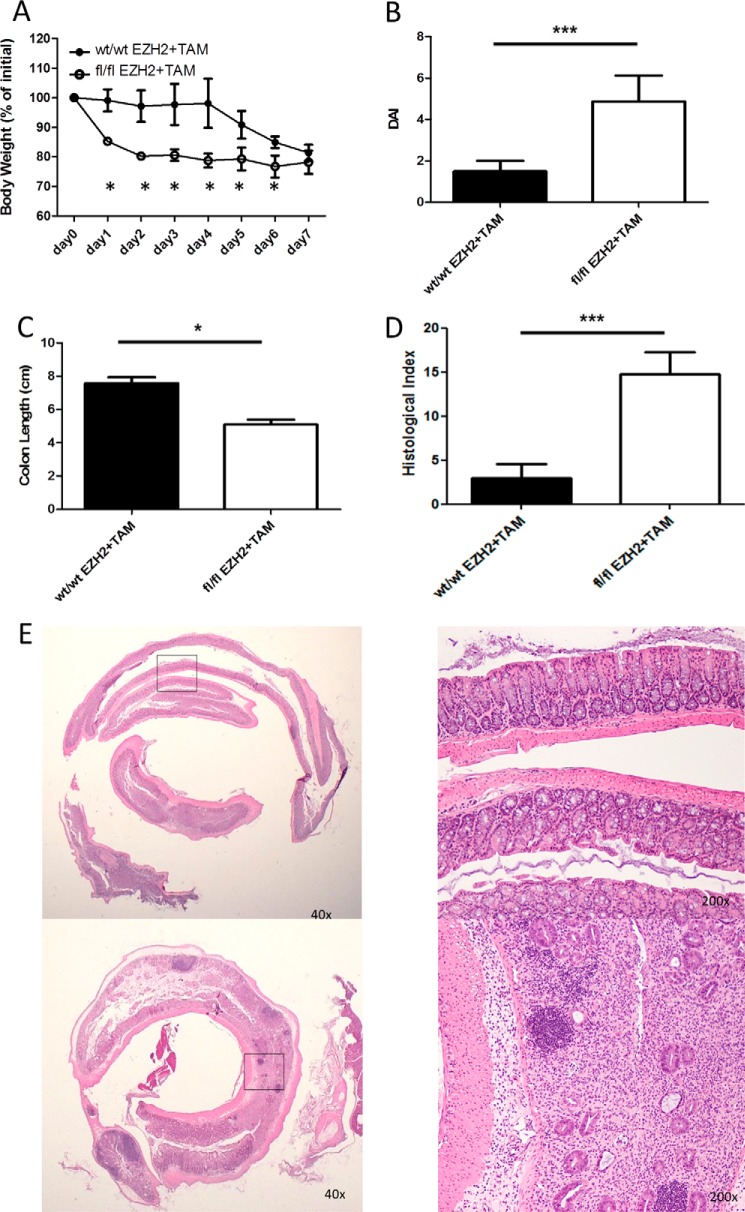
To substantiate the pharmacological results and control for off-target effects, we developed a tamoxifen-inducible genetic KO mouse model under promotional control of FOXP3. EZH2fl/fl and EZH2wt/wt animals were treated with tamoxifen and concurrent DSS. EZH2fl/fl mice experienced a marked mucosal immune response to DSS, as demonstrated by weight loss, gross colitis at necropsy, shortening of the colon, and severe colitis upon blinded histologic assessment (Fig. 7).
FIGURE 7.
Tamoxifen-inducible loss of EZH2 results in heightened intestinal immune reactivity. A–D, demonstration of weight change (A), clinical disease activity index (DAI, B), colon length (C), and blinded histologic inflammatory index (D) in tamoxifen-treated CRE × EZH2 fl/fl animals versus tamoxifen-treated CRE EZH2 WT/WT controls exposed to 3% DSS. E, representative colon histologic section demonstrating significant inflammation and ulceration. Statistical significance for weight change was determined using the Holm-Sidak method, with α = 5.000% (p < 0.05). Each time point was analyzed individually without assuming a consistent S.D. For colon length and histologic and disease activity index, significance was determined using a non-parametric, unpaired t test of significance (Mann-Whitney), p < 0.05. The data are generated from n = 8 animals, 4/group. *, p ≤ 0.05; ***, p ≤ 0.0001.
Thus, from these data, we infer that inhibition of the FOXP3 cofactor EZH2 by genetic and pharmacologic approaches leads to heightened immune responsiveness with potential inflammatory consequences in the mucosa. Given these findings and our interest in translating experimental data to human disease, we subsequently assessed the status of the FOXP3/EZH2 regulatory network in human patients with the IBD Crohn's disease (CD).
Deregulation of Common FOXP3 and EZH2 Gene Regulatory Networks Is a Hallmark of Human Crohn's Disease
In the mouse, EZH2 functions as a cofactor for FOXP3 in mediating gene-silencing activity (13). More specifically, EZH2-mediated H3K27me3 marks FOXP3-bound enhancer elements poised for repression in murine Treg cells (13, 27). However, the relevance of this interaction to human disease remains to be established. We comparatively studied the gene expression profile in CD4+ lymphocytes isolated from the ileum of 21 CD-affected individuals and 12 age/gender-matched control individuals (CTRL) by performing RNA sequencing (RNA-Seq).
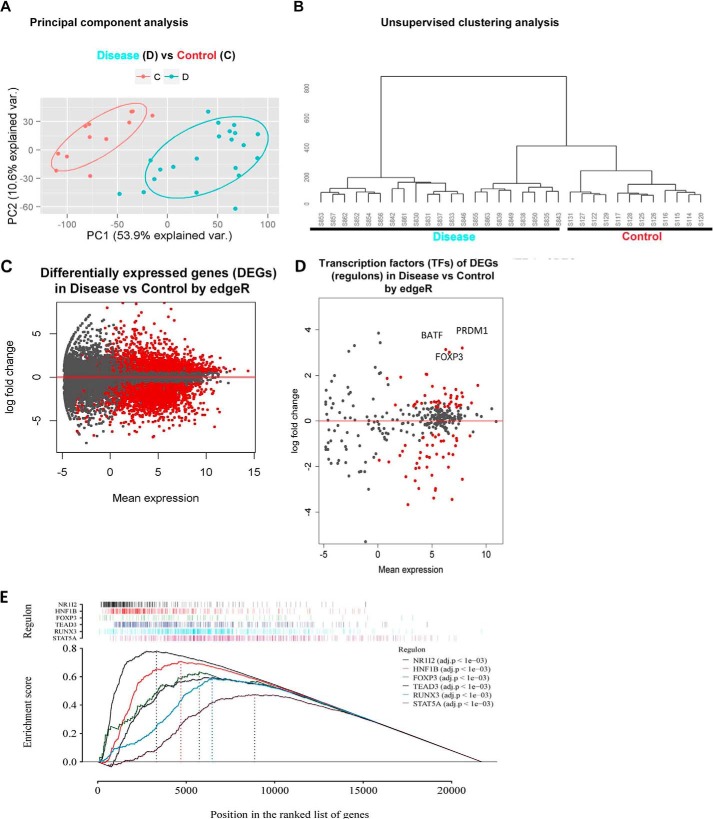
Using normalized RPKM data, we conducted both principal components and unsupervised clustering analyses, which showed that the samples from CD patients and CTRLs separated into two distinct groups (Fig. 8, A and B), demonstrating marked differences in their gene expression patterns. Differential expression analysis between CD and CTRL samples revealed 8674 (40%) differentially expressed genes (DEGs) at a false discovery rate (FDR) of <0.05 from the read count-based edgeR statistical model. After filtering out the genes minimally expressed (the mean RPKM values in both groups less than 1) and those with a -fold change of less than 1.5-fold, we obtained 5328 confident DEGs, among which 2512 were up-regulated and 2816 were down-regulated in CD samples compared with CTRL (Fig. 8C).
FIGURE 8.
RNA sequencing profiles from terminal Ileal CD4+ lymphocytes from patients with Crohn's disease reveal a significant deregulation of the FOXP3 pathway. A, principal component analysis separates patients (blue dots represent individual patients, D) from controls (orange dots, C). B, unsupervised hierarchical clustering analysis likewise segregates patients (left) from control subjects (right). C, differential expression analysis between patients and CTRL samples shows 5328 confident DEGs (red dots represent significant differential expression), of which 2512 are up-regulated and 2816 down-regulated in CD samples compared with CTRL. D, differential expression analysis of established TFs demonstrating significant differential expression of 83 TFs (red dots). FOXP3, basic zipper transcription factor (BATF), and PRDM1 represent the top three up-regulated TFs. E, GSEA demonstrating the enrichment scores of six significantly enriched regulon networks.
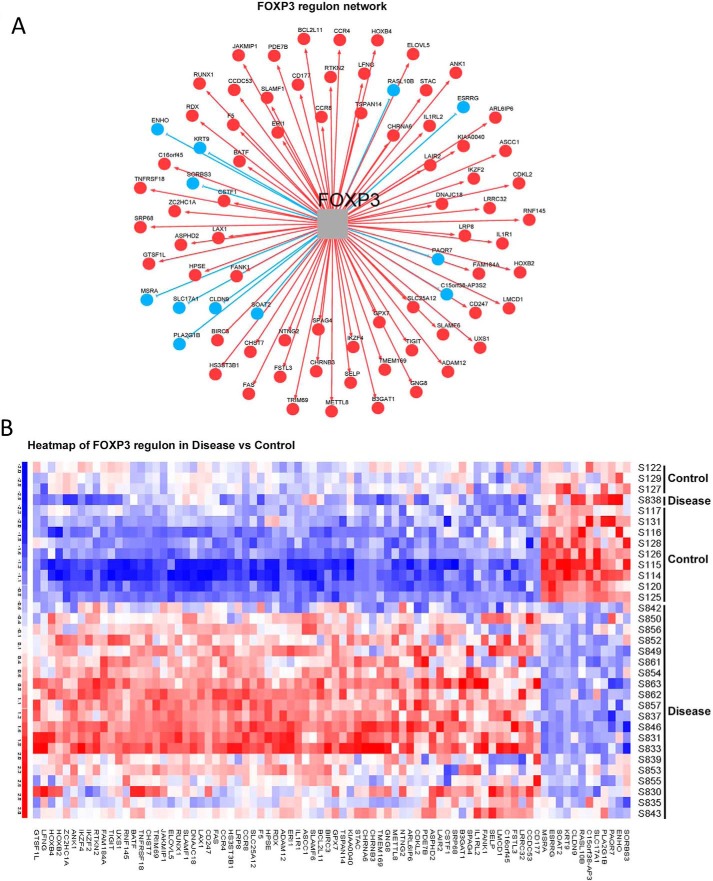
Subsequently, we assessed the importance of FOXP3 as a key transcriptional regulator in CD pathology through upstream regulator analysis for gene expression. Among the DEGs, 83 were well defined transcription factors (TFs) (28). Notably, FOXP3 was among the top three up-regulated TFs (supplemental Table S1 and Fig. 8D). Through master regulatory analysis (29, 30), we tested the importance of FOXP3 and its associated regulatory network (regulon) among the key transcriptional regulators and their networks altered in patient samples. Of these 83 TFs, 69 were significantly differentially expressed at an FDR of less than 0.05 (red dots, Fig. 8D, and supplemental Table S2). 41 of 69 were also significant through gene set enrichment analysis (FDR < 0.05, supplemental Table S2). Of these 41 regulatory networks, the FOXP3 regulon, with 80 gene members (green tracing GSEA, Fig. 8E, observed score 0.63, p = 0.000999, adjusted p = 0.002) was a significant and consistently changed regulon in both analyses (supplemental Table S2). Approximately half (39 of 80) of the FOXP3 regulon members were direct targets of FOXP3, as defined by ChIP sequencing methodology (31). 68 of the 80 regulon gene members were overrepresented in patient samples (red cells, Fig. 9, A and B), whereas only 12 were down-regulated (blue cells, Fig. 9, A and B). This marked up-regulation of FOXP3 regulon members suggested impairment of the established FOXP3-mediated gene repressor function (13). As EZH2 functions as a co-factor for FOXP3-mediated gene repression, we next tested whether a set of shared EZH2 and FOXP3 gene targets were enriched within the set of DEGs in Crohn's-associated T cells.
FIGURE 9.
Deregulation of the FOXP3 regulon. A, identification of the 80 specific gene members of the FOXP3 regulon, with red circles indicating up-regulation (68 genes) and blue circles down-regulation (12 genes). B, heatmap representing differential expression of the 80 FOXP3 regulon members between patients (Disease) compared with control subjects.
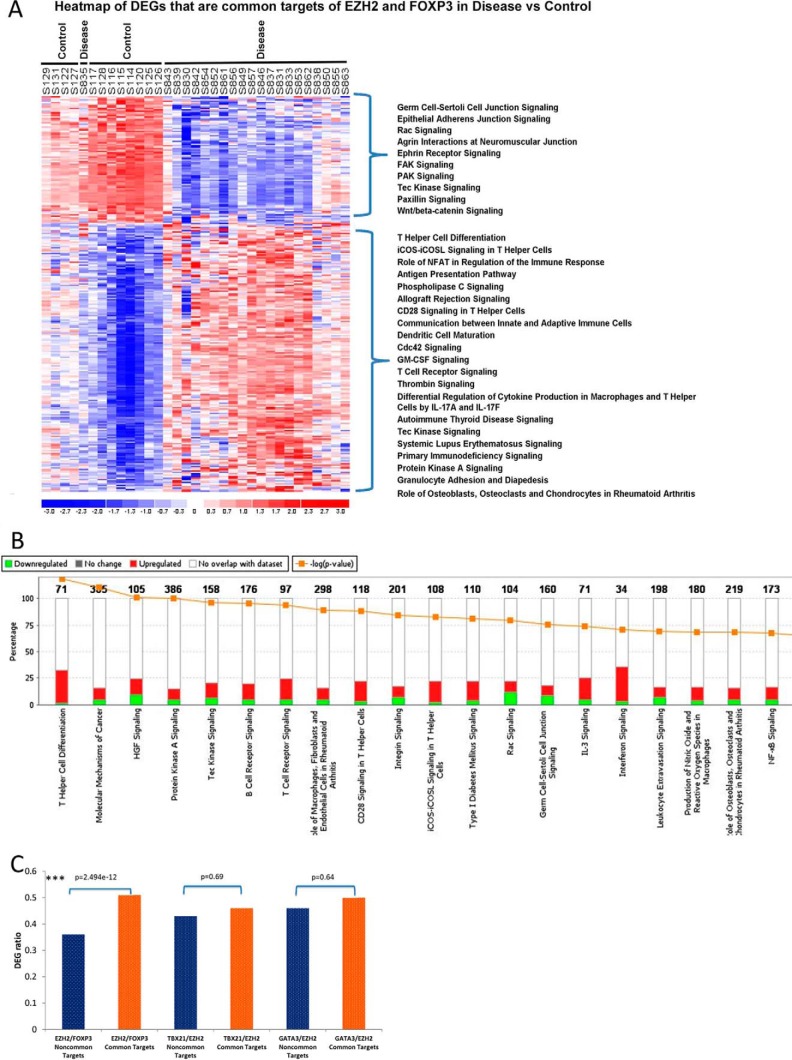
We analyzed the expression of the 1894 EZH2-associated gene targets previously identified in human CD4+ cells (32). There was significant enrichment of EZH2 targets in our sample, as 863 (45.6%) were differentially expressed (p < 2.2e−16). To infer a potential coordinated function between FOXP3 and EZH2 in human CD4+ T cells, we analyzed common gene targets (n = 275) established in a previous study (13). Of these, 187 were differentially up-regulated, and 88 were down-regulated, in CD subjects compared with CTRL (Fig. 10A). Furthermore, 80 of 187 (42.4%) up-regulated common gene targets are marked by H3K27Me3 (the histone mark of EZH2 activity associated with gene silencing) in normal primary Treg cells derived from the Roadmap Epigenomics Project. Pathway analysis of the common gene targets showed the most enriched pathway to be T helper cell differentiation, with 9 of 10 genes being up-regulated (Fig. 10B). To demonstrate the specificity of this putative EZH2 and FOXP3 interaction, we performed parallel analyses for two additional T cell lineage-specific transcription factors, TBX21 and GATA3. Although we observed that the enrichment of FOXP3 and EZH2 shared gene targets in the set of DEGs was not due to chance (enrichment common targets versus non-common targets, chi-squared test value 2.5e−12, Fig. 10C), the same was not true for common targets of EZH2 with either TBX21 or GATA3 (both p 0.05). Together, the results from these analyses support a model whereby deregulation of genes that are normally repressed by the FOXP3-EZH2 pathway is a transcriptional hallmark of CD4+ lymphocytes from CD-affected patients.
FIGURE 10.
Up-regulation of differentially expressed FOXP3 and EZH2 targets indicates deregulation of a FOXP3-EZH2 pathway in Crohn's disease. A, heatmap of differential expression of 275 gene targets co-regulated by EZH2 and FOXP3. 187 of 275 gene targets were up-regulated. Shown is the rank order of ingenuity pathway application canonical pathways of up-regulated (top bracket) and down-regulated (bottom bracket) genes of patients compared with control subjects. B, ingenuity pathway analysis demonstrating the top enriched canonical pathways (x axis), the enrichment of DEGs within each pathway (y axis), and the status as up-regulation (red) or down-regulation (green). C, the ratio of TF (FOXP3, TBX21, or GATA3) and EZH2 common targets over non-common targets represented within the set of DEGs were compared using chi-squared test. Although the DEGs were significantly enriched for the common targets of FOXP3 and EZH2, there was no significant difference for the common targets of either TBX21 or GATA3 with EZH2.
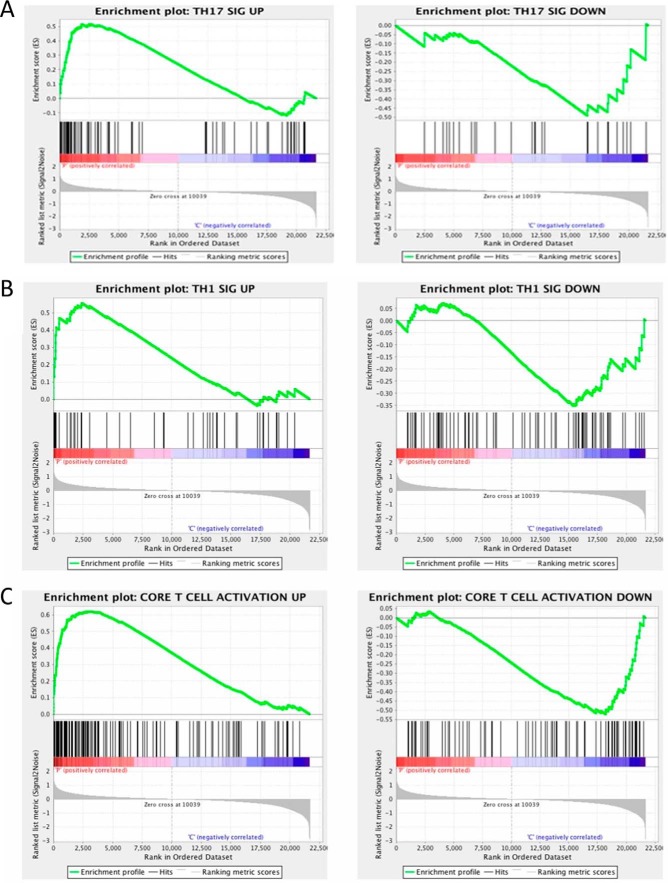
Finally, we compiled T cell-specific signature gene sets from a previously reported study (33) from which we sought to clarify the T helper cell phenotype in CD lesions using GSEA. This important experimental set is clinically relevant to therapeutic drug selection, as more precise cytokine signaling pathways are targeted in CD. We found that Th17 signature up-regulated genes were most significantly enriched in CD4+ expression profiles of CD patients (Fig. 11A). Th17-associated down-regulated genes were enriched in controls with a nominal p value of 0.08 (Fig. 11A). Besides Th17 signature genes, we found a similar enrichment of up-regulated signature genes representing T cell activation and Th1 profiles in CD patients (nominal p < 0.25; Fig. 11, B and C). Collectively, this analysis suggested that the transcriptional profile of CD4+ lymphocytes in CD is most consistent with a Th1/Th17 signature. Thus, the data reported here further extend our knowledge of pathophysiological mechanisms underlying IBD by supporting a role for the epigenetic writer EZH2 in the enforcement of key lineage-specific CD4+ T cell gene networks deregulated in human CD.
FIGURE 11.
GSEA of signature gene sets within 5328 DEGs. A, GSEA demonstrating the up-regulated Th17-specific gene set to be significantly enriched in the patient expression dataset (left panel), whereas the down-regulated Th17 dataset is enriched in the expression set from the CTRL subjects (right panel). Similar patterns are evident for the Th1 gene set (B) and the core T cell activation gene set (C).
Discussion
The significant contribution of this study is the identification of a proinflammatory phenotype of EZH2-deficient FOXP3+ lymphocytes in mutant mice. Furthermore, we identified a deregulated EZH2-dependent gene expression network to be a phenotypic feature of T cells that reside within the active inflammation of Crohn's disease. Last, as human trials have begun testing anti-EZH2 therapy in lymphoma, we evaluated the mucosal inflammatory response to a chemical irritant in the setting of pharmacologic deregulation of EZH2. Combined, these experiments support the conclusion that EZH2 is critical to maintaining intestinal immunologic homeostasis. Moreover, deregulation of EZH2-enforced gene networks contributes to colitis in both mice and humans, and EZH2 pharmacologic inactivation affects these pathways, leading to increased mucosal immune responsiveness. Thus, this knowledge is highly relevant to better understand the mechanisms of human diseases and define the potential iatrogenic effects of the novel anti-EZH2 therapy.
During the conduct of our studies, two additional reports have been published indicating an important role for EZH2 in the regulation of both T effector and Treg cells (4, 14). Our study confirms and extends key results in an original and biomedically relevant manner. Key confirmatory experimental sets include the spontaneous autoinflammatory phenotype of mutant mice bearing Treg-specific ablation of EZH2 (14) and the impaired in vitro suppressive function of these cells (4). However, the extreme phenotype of EZH2Δ/ΔFOXP3+ mice as defined by generalized autoimmunity at 21 days was unique to our report and may represent the efficiency of excision related to CRE expression within founder FOXP3-GFP-hCRE mouse lines. More importantly, our work advances previous data by ascribing, for the first time, a pro-inflammatory phenotype to the EZH2-deficient FOXP3+ cell and providing insights into this critical inhibitory network in human disease.
We find that deregulation of an EZH2-enforced pathway is a signature of the gene expression network found in T cells from Crohn's-affected mucosa. These data suggest the potential impact of a single chromatin modifier on many transcriptional pathways previously associated with IBD. Unlike in cancer, where it is reported that most driver mutations occur in various epigenetic modifiers upstream of mediator genes (34), genome-wide association study (GWAS) conducted in IBD has not to date identified epigenetic complexes of interest (1). However, our data suggests significant interplay between epigenetic pathways and IBD-relevant transcriptional programs. Thus it is tempting to speculate that epigenetic complexes regulate relevant gene networks in genetically susceptible individuals in response to environmental factors. Further investigation is warranted given the observation that any single established genetic variant carries a low odds ratio of being associated with disease (1) and that epigenetic modifiers serve as conductors of large complex gene networks. We now understand the immune cellular pathophysiology of IBD to be more complex than the disruption of individual signaling pathways (i.e. the RAR-related orphan receptor gamma (RORγt)-driven Th17 cellular phenotype and, more recently, the SMAD3 pathway (35, 36)), as evidenced by the identification of T cells co-expressing multiple lineage-specific transcription factors (i.e. FOXP3 and RORγt (37–39)) within the inflamed mucosa. We suggest that focusing on better understanding how writers, readers, and erasers of the histone code function as the ultimate effectors of these key disease-associated transcriptional pathways will significantly advance our knowledge of the mechanisms of disease and provide more effective therapeutic alternatives. Now we explore evidence that currently exists in support of a postulated link between IBD-associated inflammatory pathways and EZH2 (and, by analogy, other important epigenetic regulators).
EZH2 function may be regulated in several ways. The most commonly reported mechanism of EZH2 regulation is through posttranslational modifications leading to protein stabilization or, conversely, protein degradation. The most consistently reported physiologic modification is the phosphorylation of EZH2 at the Thr-345 and Thr-487 position by CDK1, leading to ubiquitination and degradation (40). This event is critical for cell cycle progression and has recently shown to be blocked by p300/CBP-associated factor (PCAF)-induced acetylation at the Lys-348 position (41), leading to enhanced EZH2 stability. These modifications have clear implications for cancer biology, as EZH2 modifications promoting protein stability have been recently associated with lung cancer (42) and lymphoma (43). An example of a critical motif with clear human evidence of disease pathogenesis is Tyr-641; variable mutations in humans lead to lymphoma, reportedly through hyperactivation (Y641S) (44) or altered substrate specificity or affinity (45, 46). It is tempting to speculate that cytokine signaling pathways common in the intestinal milieu of CD may lead to kinase activation regulating EZH2 function, as has been suggested for Akt- and Stat3-dependent pathways (47, 48). Indeed, JAK2-dependent ubiquitination of EZH2 resulting in protein degradation has recently been described (43). Given the emergence of small-molecule inhibitors of JAK signaling in clinical trials for IBD, further mechanistic information about the effect of these therapies on EZH2 biology is urgently needed.
Anti-EZH2 therapy has emerged as a promising therapy for cancer, with the drug development programs being most advanced in B cell non-Hodgkin's lymphoma (NCT01897571). Promising preliminary results support the continued development of this form of therapy. It is notable that all inhibitors disclosed to date block EZH2 activity through a co-factor S-adenosylmethionine-competitive mechanism. These current therapies do not appear to disrupt complex formation or protein stability (49). Our observation that systemic anti-EZH2 therapy leads to mucosal hypersensitivity in mice deserves follow-up experimentation. Furthermore, insight into the mechanisms of EZH2 dysfunction particular to immune cells in the setting of inflammatory signaling pathways is of critical importance; further tailoring therapy to particular protein interactions may spare immune off-target effects.
In conclusion, we have examined the capacity of the epigenetic writer EZH2 to regulate T cell pathways aberrant in human Crohn's disease. Using genetic mouse models, we mechanistically dissected the capacity for EZH2 to regulate one such lineage-specific master transcription factor, FOXP3. Models of human IBD demonstrated that interfering with EZH2 by genetic or pharmacologic methods resulted in increased susceptibility to colitis. Based on previous data that characterize the regulation of EZH2 by distinct signaling cascades, we believe that the inflammatory milieu found in IBD leads to deregulation of EZH2-enforced T cell gene networks, perpetuating intestinal inflammation. Thus, future investigation into cytokine-dependent EZH2 modifications is warranted and may elucidate novel treatment paradigms and tools to predict disease progression and/or severity.
Experimental Procedures
Mouse Strains
B6.Cg-Foxp3tm2(EGFP)TCh, B6.129S7-Rag1tm1mom, B6.NOD-Tg(Foxp3-EGFP/cre)1aJbs, and C57BL/6J-Tg(Foxp3tm9(EGFP/cre/ERT2)Ayr/J mice were initially purchased from the Jackson Laboratory and backcrossed to a C57BL/6 background in conventional housing in the Mayo Clinic animal facility. The EZH2 floxed mouse model was generated at Rockefeller University (50).
C57BL/6J mice and C57BL/6J RAG-1 mice were initially purchased from the Jackson Laboratory and bred in conventional housing in the Mayo Clinic animal facility. The Coxsackie adenovirus receptor (CAR) transgenic mouse was obtained through the NIAID, National Institutes of Health Exchange Program: Balb/cJ[Tg]CARdelta1-[Tg]DO11.10 mouse line 4285 (51). The CAR mouse expresses the Coxsackie adenovirus receptor transgene and is optimal for adenoviral transduction studies in resting lymphocytes. All of the mice used in the experiments were males 4–20 weeks of age. The mice were co-caged and sibling-matched in experiments comparing EZH2fl/fl with EZH2Δ/Δ. All animal work was done in accordance with and reviewed/approved by the Mayo Clinic Institutional Animal Care and Use Committee.
Cytokine Analysis
Cytokine levels were determined in supernatants using the BD cytometric bead array mouse Th1/Th2/Th17 kit (BD Bioscience) according to the instructions of the manufacturer and analyzed using FCAP Array version 3 software (Soft Flow Hungary Ltd., Pécs, Hungary).
Isolation of Primary T Cells
Murine naïve CD4+ splenocytes were isolated using a combination of magnetic separation kits (Miltenyi Biotec). Sequential use of the CD4+CD25+ regulatory T cell isolation kit and the CD4+CD62L+ T cell isolation kit resulted in naïve FOXP3-negative T cells used for in vitro induction of FOXP3.
Cell Stimulation
In vitro activation of the isolated T cells followed similar conditions among the different cell types. Anti-CD3 (145-2C11, BD Biosciences) for the mouse T cells was plate-bound at 2 μg/ml. Soluble anti-CD28 (BD Biosciences) at 2 μg/ml plus 100 units/ml IL-2 was added to the cultures throughout the incubation period. In vitro activation of the isolated T cells followed similar conditions Anti-CD3 plate-bound, soluble anti-CD28, and IL-2 were added to the cultures throughout the incubation period. Human TGFβ1 recombinant (PeproTech) at a concentration of 5 ng/ml was used to generate adaptive Treg cells.
Suppression Assays
For suppression assays, CD4+CD252+ cells were sorted from splenocytes using anti-CD4/anti-CD25-conjugated beads (Miltenyi Biotec) as described previously (52). Mixed lymphocyte reactions (MLRs) were performed using 1 × 10⁵ CD4+CD25− T responder cells and 1 × 10⁵ irradiated (3300 rads) T cell-depleted antigen presenting cells (APCs) isolated from the same animals. Treg cells were added to the cell culture at titrations of 1:12–1:1. The culture medium was complete RPMI supplemented with 10% FBS and 2.5 μg/ml anti-CD3 (UCHT1) and anti-CD28 (BD Biosciences) at 2 μg/ml. Proliferation was read at 4 days upon addition of 1 μCi tritiated thymidine for the last 18 h of culture.
RNA Isolation, cDNA Synthesis, and Quantitative Real-time PCR
Total RNA was isolated using the protocol of the manufacturer in the RNeasy Mini Kit (Qiagen). cDNA was synthesized from 0.5–1 μg of total RNA with random primers using the SuperScript® Kit III First-Strand (Invitrogen). 2 μl of reverse transcription products was used for each real-time PCR. PCRs were performed in 20 μl of total volume that contained primers and 10 μl of Express SYBR Green ER Quantitative PCR Supermaster Mix (Invitrogen).
Targeted Microarray
The CD4+ cells were first sorted from the spleens of 21- to 34-day-old mice using a Miltenyi magnet prior to the isolation of the Foxp3 GFP cells using an Aria FACS sorter. The 15,000–40,000 cells collected were then immediately processed with the Micro RNAeasy kit from Qiagen to isolate the RNA needed for the microarrays.
Transcript levels were compared between EZHKO (n = 4) or EZH heterozygous (n = 4) and WT Cre (n = 3) mice utilizing SABioscience pathway-focused mouse T helper cell differentiation PCR arrays. PCR cycles were completed, and SYBR was detected with the Bio-Rad CFX96 real-time PCR machine. Arrays were analyzed, and -fold up/down-regulation (ΔΔCt) calculated with SABioscience RT 2 Profiler PCR array data analysis software.
DSS Colitis
The mice were given water supplemented with 2% dextran sulfate sodium salt for 5 days. The water was then replaced with normal drinking water for 3 more days prior to the mice being sacrificed for tissue removal for histology. The mice were weighed every day, and their colon lengths were determined during autopsy. The degree of colitis was quantified using three outcome variables: weight loss, colon histology, and a disease activity index. The disease activity index is an established clinical index of colitis severity encompassing clinical signs of colitis (wasting and hunching of the recipient mouse and the physical characteristics of stool) and an ordinal scale of colonic involvement (thickness and erythema) (53). We adapted an existing histology damage score for the DSS colitis model (54). This score assesses eight parameters, including extent of crypt loss, depth of erosions/ulcers, and semiquantitative assessment of inflammatory cells. We added one additional parameter: extent of re-epithelialization when erosions/ulcers were present/expressed as ratio of re-epithelialized ulcer to non-epithelialized ulcer. Tamoxifen (Sigma) was dissolved 40 mg/ml in corn oil and injected three times over 5 days at a dose of 0.2 mg/g.
EZH2 Inhibitors
DZNep (Calbiochem) was injected i.p. at 5 mg/kg three times every other day for 5 days concurrently with 2% DSS treatment. Vehicle control mice received equivalent 200-μl injections (1% ethanol/PBS). Each group had a total of 10 mice. For in vitro EZH2 inhibitor treatment, CD4+CD25+, CD4+CD62L+ cells were cultured as described and treated with either vehicle or 5 μm DZNep (Calbiochem), 5 μm EPZ-6438 (Cayman Chemical), 5 μm GSK503 (ApexBio), or 5 μm GSK126 (Sellekchem).
Human Patient Sample Collection, Processing, and IRB Approval
Human samples were collected in accordance with the Mayo Clinic Institutional Review Board guidelines.
RNA-Seq of Human Samples
Isolation of lamina propria CD4+ lymphocytes has been described previously (52). Briefly, resection specimens or mucosal biopsies of the terminal ileum were obtained from patients with Crohn's disease or age/sex-matched healthy control individuals. The tissue initially underwent mechanical disruption in the presence of 1 mm EDTA in a 37 °C CO2 incubator for 30 min, followed by collagenase (1 mg/ml), DNase (1 mg/ml), and trypsin inhibitor (1 mg/ml) overnight at 4 °C in cRPMI supplemented with 10% human serum. After passage through a 70-μm cell strainer, the buffy coat was isolated using Ficoll gradient centrifugation. CD4+ lamina propria cells were isolated using magnetic bead sorting (CD4+ T cell isolation kit, 130-091-155, Miltenyi Biotec) and two passes through the LS column on the MACS magnet separator. Purification (>95% purity) was confirmed by flow cytometry.
mRNA Sequencing
Total RNA extraction was performed using the Exiqon miRCURY RNA isolation kit. For RNA sequencing, we used the Illumina TruSeq RNA library preparation protocol and sequenced through a HiSeq2000 sequencer (3–4 samples/lane), which generated 42–113 million pair-end 50-base reads for each sample.
Bioinformatics Data Analysis
MAPR-Seq v1.2 was used for data processing. Briefly, sequence reads in fastq format were aligned to the human genome build 37 using TopHat (2.0.6) with Bowtie (0.12.7) (55, 56). HTSeq (0.5.3p9) (57) was used to perform gene counting. Differentially expressed genes were identified using edgeR 3.8.6 (58). Genes without any reads in any of the samples were first removed. To focus on the genes that were highly significant with sufficient expression, we applied the filters of FDR < 0.05, -fold change >1.5 and at least one group RPKM mean value >1 for each gene. For principal components analysis and unsupervised clustering, log2 RPKM-normalized data (59) were used. Pathway/gene network enrichment analysis for differentially expressed genes was performed using ingenuity pathway applications. Pathways with at least one gene mapped were evaluated for enrichment by hypergeometric test, and those with p < 0.01 were considered significant.
The master regulator analysis was conducted using a method described previously (29, 30). The algorithms infer a transcriptional network by mutual information after multiple hypothesis testing corrections and bootstrapping. Enrichment analysis was conducted on each transcriptional network, which computes the overlap between the transcriptional regulatory unities (regulons) and the input signature genes using the hypergeometric distribution with multiple testing corrections. GSEA (60) was also applied to assess whether a given transcriptional regulatory network is enriched for genes that are differentially expressed between the patients and control CD4+ cell gene expression. The regulons are treated as gene sets in this case.
Statistical Methodology
Statistical analyses were performed using JMP version 9.0 (SAS Institute, Cary, NC). Non-parametric unpaired t test was performed using Mann-Whitney t test, and p < 0.05 was considered statistically significant. For multiple comparisons, statistical significance was determined using the Holm-Sidak method, with α = 5.000% (p < 0.05). Each variable was analyzed individually without assuming a consistent S.D.
Author Contributions
O. F. S., study concept and design, data acquisition, data analysis and interpretation, and manuscript preparation; P. A. S. and Y. X., data acquisition and interpretation and manuscript preparation and revision; Z. S., data analysis and interpretation and manuscript preparation and revision; A. O. B. and A. J. M., data acquisition, data analysis and interpretation, and manuscript preparation; T. C. S., data analysis and interpretation and manuscript revision; A. A. N. and S. B., data analysis and interpretation; M. G. and M. S., data acquisition and interpretation; D. M., G. G., and R. J. X., data acquisition, analysis, and manuscript revision for important intellectual content; J. F., data acquisition and manuscript preparation; K. A. P., concept design and critical manuscript revision for important intellectual content; R. A. U., study design, data interpretation, and manuscript preparation; W. A. F., study supervision, study concept and design, data analysis and interpretation, manuscript preparation, and funding acquisition.
Supplementary Material
This work was supported by Crohn's and Colitis Foundation of America Fellowship award 271332 and Career Development Award 401661 (to O. F. S.); the Mayo Clinic Foundation (to K. A. P.); National Institutes of Health Grant RO1 DK52913 (to R. A. U.); Career Developmental Award Mayo Clinic SPORE in Pancreatic Cancer and Career Developmental Award Mayo Clinic Center for Cell Signaling in Gastroenterology (to G. A. L.); and NIAID, National Institutes of Health Grant RO1 AI089714 and the Leona Helmsley Charitable Trust (to W. A. F.). The authors declare that they have no conflicts of interest with the contents of this article. The content is solely the responsibility of the authors and does not necessarily represent the official views of the National Institutes of Health.

This article contains supplemental Tables S1 and S2.
- Treg
- regulatory T
- HMT
- histone methyltransferase
- H3K27
- histone H3 at lysine 27
- H3K27me3
- trimethylated histone H3 at lysine 27
- IBD
- inflammatory bowel disease
- CRE
- cAMP response element
- DZNep
- 3-deazaneplanocin A
- DSS
- dextran sodium sulfate
- CD
- Crohn's disease
- CTRL
- control
- RPKM
- reads per kilobase per million mapped reads
- DEG
- differentially expressed gene
- FDR
- false discovery rate
- TF
- transcription factor
- regulon
- regulatory network
- GSEA
- gene set enrichment analysis
- SET
- drosphila su(var)3-9 and enhancer of zeste present in trithorax protein.
References
- 1. Jostins L., Ripke S., Weersma R. K., Duerr R. H., McGovern D. P., Hui K. Y., Lee J. C., Schumm L. P., Sharma Y., Anderson C. A., Essers J., Mitrovic M., Ning K., Cleynen I., Theatre E., et al. (2012) Host-microbe interactions have shaped the genetic architecture of inflammatory bowel disease. Nature 491, 119–124 [DOI] [PMC free article] [PubMed] [Google Scholar]
- 2. Zhu J., Yamane H., and Paul W. E. (2010) Differentiation of effector CD4 T cell populations. Annu. Rev. Immunol. 28, 445–489 [DOI] [PMC free article] [PubMed] [Google Scholar]
- 3. Luo C. T., Liao W., Dadi S., Toure A., and Li M. O. (2016) Graded Foxo1 activity in Treg cells differentiates tumour immunity from spontaneous autoimmunity. Nature 529, 532–536 [DOI] [PMC free article] [PubMed] [Google Scholar]
- 4. Yang X. P., Jiang K., Hirahara K., Vahedi G., Afzali B., Sciume G., Bonelli M., Sun H. W., Jankovic D., Kanno Y., Sartorelli V., O'Shea J. J., and Laurence A. (2015) EZH2 is crucial for both differentiation of regulatory T cells and T effector cell expansion. Sci. Rep. 5, 10643. [DOI] [PMC free article] [PubMed] [Google Scholar]
- 5. Lal G., and Bromberg J. S. (2009) Epigenetic mechanisms of regulation of Foxp3 expression. Blood 114, 3727–3735 [DOI] [PMC free article] [PubMed] [Google Scholar]
- 6. Michels A. W., and Gottlieb P. A. (2010) Autoimmune polyglandular syndromes. Nat. Rev. Endocrinol. 6, 270–277 [DOI] [PubMed] [Google Scholar]
- 7. Ramsdell F., and Ziegler S. F. (2014) FOXP3 and scurfy: how it all began. Nat. Rev. Immunol. 14, 343–349 [DOI] [PubMed] [Google Scholar]
- 8. O'Meara M. M., and Simon J. A. (2012) Inner workings and regulatory inputs that control Polycomb repressive complex 2. Chromosoma 121, 221–234 [DOI] [PMC free article] [PubMed] [Google Scholar]
- 9. Mandal M., Powers S. E., Maienschein-Cline M., Bartom E. T., Hamel K. M., Kee B. L., Dinner A. R., and Clark M. R. (2011) Epigenetic repression of the Igk locus by STAT5-mediated recruitment of the histone methyltransferase Ezh2. Nat. Immunol. 12, 1212–1220 [DOI] [PMC free article] [PubMed] [Google Scholar]
- 10. Jacob E., Hod-Dvorai R., Schif-Zuck S., and Avni O. (2008) Unconventional association of the polycomb group proteins with cytokine genes in differentiated T helper cells. J. Biol. Chem. 283, 13471–13481 [DOI] [PubMed] [Google Scholar]
- 11. Tumes D. J., Onodera A., Suzuki A., Shinoda K., Endo Y., Iwamura C., Hosokawa H., Koseki H., Tokoyoda K., Suzuki Y., Motohashi S., and Nakayama T. (2013) The polycomb protein Ezh2 regulates differentiation and plasticity of CD4(+) T helper type 1 and type 2 cells. Immunity 39, 819–832 [DOI] [PubMed] [Google Scholar]
- 12. Xiong Y., Khanna S., Grzenda A. L., Sarmento O. F., Svingen P. A., Lomberk G. A., Urrutia R. A., and Faubion W. A. Jr. (2012) Polycomb antagonizes p300/CREB-binding protein-associated factor to silence FOXP3 in a Kruppel-like factor-dependent manner. J. Biol. Chem. 287, 34372–34385 [DOI] [PMC free article] [PubMed] [Google Scholar]
- 13. Arvey A., van der Veeken J., Samstein R. M., Feng Y., Stamatoyannopoulos J. A., and Rudensky A. Y. (2014) Inflammation-induced repression of chromatin bound by the transcription factor Foxp3 in regulatory T cells. Nat. Immunol. 15, 580–587 [DOI] [PMC free article] [PubMed] [Google Scholar]
- 14. DuPage M., Chopra G., Quiros J., Rosenthal W. L., Morar M. M., Holohan D., Zhang R., Turka L., Marson A., and Bluestone J. A. (2015) The chromatin-modifying enzyme Ezh2 is critical for the maintenance of regulatory T cell identity after activation. Immunity 42, 227–238 [DOI] [PMC free article] [PubMed] [Google Scholar]
- 15. Godfrey V. L., Wilkinson J. E., and Russell L. B. (1991) X-linked lymphoreticular disease in the scurfy (sf) mutant mouse. Am. J. Pathol. 138, 1379–1387 [PMC free article] [PubMed] [Google Scholar]
- 16. Tone Y., Kidani Y., Ogawa C., Yamamoto K., Tsuda M., Peter C., Waldmann H., and Tone M. (2014) Gene expression in the Gitr locus is regulated by NF-κB and Foxp3 through an enhancer. J. Immunol. 192, 3915–3924 [DOI] [PMC free article] [PubMed] [Google Scholar]
- 17. Kornete M., Sgouroudis E., and Piccirillo C. A. (2012) ICOS-dependent homeostasis and function of Foxp3+ regulatory T cells in islets of nonobese diabetic mice. J. Immunol. 188, 1064–1074 [DOI] [PubMed] [Google Scholar]
- 18. Hovhannisyan Z., Treatman J., Littman D. R., and Mayer L. (2011) Characterization of interleukin-17-producing regulatory T cells in inflamed intestinal mucosa from patients with inflammatory bowel diseases. Gastroenterology 140, 957–965 [DOI] [PMC free article] [PubMed] [Google Scholar]
- 19. Ueno A., Jijon H., Chan R., Ford K., Hirota C., Kaplan G. G., Beck P. L., Iacucci M., Fort Gasia M., Barkema H. W., Panaccione R., and Ghosh S. (2013) Increased prevalence of circulating novel IL-17 secreting Foxp3 expressing CD4+ T cells and defective suppressive function of circulating Foxp3+ regulatory cells support plasticity between Th17 and regulatory T cells in inflammatory bowel disease patients. Inflamm. Bowel Dis. 19, 2522–2534 [DOI] [PubMed] [Google Scholar]
- 20. Shi L., Song L., Fitzgerald M., Maurer K., Bagashev A., and Sullivan K. E. (2014) Noncoding RNAs and LRRFIP1 regulate TNF expression. J. Immunol. 192, 3057–3067 [DOI] [PMC free article] [PubMed] [Google Scholar]
- 21. Bantug G. R., and Hess C. (2016) Glycolysis and EZH2 boost T cell weaponry against tumors. Nat. Immunol. 17, 41–42 [DOI] [PubMed] [Google Scholar]
- 22. Saeidi K. (2016) Myeloproliferative neoplasms: current molecular biology and genetics. Crit. Rev. Oncol. Hematol. 98, 375–389 [DOI] [PubMed] [Google Scholar]
- 23. Tan J., Yang X., Zhuang L., Jiang X., Chen W., Lee P. L., Karuturi R. K., Tan P. B., Liu E. T., and Yu Q. (2007) Pharmacologic disruption of Polycomb-repressive complex 2-mediated gene repression selectively induces apoptosis in cancer cells. Genes Dev. 21, 1050–1063 [DOI] [PMC free article] [PubMed] [Google Scholar]
- 24. Varambally S., Cao Q., Mani R. S., Shankar S., Wang X., Ateeq B., Laxman B., Cao X., Jing X., Ramnarayanan K., Brenner J. C., Yu J., Kim J. H., Han B., Tan P., et al. (2008) Genomic loss of microRNA-101 leads to overexpression of histone methyltransferase EZH2 in cancer. Science 322, 1695–1699 [DOI] [PMC free article] [PubMed] [Google Scholar]
- 25. Miranda T. B., Cortez C. C., Yoo C. B., Liang G., Abe M., Kelly T. K., Marquez V. E., and Jones P. A. (2009) DZNep is a global histone methylation inhibitor that reactivates developmental genes not silenced by DNA methylation. Mol. Cancer Ther. 8, 1579–1588 [DOI] [PMC free article] [PubMed] [Google Scholar]
- 26. Perse M., and Cerar A. (2012) Dextran sodium sulphate colitis mouse model: traps and tricks. J. Biomed. Biotechnol. 2012, 718617. [DOI] [PMC free article] [PubMed] [Google Scholar]
- 27. Schubert L. A., Jeffery E., Zhang Y., Ramsdell F., and Ziegler S. F. (2001) Scurfin (FOXP3) acts as a repressor of transcription and regulates T cell activation. J. Biol. Chem. 276, 37672–37679 [DOI] [PubMed] [Google Scholar]
- 28. Fulton D. L., Sundararajan S., Badis G., Hughes T. R., Wasserman W. W., Roach J. C., and Sladek R. (2009) TFCat: the curated catalog of mouse and human transcription factors. Genome Biol. 10, R29. [DOI] [PMC free article] [PubMed] [Google Scholar]
- 29. Fletcher M. N., Castro M. A., Wang X., de Santiago I., O'Reilly M., Chin S. F., Rueda O. M., Caldas C., Ponder B. A., Markowetz F., and Meyer K. B. (2013) Master regulators of FGFR2 signalling and breast cancer risk. Nat. Commun. 4, 2464. [DOI] [PMC free article] [PubMed] [Google Scholar]
- 30. Carro M. S., Lim W. K., Alvarez M. J., Bollo R. J., Zhao X., Snyder E. Y., Sulman E. P., Anne S. L., Doetsch F., Colman H., Lasorella A., Aldape K., Califano A., and Iavarone A. (2010) The transcriptional network for mesenchymal transformation of brain tumours. Nature 463, 318–325 [DOI] [PMC free article] [PubMed] [Google Scholar]
- 31. Gavin M. A., Rasmussen J. P., Fontenot J. D., Vasta V., Manganiello V. C., Beavo J. A., and Rudensky A. Y. (2007) Foxp3-dependent programme of regulatory T-cell differentiation. Nature 445, 771–775 [DOI] [PubMed] [Google Scholar]
- 32. Zhang Y., Kinkel S., Maksimovic J., Bandala-Sanchez E., Tanzer M. C., Naselli G., Zhang J. G., Zhan Y., Lew A. M., Silke J., Oshlack A., Blewitt M. E., and Harrison L. C. (2014) The polycomb repressive complex 2 governs life and death of peripheral T cells. Blood 124, 737–749 [DOI] [PubMed] [Google Scholar]
- 33. Zhang H., Nestor C. E., Zhao S., Lentini A., Bohle B., Benson M., and Wang H. (2013) Profiling of human CD4+ T-cell subsets identifies the TH2-specific noncoding RNA GATA3-AS1. J. Allergy Clin. Immunol. 132, 1005–1008 [DOI] [PubMed] [Google Scholar]
- 34. Feinberg A. P., Koldobskiy M. A., and Göndör A. (2016) Epigenetic modulators, modifiers and mediators in cancer aetiology and progression. Nat. Rev. Genet. 17, 284–299 [DOI] [PMC free article] [PubMed] [Google Scholar]
- 35. Ivanov I. I., McKenzie B. S., Zhou L., Tadokoro C. E., Lepelley A., Lafaille J. J., Cua D. J., and Littman D. R. (2006) The orphan nuclear receptor RORγt directs the differentiation program of proinflammatory IL-17+ T helper cells. Cell 126, 1121–1133 [DOI] [PubMed] [Google Scholar]
- 36. Martinez G. J., Zhang Z., Chung Y., Reynolds J. M., Lin X., Jetten A. M., Feng X. H., and Dong C. (2009) Smad3 differentially regulates the induction of regulatory and inflammatory T cell differentiation. J. Biol. Chem. 284, 35283–35286 [DOI] [PMC free article] [PubMed] [Google Scholar]
- 37. Voo K. S., Wang Y. H., Santori F. R., Boggiano C., Wang Y. H., Arima K., Bover L., Hanabuchi S., Khalili J., Marinova E., Zheng B., Littman D. R., and Liu Y. J. (2009) Identification of IL-17-producing FOXP3+ regulatory T cells in humans. Proc. Natl. Acad. Sci. U.S.A. 106, 4793–4798 [DOI] [PMC free article] [PubMed] [Google Scholar]
- 38. Blatner N. R., Mulcahy M. F., Dennis K. L., Scholtens D., Bentrem D. J., Phillips J. D., Ham S., Sandall B. P., Khan M. W., Mahvi D. M., Halverson A. L., Stryker S. J., Boller A. M., Singal A., Sneed R. K., et al. (2012) Expression of RORγt marks a pathogenic regulatory T cell subset in human colon cancer. Sci. Transl. Med. 4, 164ra159. [DOI] [PMC free article] [PubMed] [Google Scholar]
- 39. Tartar D. M., VanMorlan A. M., Wan X., Guloglu F. B., Jain R., Haymaker C. L., Ellis J. S., Hoeman C. M., Cascio J. A., Dhakal M., Oukka M., and Zaghouani H. (2010) FoxP3+RORγt+ T helper intermediates display suppressive function against autoimmune diabetes. J. Immunol. 184, 3377–3385 [DOI] [PMC free article] [PubMed] [Google Scholar]
- 40. Wu S. C., and Zhang Y. (2011) Cyclin-dependent kinase 1 (CDK1)-mediated phosphorylation of enhancer of zeste 2 (Ezh2) regulates its stability. J. Biol. Chem. 286, 28511–28519 [DOI] [PMC free article] [PubMed] [Google Scholar]
- 41. Wan J., Zhan J., Li S., Ma J., Xu W., Liu C., Xue X., Xie Y., Fang W., Chin Y. E., and Zhang H. (2015) PCAF-primed EZH2 acetylation regulates its stability and promotes lung adenocarcinoma progression. Nucleic Acids Res. 43, 3591–3604 [DOI] [PMC free article] [PubMed] [Google Scholar]
- 42. Chu C. S., Lo P. W., Yeh Y. H., Hsu P. H., Peng S. H., Teng Y. C., Kang M. L., Wong C. H., and Juan L. J. (2014) O-GlcNAcylation regulates EZH2 protein stability and function. Proc. Natl. Acad. Sci. U.S.A. 111, 1355–1360 [DOI] [PMC free article] [PubMed] [Google Scholar]
- 43. Sahasrabuddhe A. A., Chen X., Chung F., Velusamy T., Lim M. S., and Elenitoba-Johnson K. S. (2015) Oncogenic Y641 mutations in EZH2 prevent Jak2/beta-TrCP-mediated degradation. Oncogene 34, 445–454 [DOI] [PubMed] [Google Scholar]
- 44. Harms P. W., Hristov A., Kim D. S., Quist T. A., Quist M. J., Siddiqui J., Carskadon S., Mehra R., Fullen D. R., Johnson T. M., Chinnaiyan A. M., and Palanisamy N. (2014) Activating mutations of the oncogene EZH2 in cutaneous melanoma revealed by next generation sequencing. Hum. Pathol. Case Rep. 1, 21–28 [Google Scholar]
- 45. Yap D. B., Chu J., Berg T., Schapira M., Cheng S. W., Moradian A., Morin R. D., Mungall A. J., Meissner B., Boyle M., Marquez V. E., Marra M. A., Gascoyne R. D., Humphries R. K., Arrowsmith C. H., et al. (2011) Somatic mutations at EZH2 Y641 act dominantly through a mechanism of selectively altered PRC2 catalytic activity, to increase H3K27 trimethylation. Blood 117, 2451–2459 [DOI] [PMC free article] [PubMed] [Google Scholar]
- 46. Wigle T. J., Knutson S. K., Jin L., Kuntz K. W., Pollock R. M., Richon V. M., Copeland R. A., and Scott M. P. (2011) The Y641C mutation of EZH2 alters substrate specificity for histone H3 lysine 27 methylation states. FEBS Lett. 585, 3011–3014 [DOI] [PubMed] [Google Scholar]
- 47. Kim E., Kim M., Woo D. H., Shin Y., Shin J., Chang N., Oh Y. T., Kim H., Rheey J., Nakano I., Lee C., Joo K. M., Rich J. N., Nam D. H., and Lee J. (2013) Phosphorylation of EZH2 activates STAT3 signaling via STAT3 methylation and promotes tumorigenicity of glioblastoma stem-like cells. Cancer Cell 23, 839–852 [DOI] [PMC free article] [PubMed] [Google Scholar]
- 48. Chen B., Liu J., Chang Q., Beezhold K., Lu Y., and Chen F. (2013) JNK and STAT3 signaling pathways converge on Akt-mediated phosphorylation of EZH2 in bronchial epithelial cells induced by arsenic. Cell Cycle 12, 112–121 [DOI] [PMC free article] [PubMed] [Google Scholar]
- 49. Xu B., Konze K. D., Jin J., and Wang G. G. (2015) Targeting EZH2 and PRC2 dependence as novel anticancer therapy. Exp. Hematol. 43, 698–712 [DOI] [PMC free article] [PubMed] [Google Scholar]
- 50. Su I. H., Dobenecker M. W., Dickinson E., Oser M., Basavaraj A., Marqueron R., Viale A., Reinberg D., Wülfing C., and Tarakhovsky A. (2005) Polycomb group protein ezh2 controls actin polymerization and cell signaling. Cell 121, 425–436 [DOI] [PubMed] [Google Scholar]
- 51. Barzaghi F., Passerini L., and Bacchetta R. (2012) Immune dysregulation, polyendocrinopathy, enteropathy, X-linked syndrome: a paradigm of immunodeficiency with autoimmunity. Front. Immunol. 3, 211. [DOI] [PMC free article] [PubMed] [Google Scholar]
- 52. Rahman M. K., Midtling E. H., Svingen P. A., Xiong Y., Bell M. P., Tung J., Smyrk T., Egan L. J., and Faubion W. A. Jr. (2010) The pathogen recognition receptor NOD2 regulates human FOXP3+ T cell survival. J. Immunol. 184, 7247–7256 [DOI] [PMC free article] [PubMed] [Google Scholar]
- 53. Faubion W. A., De Jong Y. P., Molina A. A., Ji H., Clarke K., Wang B., Mizoguchi E., Simpson S. J., Bhan A. K., and Terhorst C. (2004) Colitis is associated with thymic destruction attenuating CD4+25+ regulatory T cells in the periphery. Gastroenterology 126, 1759–1770 [DOI] [PubMed] [Google Scholar]
- 54. Duijvestein M., Wildenberg M. E., Welling M. M., Hennink S., Molendijk I., van Zuylen V. L., Bosse T., Vos A. C., de Jonge-Muller E. S., Roelofs H., van der Weerd L., Verspaget H. W., Fibbe W. E., te Velde A. A., van den Brink G. R., and Hommes D. W. (2011) Pretreatment with interferon-γ enhances the therapeutic activity of mesenchymal stromal cells in animal models of colitis. Stem Cells 29, 1549–1558 [DOI] [PubMed] [Google Scholar]
- 55. Langmead B., Trapnell C., Pop M., and Salzberg S. L. (2009) Ultrafast and memory-efficient alignment of short DNA sequences to the human genome. Genome Biol. 10, R25. [DOI] [PMC free article] [PubMed] [Google Scholar]
- 56. Trapnell C., Pachter L., and Salzberg S. L. (2009) TopHat: discovering splice junctions with RNA-Seq. Bioinformatics 25, 1105–1111 [DOI] [PMC free article] [PubMed] [Google Scholar]
- 57. Anders S., Pyl P. T., and Huber W. (2015) HTSeq: a Python framework to work with high-throughput sequencing data. Bioinformatics 31, 166–169 [DOI] [PMC free article] [PubMed] [Google Scholar]
- 58. Robinson M. D., McCarthy D. J., and Smyth G. K. (2010) edgeR: a Bioconductor package for differential expression analysis of digital gene expression data. Bioinformatics 26, 139–140 [DOI] [PMC free article] [PubMed] [Google Scholar]
- 59. Mortazavi A., Williams B. A., McCue K., Schaeffer L., and Wold B. (2008) Mapping and quantifying mammalian transcriptomes by RNA-Seq. Nat. Methods 5, 621–628 [DOI] [PubMed] [Google Scholar]
- 60. Subramanian A., Tamayo P., Mootha V. K., Mukherjee S., Ebert B. L., Gillette M. A., Paulovich A., Pomeroy S. L., Golub T. R., Lander E. S., and Mesirov J. P. (2005) Gene set enrichment analysis: a knowledge-based approach for interpreting genome-wide expression profiles. Proc. Natl. Acad. Sci. U.S.A. 102, 15545–15550 [DOI] [PMC free article] [PubMed] [Google Scholar]
Associated Data
This section collects any data citations, data availability statements, or supplementary materials included in this article.


