Abstract
PET is an established modality for myocardial perfusion imaging (MPI) which enables quantification of absolute myocardial blood flow (MBF) using dynamic imaging and kinetic modeling. However, heart motion and Partial Volume Effects (PVE) significantly limit the spatial resolution and quantitative accuracy of PET MPI. Simultaneous PET-MR offers a solution to the motion problem in PET by enabling MR-based motion correction of PET data. The aim of this study was to develop a motion and PVE correction methodology for PET MPI using simultaneous PET-MR, and to assess its impact on both static and dynamic PET MPI using 18F-Flurpiridaz, a novel 18F-labeled perfusion tracer. Two dynamic 18F-Flurpiridaz MPI scans were performed on healthy pigs using a PET-MR scanner. Cardiac motion was tracked using a dedicated tagged-MRI (tMR) sequence. Motion fields were estimated using non-rigid registration of tMR images and used to calculate motion-dependent attenuation maps. Motion correction of PET data was achieved by incorporating tMR-based motion fields and motion-dependent attenuation coefficients into image reconstruction. Dynamic and static PET datasets were created for each scan. Each dataset was reconstructed as (i) Ungated, (ii) Gated (end-diastolic phase), and (iii) Motion-Corrected (MoCo), each without and with point spread function (PSF) modeling for PVE correction. Myocardium-to-blood concentration ratios (MBR) and apparent wall thickness were calculated to assess image quality for static MPI. For dynamic MPI, segment- and voxel-wise myocardial blood flow (MBF) values were estimated by non-linear fitting of a 2-tissue compartment model to tissue time-activity-curves.
MoCo and Gating respectively decreased mean apparent wall thickness by 15.1% and 14.4% and increased MBR by 20.3% and 13.6% compared to Ungated images (P<0.01). Combined motion and PSF correction (MoCo-PSF) yielded 30.9% (15.7%) lower wall thickness and 82.2% (20.5%) higher MBR compared to Ungated data reconstructed without (with) PSF modeling (P<0.01). For dynamic PET, mean MBF across all segments were comparable for MoCo (0.72±0.21 mL/min/mL) and Gating (0.69±0.18 mL/min/mL). Ungated data yielded significantly lower mean MBF (0.59±0.16 mL/min/mL). Mean MBF for MoCo-PSF was 0.80±0.22 mL/min/mL, which was 37.9% (25.0%) higher than that obtained from Ungated data without (with) PSF correction (P<0.01).
The developed methodology holds promise to improve the image quality and sensitivity of PET MPI studies performed using PET-MR.
I. INTRODUCTION
Myocardial perfusion imaging (MPI) is a robust approach to diagnosing obstructive coronary artery disease and quantifying the extent and severity of myocardial ischemia. Over the last several years, PET has been increasingly used for MPI due to its superior image quality compared to that of SPECT as well as its ability to quantify myocardial blood flow (MBF) and myocardial flow reserve (stress/rest MBF) using dynamic imaging and tracer kinetic modeling (Klein and Beanlands, 2010). PET measures of MBF and MFR have been shown to be very sensitive for assessing micro-vascular function and dysfunction in-vivo (Schindler et al., 2010; Gewirtz et al., 1997; Parkash et al., 2004; Dayanikli et al., 1994).
The most commonly used PET perfusion agents are 82Rb and 13NH3. However, the high positron range of 82Rb (~7.5 mm) and short half-life (76 sec) result in images with relatively low spatial resolution and high noise (Klein and Beanlands, 2010). 13NH3, which has a shorter positron range and longer half-life, yields images with higher quality than 82Rb but requires an on-site cyclotron, which limits its clinic use. Recently, a new 18F-labeled perfusion tracer, 18F-Flurpiridaz (Lantheus Medical Imaging, North Billerica, MA), was introduced and is currently being evaluated in phase-III clinical trial. The long half-life and short positron range of 18F translate into PET images with higher resolution and better noise properties (Berman et al., 2012). Furthermore, 18F-Flurpiridaz has a high extraction fraction (>90% (Huisman et al., 2008)), making it an attractive flow tracer (Nekolla et al., 2009). Phase-III clinical trial results showed better diagnostic performance than SPECT MPI (Berman et al., 2013). Heart motion and partial volume effects (PVE), however, are two major sources of image degradation in PET MPI which may significantly limit the high-quality imaging potential of 18F-Flurpiridaz (Slomka et al., 2015; Erlandsson et al., 2012). If these effects are not corrected for, the superiority of PET over SPECT for MPI may not be fully realized.
While the intrinsic resolution of modern whole-body PET scanners is ~4–5 mm, in practice, due to unavoidable physiologic motion, this resolution cannot be achieved when imaging the heart. The fact that the heart moves in the centimeter range during breathing (Boucher et al., 2004) and cardiac beating (O'Dell et al., 1995) makes motion the most significant source of resolution deterioration in PET MPI, causing substantial errors in the activity measured in the myocardium (Dinges et al., 2013). Gating, which is frequently used to mitigate blurring in static PET MPI, is challenging to be applied to dynamic PET due to the noise increase associated with rejecting data in already low-count temporal frames. In fact, to the best of our knowledge, no studies have reported on the use of gating in dynamic PET MPI. Furthermore, besides blurring, motion may cause misregistrations between the PET emission data and the attenuation map, especially with sequential PET-CT. Emission/attenuation maps misalignments may cause confounding image artifacts as well as quantitation biases in the reconstructed PET activity distributions (Loghin et al., 2004; Gould et al., 2007; Pan and Zaidi, 2013). Finally, the PVE, which results from the scanner’s finite point spread function (PSF), further reduce image resolution, signal-to-noise-ratio (SNR) and quantitative accuracy. The myocardium, which is typically ~1 cm thick and whose thickness changes with cardiac contraction/expansion and varies with location is an organ particularly prone to PVE (Erlandsson et al., 2012).
Recently, hybrid PET-MRI scanners have become available commercially. The combination of high-resolution anatomical MR information and high-sensitivity PET molecular information offers promising opportunities for imaging the cardiovascular system (Ratib et al., 2013). For instance, PET-MR makes it possible to interrogate, in a single scanning session, myocardial viability using MRI of the late gadolinium enhancement and perfusion using PET MPI. Furthermore, unlike CT, MRI requires no ionizing radiation and produces images with high spatiotemporal resolution and excellent soft-tissue contrast, which makes it ideal for measuring organ motion. In particular, MR tagging has been shown to be accurate at measuring regional left ventricular motion and contractility (Garot et al., 2000). MR-derived motion fields can in turn be used to calculate motion-dependent attenuation maps and modeled inside PET reconstruction to compensate motion without penalizing SNR (Petibon et al., 2014; Ouyang et al., 2014; Fürst et al., 2015; Huang et al., 2015). To correct for PVE and further improve image spatial resolution and SNR, the PSF can be modeled during image reconstruction as well (Panin et al., 2006). The goal of this study was to develop and evaluate the impact of a motion and PSF correction methodology on both static and dynamic 18F-Flurpiridaz MPI using simultaneous PET-MR.
II. MATERIALS AND METHODS
1. Animal preparation
Two healthy domestic pigs (weight = 28 – 30 kgs) anesthetized with telazol were scanned on the Siemens Biograph mMR, a whole-body simultaneous PET-MR scanner. A catheter was placed in the ear vein of each animal for radiotracer injection. During the scan, anesthesia was maintained by means of a continuous infusion of isoflurane through an intubation tube. Animals were positioned feet-first supine on the scanner’s bed with a flexible surface coil placed on the chest. These procedures were approved by Institutional Animal Care and Use Committee at Massachusetts General Hospital.
2. Data acquisition
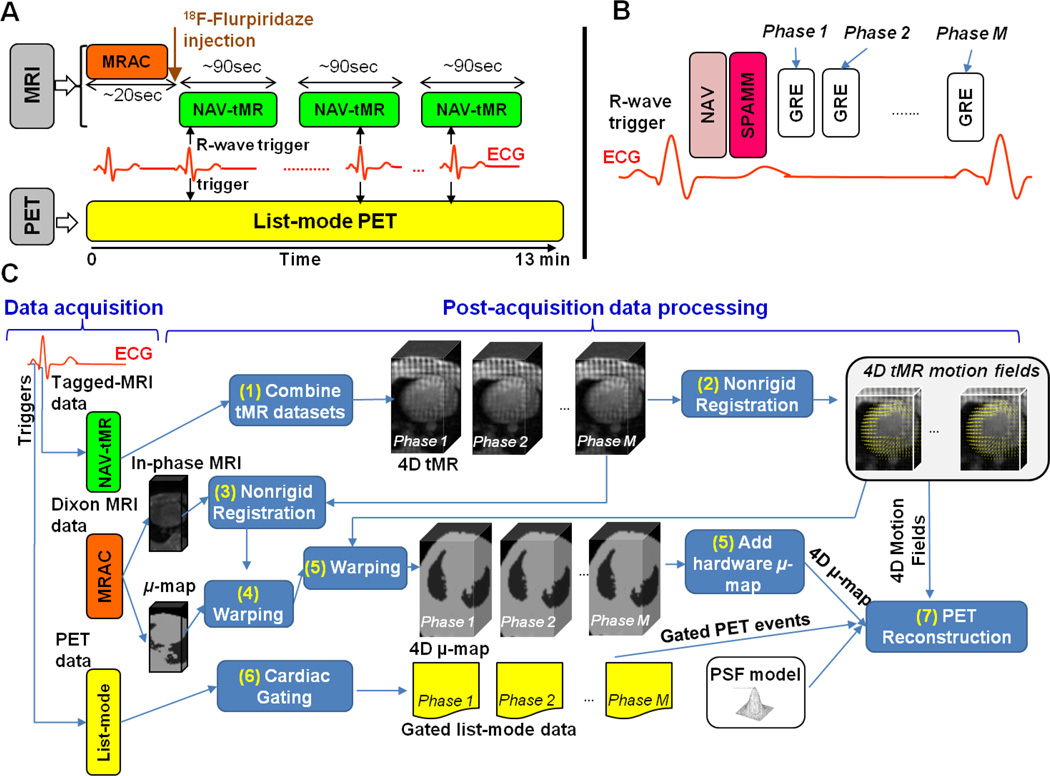
Figure 1 A depicts the timeline of the PET-MR data acquisition. First, an attenuation map was acquired using the vendor’s supplied Magnetic Resonance based Attenuation Correction (MRAC) protocol. MRAC uses a 2-point Dixon sequence (Coombs et al., 1997) to obtain water and fat volumes, which are in turn processed to obtain a segmented 4-tissue classes (air, lungs, fat and other tissues) PET attenuation map (Martinez-Moller et al., 2008). A 13-min PET list-mode acquisition started simultaneously with MRAC. A bolus injection of ~7–8.0 mCi of 18F-Fluripiridaz was made shortly after starting list-mode acquisition. The total number of prompts and delayed coincidences acquired in each dynamic MPI PET scan were respectively 1.95 × 10⁹ and 1.36 × 10⁹ for animal 1, and 1.34 × 10⁹ and 0.92 × 10⁹ for animal 2. To measure cardiac beating motion, multiple tagged MR (tMR) acquisitions were initiated shortly after radiotracer injection using a dedicated pulse sequence, referred to as NAV-tMR. The NAV-tMR sequence works as follows (Figure 1 B): when an R-wave is detected by ECG, a pencil-beam navigator (‘NAV’) is acquired and the diaphragm position is calculated. Next, the tagging module, 1-1 SPAtial Modulation of Magnetization (SPAMM (Axel and Dougherty, 1989)), is applied. SPAMM uses a special sequence of non-selective RF excitation pulses and gradients to spatially modulate the magnetization of all spins inside the MR FOV in a sinusoidal pattern, causing a series of parallel stripes in the image which deform as a result of the contraction and expansion of the myocardium. SPAMM is followed by the acquisition of Gradient Recalled Echo (GRE) data in 10 cardiac phases covering the duration of each R-R interval. The following acquisition parameters were used: TE=1.97 ms, TR=56 ms, flip angle=6°, in-plane resolution=2.3 × 2.3 mm2, slice thickness=8 mm, and tag line distance=8 mm. Due to swine’s specific upper thorax anatomy, respiration causes little heart motion and therefore, only cardiac beating motion tracking and correction were performed in this study. However, even though we neglected the effects of respiratory motion in subsequent PET data analysis, respiratory gating is important during tMR data acquisition due to the fact that even small respiration-induced heart displacements or respiratory motion of other organs (e.g. liver or belly) within the MR imaging plane may cause ghosting artifacts which will affect the entire image and ultimately corrupt the tMR data. In this work, respiratory gating for tMR was performed by only keeping the data acquired at end-exhalation based on the diaphragm position calculated by the navigator. The acquisition time for one NAV-tMR scan was ~90 seconds. Three NAV-tMR scans with orthogonal tagging directions were performed sequentially to measure 3D motion.
Figure 1.
A: Acquisition protocol for PET MPI studies using simultaneous PET-MR. B: Diagram of the NAV-tMR sequence for cardiac motion measurement. C: PET and MRI post-acquisition data processing steps.
3. Data post-processing
The flowchart depicted in Figure 1 C summarizes the main post-acquisition data processing steps for PET and MR data. First, for each cardiac phase, the tMR volumes for all the tagging directions were resampled on the same spatial grid and summed. A non-rigid B-spline image registration (Chun and Fessler, 2009) algorithm was applied to the summed tMR volumes to estimate cardiac motion fields, which are the 3D motion vector volumes, between all the cardiac phases and a chosen reference phase. End-diastole was selected as the reference phase because it is the longest phase in which the myocardium remains static.
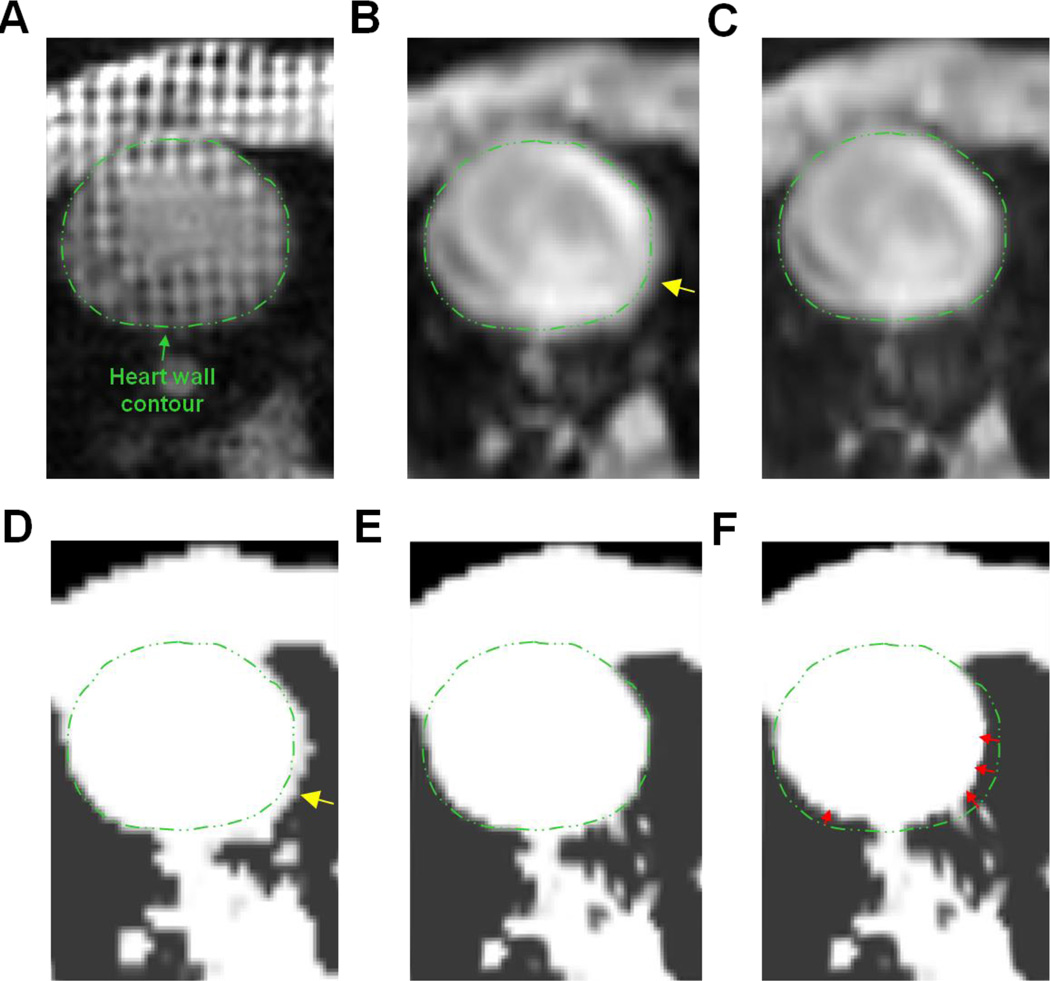
The resulting 4D cardiac motion model was then used for two purposes. First, we used it to compute motion-dependent attenuation maps to compensate for motion-induced emission/attenuation misregistrations during PET reconstruction. Because the MRAC pulse sequence does not permit cardiac-gated acquisitions and consequently, the acquired attenuation map corresponds to an average cardiac position, we first non-rigidly registered the in-phase Dixon MRI volume to the tMR volume in the reference phase and then applied the resulting transformation to the MRAC attenuation map to transform it to end-diastole. The motion fields were then used to deform the resulting attenuation map to all the other cardiac phases. Image registration between the in-phase Dixon volume and the tMR volume was performed using a B-spline registration algorithm which optimizes a cost-function comprised of a mutual-information based data consistency term and a topology preserving regularization term (Chun et al., 2012). The regularization parameter which controls the strength of the regularization function in the cost function optimized during image registration was chosen empirically. Figure 2 illustrates the performance of the proposed 4D mu-map calculation technique. As expected, the original motion-averaged in-phase Dixon MRI volume is not well registered to the reference tMR volume at end-diastole due to motion blurring (see Figure 2 B). As illustrated on Figure 2 C, the non-rigid registration procedure greatly improves the spatial alignment between both image volumes. The end-diastolic attenuation map, calculated by warping the original attenuation map with the obtained transformation, likewise depicts heart wall contour that match well with that of the reference tMR volume (see Figure 2 E). Warping of the obtained end-diastolic attenuation map with the tMR-based motion fields allows producing one attenuation map for each cardiac phase, for instance end-systole, as illustrated on Figure 2 F. This procedure ensures that the emission and attenuation distributions will be consistent at all times during motion compensated PET reconstruction. The final 4D attenuation map fed to the reconstruction program was obtained by incorporating the static attenuation components (e.g. scanner table, MR body coil) to the motion-dependent attenuation map. The motion fields were also modeled inside the PET reconstruction process to correct the PET emission distribution for motion, as detailed in the next section. First, each motion field was transformed to a tri-linear interpolation based image warping operator M1→m ∈ ℝJ×J (where ‘1’ denotes the reference end-diastolic phase, m ∈ [1 … M] an arbitrary cardiac phase and J is the total number of image voxels) for incorporation inside the forward PET model. The inverse motion transformation (i.e. based on the inverse motion fields) was used as an approximation for the transpose motion warping operator (Li et al., 2006; Feng et al., 2015; Furst et al., 2015). The inverse motion fields were calculated using 3D interpolation of the estimated B-spline registration based motion fields. As recently demonstrated by Feng and colleagues (Feng et al., 2015), more accurate results can be obtained when the warping operator is activity-preserving. In this study, activity preservation was achieved using the tri-linear interpolation operator with an additional multiplication by the Jacobian determinant of the estimated transformations (Dawood et al., 2013). The last 3-min of list-mode data were used to for image quality evaluation of static MPI. For dynamic MPI, the first 10-min list-mode data after injection were grouped temporally into a series of 29 frames (12×5s, 8×15s, 4×30s and 5×60s) for dynamic image reconstruction followed by kinetic modeling for MBF quantification.
Figure 2.
Calculation of the motion-dependent attenuation map in animal 1. Same transverse slice taken in A: the reference tMR volume (end-diastole), B: the original (i.e. “motion averaged”) in-phase Dixon MR volume, C: the in-phase Dixon MR volume registered to A, D: original (“motion averaged”) attenuation map, E: the attenuation map at end-diastole (obtained by warping D with the spatial transformation obtained in C, and F: the attenuation map at end-systole (obtained by warping E with the tMR-based cardiac motion fields). The dotted green line in each panel depicts the heart wall contour delineated in the reference end-diastole tMR volume. Motion blurring is visible in the original in-phase Dixon MRI volume (yellow arrow in B) which propagates to the attenuation map (yellow arrow in D). In contrast, the end-diastolic attenuation map (E) obtained using the proposed data processing method is well aligned to the reference tMR volume. Red arrows in F illustrate the amplitude of motion between end-diastole and end-systole.
4. Image reconstruction
The PET coincidence events in the static and dynamic MPI datasets were binned into 10 cardiac phases using the fractional time delay relative to corresponding ECG R-wave triggers. Then, the events in each time frame and cardiac phase were re-binned into fully-3D sinograms (span=11, maximum-ring-difference=60). The forward model which links the expected PET prompt sinogram data in time frame ti and cardiac phase m ∈ [1‥M], noted , to the motion-corrected activity distribution ρ(ti) ∈ ℝJ to be estimated during reconstruction, is given by:
where and ∈ ℝI are sinograms containing respectively the expected number of prompt, scattered, and random coincidences, M1→m ∈ ℝJ×J is the tMR-based motion warping operator that deforms the PET activity distribution in the reference phase to phase m, G ∈ ℝi×J is the forward-projection operator (implemented here using Siddon’s algorithm (Siddon, 1985)), B ∈ ℝI×I is a matrix that models the 2D PSF blurring effects in the sinogram space measured using multiple 18F point sources as detailed in (Petibon et al., 2014), S ∈ ℝI×I is a diagonal matrix containing the line-of-response sensitivity coefficients, Am ∈ ℝI×I is a diagonal matrix containing the attenuation coefficients in each sinogram bin and motion phase m obtained by forward-projection of the motion-dependent attenuation map, and ΔDm(ti) is a scalar equal to the relative duration of phase m in dynamic frame ti. Scattered coincidences sinograms were estimated using the single scatter simulation method (Watson, 2000). Random coincidences sinograms were estimated by Gaussian smoothing of the sinograms of delayed coincidences. To accelerate reconstruction while keeping low noise/bias in the estimates, the distributions of random and scattered coincidences were assumed to be independent of motion and were estimated using all the data detected in each time frame, regardless of motion phases.
Based on the above forward model, we used the ordered subset expectation maximization (OSEM) algorithm (Hudson and Larkin, 1994) to iteratively estimate the motion-corrected PET image for each frame:
where ym(ti) is the sinogram of prompt coincidences detected in frame ti and motion phase m and 1I is a column-vector with all ones.
The static and dynamic datasets were reconstructed as (i) Ungated, (ii) Gated, and (iii) Motion-Corrected (MoCo). Ungated images were obtained by reconstructing all PET coincidences in each frame, regardless of motion, using a standard OSEM algorithm with attenuation and LOR sensitivity corrections. Gated images were reconstructed by using only the events detected at end-diastole (~20% of events in each frame) using the same OSEM reconstruction. MoCo images were obtained by reconstructing all events in each frame using the algorithm described above. All methods were applied both with and without PSF modeling. Reconstructions were performed on a 2-mm isotropic voxel grid. Eight angular subsets were used for all OSEM reconstructions. For each reconstruction method, the number of iterations was chosen so that the average activity in the whole myocardium had converged in every frame. For ungated datasets, convergence of activity values in the myocardium was reached on average using 5 iterations in the early low count frames and 10 iterations in the later high count frames. Gated reconstructions required a smaller number of iterations for achieving convergence (3 for the early frames and 8 for the later frames, on average). PSF reconstructions, which are known to converge slower, required 4 more iterations on average to achieve convergence. A 3-mm FWHM 3D Gaussian filter was applied to each image post-reconstruction. Images were reoriented into the short-axis view.
5. MBF quantification
Kinetic modeling of dynamic PET was performed to estimate segment- and voxel-wise MBF maps. For segment-wise analyses, the myocardium was divided into 17 segments based on the American Heart Association model (Cerqueira et al., 2002). The kinetics of 18F-Flurpiridaz in the myocardium were modeled by a previously validated two-tissue compartment model (Nekolla et al., 2009), whose compartments are the free cellular space and the metabolic space, with tracer concentrations, CF(t), and CM(t), respectively, and kinetic rate constants K1, k2, k3 and k4. Since only the first 10 minutes of dynamic PET data were used for MBF estimation and because 18F-Flurpiridaz binds to MC-1 and shows very high retention, k4= 0 was assumed for the duration of the study. We also fixed k3 at a nominal value (k3 = 0.06 min −1) to improve stability of the estimated kinetic parameters, as proposed by Alpert et al (Alpert et al., 2012). Whole-blood TACs were obtained using cylindrical volumes-of-interest (VOI) (~1×1×2cm3) centered in the basal portions of the left ventricle (LV) and right ventricle (RV) blood-pools in the Ungated images. The LV (RV) VOI was located approximately ~2cm (~1cm) away from the endocardium surface. The image-derived plasma input function CP(t) was obtained by transforming the whole-blood LV TAC to plasma TAC using a plasma to whole-blood tracer concentration coefficient calculated from arterial blood measurements performed in 12 pigs (Guehl et al., 2015). No correction for metabolites was performed. Myocardial PET TACs were then fitted to the following model:
where CLV(ti) (CRV(ti)) is the LV (right ventricle (RV)) whole-blood TAC and is the fractional spillover from LV (RV) in segment/voxel j. The fractional spillover terms account for the contamination of myocardial TACs by activity from the left and right ventricles due to the limited PET spatial resolution. The fractional spillover terms were estimated during the curve fitting step together with the kinetic model parameters K1 and k2. The Levenberg-Marquardt algorithm was used for curve-fitting. MBF was then calculated as (Nekolla et al., 2009). Since the first-pass extraction fraction of 18F-flurpiridaz is very high and almost unchanged at high flow rates, no correction for a flow-dependent extraction fraction was used (Nekolla et al., 2009).
6. Image quality assessment
Image quality of static MPI was assessed by calculating myocardium-to-blood concentration ratio (MBR) for each segment using MBRj = 〈M〉j/〈B〉, where 〈M〉j is the average activity in segment j and 〈B〉 is the average activity in the LV blood-pool in each image volume. 〈B〉 was computed using the cylindrical LV VOI previously defined for calculation of MBF (see section II.5). We also estimated the wall thickness using profiles oriented along the inferior-superior direction in six different short-axis slices taken in basal, mid and apical regions. The wall thickness was defined as the FWHM of each profile (Slomka et al., 2015; Le Meunier et al., 2011).
III. RESULTS
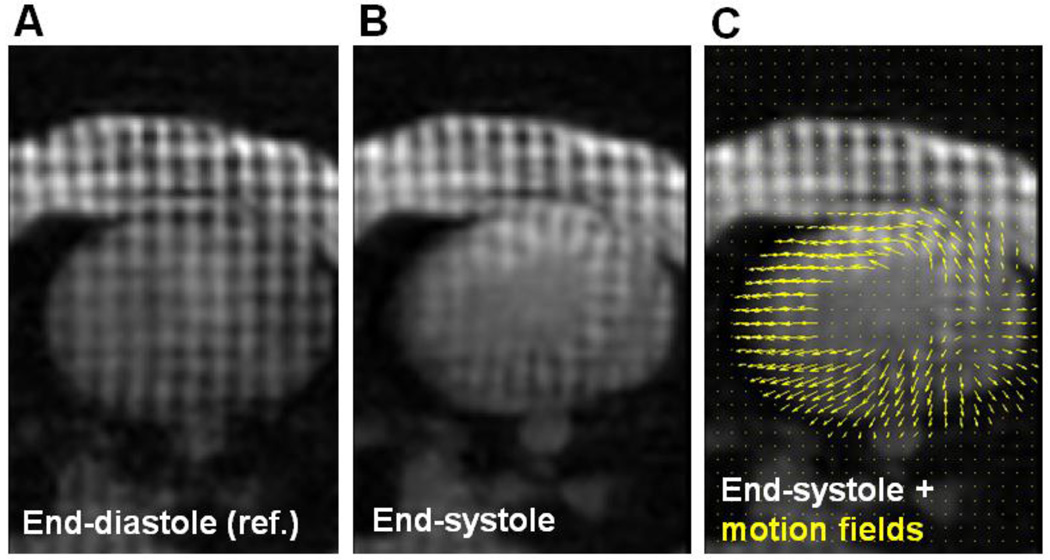
Figure 3 shows the same tMR axial slice taken in the end-diastolic and end-systolic phases along with the estimated motion fields between the two phases. The estimated range of myocardial wall displacements (mean ± standard deviation) between the end-diastolic and end-systolic phases was 4.69 ± 1.45 mm (max = 8.57 mm) in animal 1 and 4.21 ± 2.05 mm (max = 10.46 mm) in animal 2.
Figure 3.
Same transverse tagged MRI slice from animal 1 taken at A: end-diastole and B–C: end-systole. The yellow arrows in C depict the motion fields estimated between the end-diastolic and end-systolic phases.
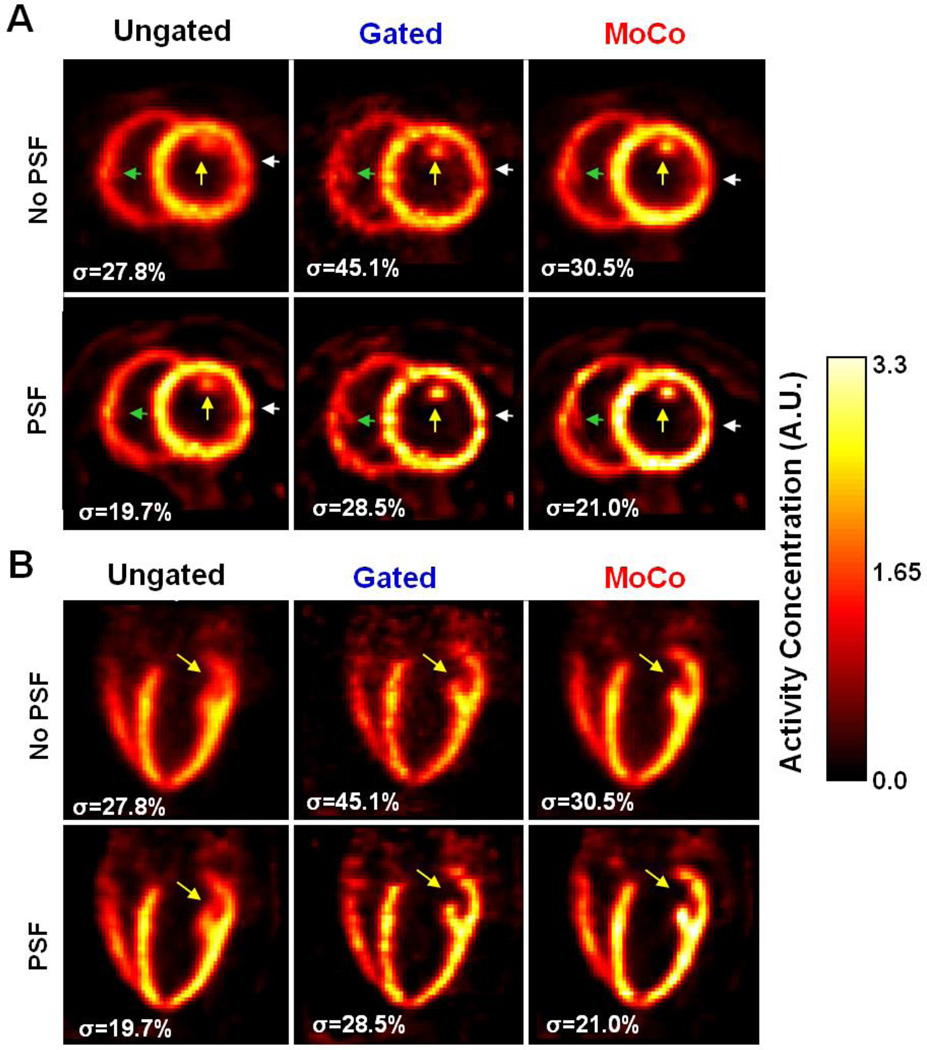
Figure 4 depicts static 18F-Flurpiridaz images obtained using all methods in animal #1. The σ values were calculated as the ratio in % between the standard deviation and the mean of the activity values inside a large volume of interest chosen in the animal’s liver (not visible in the chosen slices) to quantify the level of noise in each PET volume. Yellow arrows point to a papillary muscle in the LV, which is barely visible in the Ungated images. In contrast, MoCo made it possible to resolve the papillary muscle, indicating a greater apparent resolution in the LV. Likewise, Gated images had visibly higher resolution than the Ungated images albeit with much higher noise. By reducing PVE, PSF modeling increased activity recovery in the myocardium for all methods, particularly in the thin basal anterolateral and inferolateral walls, which could not be resolved well without PSF modeling (white arrows in Figure 4). As expected, PSF modeling reduced image noise level (i.e. lower σ) compared to no PSF modeling.
Figure 4.
18F-Flurpiridaz PET MPI images from animal 1 in A: short- and B: long-axis orientation. Images were reconstructed as Ungated, Gated and MoCo, each without and with PSF modeling.
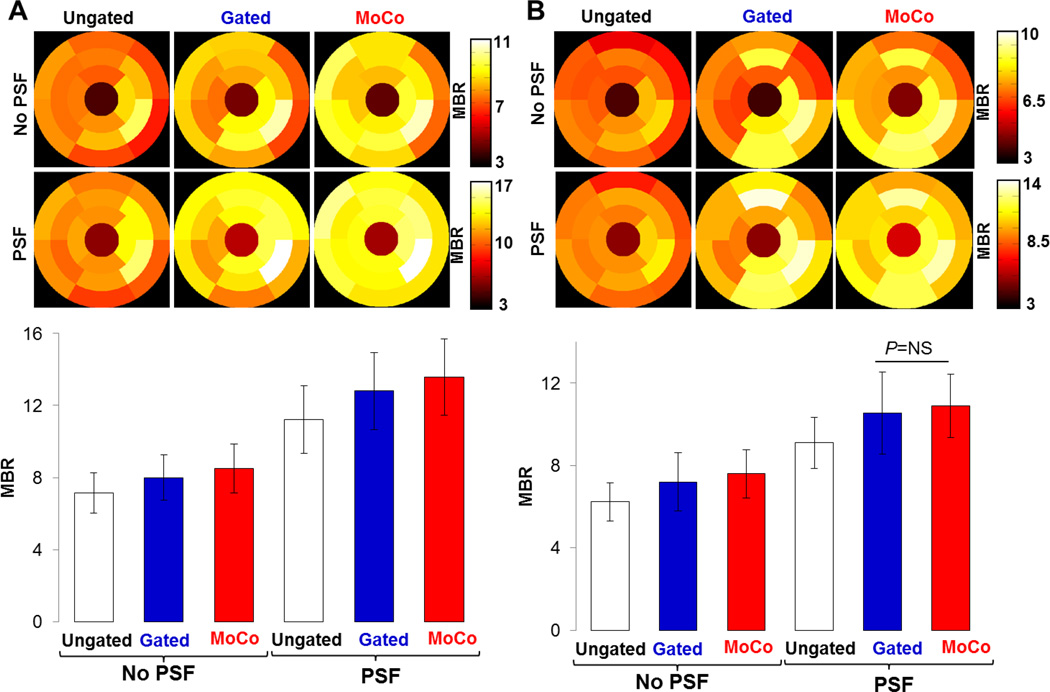
Figure 5 shows polar maps and bar plots of MBRs for both animals. MoCo and Gating respectively increased MBR by 20.3% and 13.6% (average over the two animals) compared to the Ungated images (all P<0.01). Likewise, PSF modeling substantially increased MBR when incorporated into the reconstruction, as a result of reduced activity spillover effects from the myocardium to the blood pools. MoCo-PSF yielded MBR respectively 82.2% and 20.5% higher (average over the two animals) to that obtained in the Ungated images reconstructed without and with PSF modeling (all P<0.01). MoCo-PSF also visibly improved uniformity of MBR across the myocardium compared to all other methods (see Figure 4 and Figure 5).
Figure 5.
Polar maps and bar plots of MBR calculated in 17 heart segments for A: animal 1 and B: animal 2.
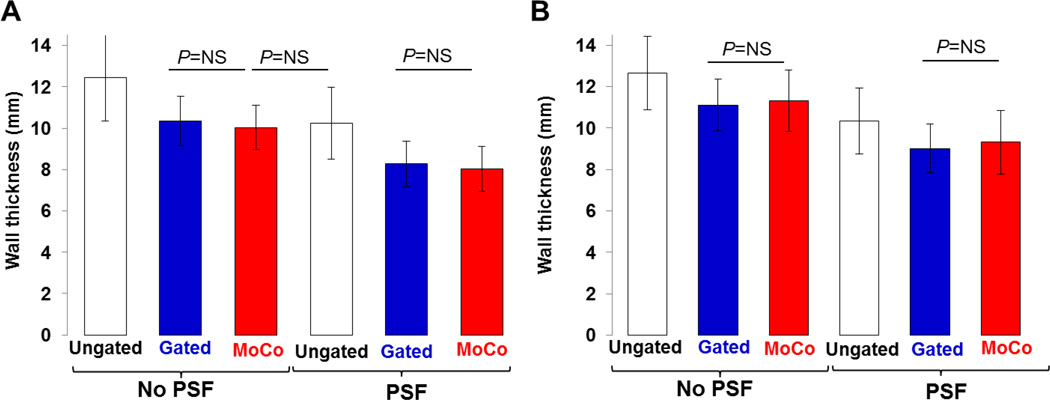
Figure 6 depicts wall thickness values measured for both animals. The mean apparent myocardial wall thickness for MoCo (10.6±1.1 mm) was similar to that measured in the Gated images (10.7±1.2 mm) (P=N.S), and was significantly lower than that obtained in the Ungated ones (12.5±1.5 mm) (all P<0.01). Mean wall thickness for MoCo-PSF (8.6±1.3 mm) was 30.9% (15.7%) lower than that measured in the Ungated data reconstructed without (with) PSF modeling (all P<0.01).
Figure 6.
Bar plots of wall thicknesses for A: animal 1 and B: animal 2.
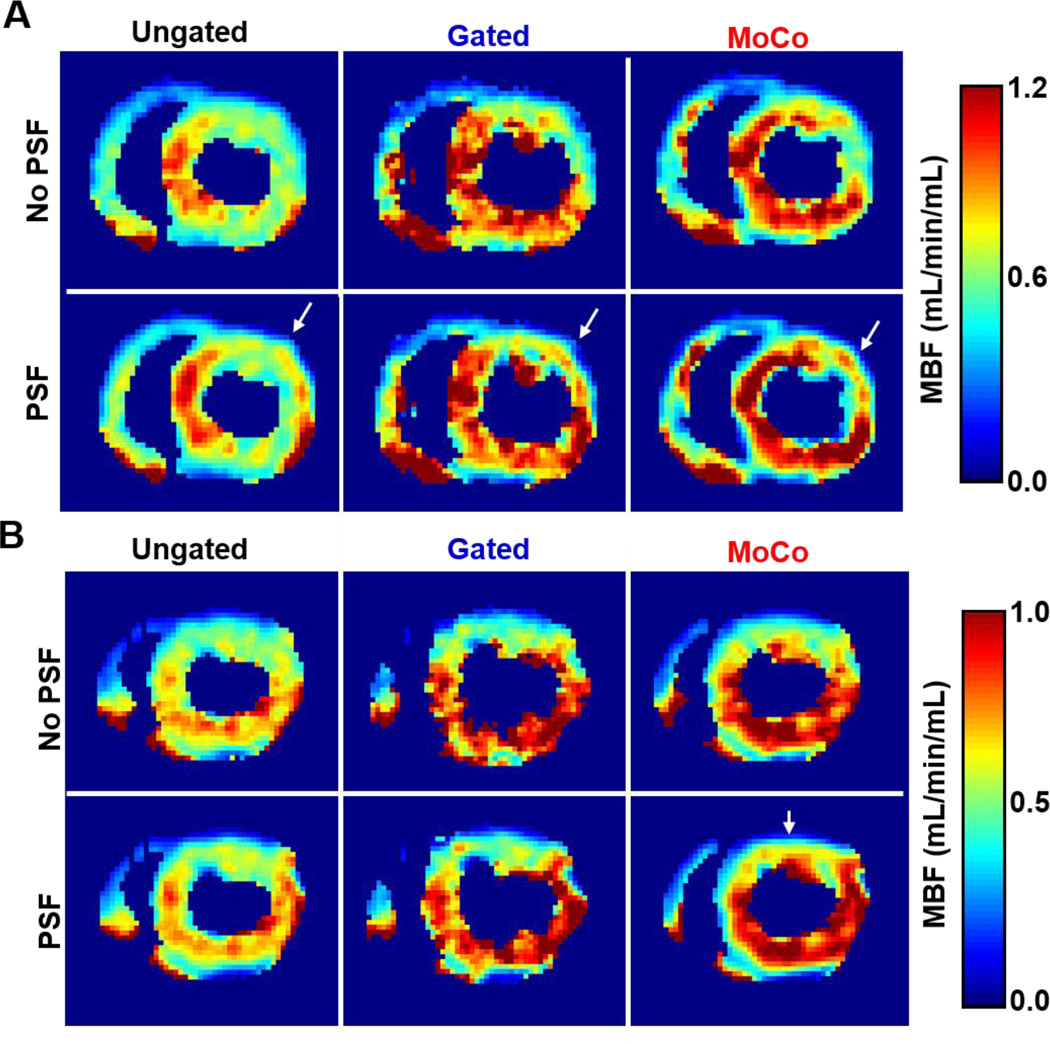
Figure 7 shows short-axis basal voxel-wise MBF maps obtained for both animals. MoCo yielded substantially higher MBF values than Ungated data, particularly in the septal, inferior and inferolateral walls. Likewise, Gated data yielded higher MBF in the same areas, albeit with increased voxel-wise MBF variability. PSF modeling further increased MBF estimates as compared to no PSF modeling, particularly for MoCo-PSF, while reducing voxel-wise MBF variability.
Figure 7.
Short-axis basal MBF maps obtained for A: animal 1 and B: animal 2.
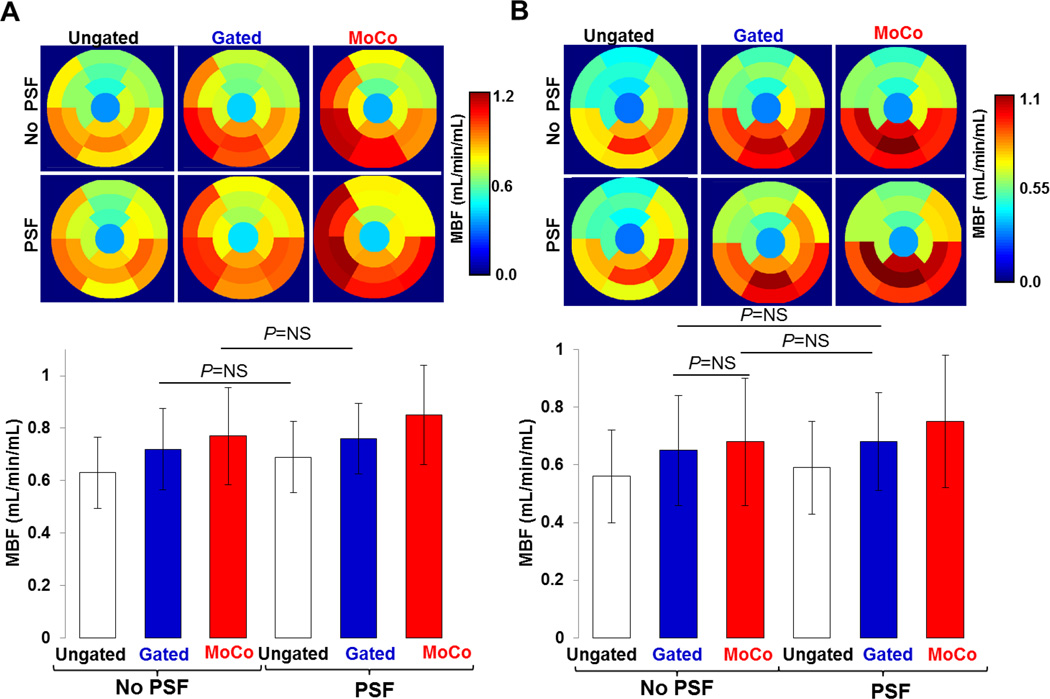
Figure 8 shows segment-wise MBFs estimated for both animals. MoCo and Gating had the most impact in the basal and mid portions of the inferior, septal and inferolateral walls, yielding noticeably higher MBF in these regions compared to Ungated data. The mean MBF across all segments and both animals was 0.72±0.21 mL/min/mL for MoCo, which was 22.0% higher than that obtained using Ungated (0.59±0.16 mL/min/mL) (P<0.01). Gated data yielded slightly lower mean MBF (0.69±0.18 mL/min/mL) than MoCo. Gated-PSF yielded similar MBF (0.72±0.16 mL/min/mL) to MoCo (P>0.1). Mean MBF obtained with MoCo-PSF was 0.80±0.22 mL/min/mL which was higher by 25% (35%) compared to Ungated reconstructions performed without (with) PSF modeling (all P<0.01). Table 1 summarizes mean MBF values for both animals measured in anterior, septal, inferior and lateral wall segments. MoCo and Gating had the most impact in the inferior and septal walls where the resulting MBFs were higher by 22% and 29% (MoCo) and 14% and 18% (Gating), respectively, than MBFs estimated using Ungated data (all P<0.01).
Figure 8.
Polar maps and bar plots of MBF calculated in 17 heart segments for A: animal 1 and B: animal 2.
Table 1.
MBF (mean±standard deviation in mL/min/mL) in the anterior, inferior, lateral and septal walls
| Ungated | Gated | MoCo | Ungated-PSF | Gated-PSF | MoCo-PSF | |
|---|---|---|---|---|---|---|
| Anterior | 0.51±0.09 | 0.58±0.09 | 0.61±0.13 | 0.56±0.11 | 0.65±0.11 | 0.70±0.16 |
| Inferior | 0.75±0.07 | 0.86±0.07 | 0.92±0.09 | 0.77±0.08 | 0.85±0.07 | 0.99±0.11 |
| Lateral | 0.63±0.09 | 0.70±0.11 | 0.71±0.11 | 0.72±0.09 | 0.76±0.09 | 0.81±0.13 |
| Septal | 0.61±0.14 | 0.72±0.17 | 0.79±0.20 | 0.65±0.13 | 0.74±0.15 | 0.89±0.23 |
IV. DISCUSSION
The goal of this study was to evaluate the impact of motion and PVE correction on 18F-Flurpiridaz PET MPI using simultaneous PET-MR. Previous studies have addressed motion correction in static cardiac PET-CT for perfusion (Slomka et al., 2015) and viability (Lamare et al., 2014; Le Meunier et al., 2011) applications, as well as rigid respiratory motion correction in dynamic cardiac PET-CT (Yu et al., 2016). To the best of our knowledge, this is the first study to investigate the impact of MR-based PET motion correction as applied to dynamic PET MPI for quantification of regional MBF using simultaneous PET-MR.
We used tagged-MRI to measure cardiac motion, which is widely accepted as the reference technique for wall motion measurement. We used the motion fields to calculate motion-dependent attenuation coefficients and incorporated this information into the PET reconstruction, along with PSF modeling, to correct images for motion and PVE simultaneously while preserving SNR. We found that motion correction improved apparent image resolution, reduced wall thickness, and increased MBR and MBF compared to conventional Ungated reconstructions. Combined motion and PSF correction further improved image quality.
We did not know the true activity concentration in the myocardium nor the true MBF values, which prevents us from comparing the bias obtained with each technique. However, the Gated data can be considered as the ‘motion-free’ reference, albeit with high noise. Overall, we found that even though the measured wall thickness, MBR and MBF were close for Gated and MoCo images, MoCo yielded slightly higher MBR and MBF than Gated. Such differences may be explained by the limitations of iterative algorithms such as OSEM, which are known to introduce biases - underestimation (overestimation) of activity in hot (cold) regions - in images reconstructed with very low-count datasets (Walker et al., 2011; Reilhac et al., 2008).
Although the RV papillary muscle is more discernible in the MoCo images than in the Ungated images (see green arrows in Figure 4 A), Gating however does outperform MoCo in this area of the heart, suggesting that the tMR motion fields estimated in the RV were not very accurate. This lower accuracy most likely owes to our tMR data acquisition protocol which was optimized for LV motion tracking and utilized an 8 mm SPAMM tag line spacing distance. Indeed, since the RV of these animals is very thin (<6 mm, which is thus thinner than the tag line spacing distance), the tMR-based motion fields estimated along the direction in which the RV is the thinnest may not be very accurate. This may explain why MoCo performs worse than Gating in the RV, while still showing improved spatial resolution relative to Ungated data. To capture more accurate RV motion using tMR, a smaller tag line distance (e.g. 2 or 4 mm) and a higher tMR data spatial resolution (e.g. 1×1mm2 in plane resolution) may be needed.
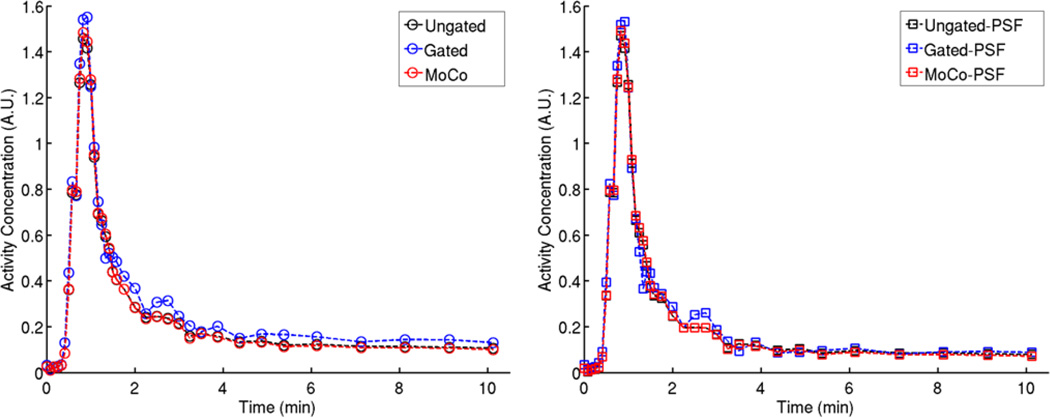
We used a VOI in the LV blood-pool to obtain the image-derived arterial input function. It might appear natural to derive the input function from the Ungated, Gated, and MoCo dynamic data separately for kinetic analysis of corresponding datasets. However, we chose to use a common input function derived from the Ungated images for kinetic modeling of all datasets. As illustrated in Figure 9, MoCo and Ungated yielded almost undistinguishable LV TACs. In comparison, Gated data seemed to overestimate the activity in the blood-pool, both in the early and late time frames, which may be explained by the aforementioned limitations of OSEM in very low-count scenarios.
Figure 9.
LV blood-pool TACs obtained in Animal 1 using all the reconstruction methods
As can be seen in Figure 7, overall lower MBF values were obtained in the anterolateral wall compared to the rest of the myocardium for both animals. Also, MoCo and Gating alone (i.e. without PSF modeling) had relatively little impact in that area of the myocardium. However, noticeably higher MBF values were obtained when using the PSF reconstructions (white arrows in Figure 7). This is particularly visible with the MoCo-PSF reconstruction in Animal 1 (Figure 7 A) which in fact seems to restore the shape of the anterolateral wall. This suggests that the lower MBF values estimated with the non PSF reconstructions are likely an artifact caused by strong PVE, due to the thinner anterolateral wall in the chosen slices.
While all methods depicted substantial inter-segment MBF variability, as illustrated by both the polar maps and standard deviation bars in Figure 8, motion correction yielded overall larger MBF spatial heterogeneity across the myocardium than that obtained with Ungated and Gated reconstructions. This might seem counter intuitive, at a first glance, however. Indeed, even though the underlying physiologic mechanism is not fully understood yet, it is well established and documented that resting MBF shows significant spatial heterogeneity in normal animals and humans, as assessed by both microspheres and PET (e.g. (King et al., 1985; Chareonthaitawee et al., 2001)). In their study, Chareonthaitawee and colleagues performed H215O dynamic PET measurements on 169 normal volunteers to characterize the heterogeneity of resting MBF in normal humans (Chareonthaitawee et al., 2001). They found that MBF varies considerably within subjects (average coefficient of variation = 24 %) and that different heart regions (e.g. inferior vs. anterior wall) exhibit significantly different MBF. Furthermore, as demonstrated by Bassingthwaighte and colleagues (Bassingthwaighte et al., 1989), the spatial heterogeneity of regional MBF exhibits fractal properties and in fact, the measured heterogeneity in MBF distribution increases with increasing spatial resolution of the measurements. Therefore, one may argue that the motion correction method, which provides higher spatial resolution and SNR compared to the other reconstruction methods, may perhaps reveal patterns of MBF heterogeneity across the heart that cannot be fully characterized using blurred Ungated or low-SNR Gated dynamic PET measurements. However, since we have not performed microsphere measurements in this work and therefore the true MBF values are unknown, this observation is merely a hypothesis.
We ignored respiratory motion in these studies because pig’s breathing pattern induces negligible heart motion. In a clinical patient study, however, both cardiac and respiratory motion correction would be needed. Because the respiratory motion of the heart is less complex than cardiac beating, tagging may not be required for respiratory motion measurement. Fast radial “stack-of-stars” MR sequences could be used for that purpose because they offer flexible retrospective binning of the MR data into motion phases (Grimm et al., 2015; Huang et al., 2013; Dutta et al., 2015). Respiratory motion phases can be tracked using external sensors (e.g. bellows) or MR navigators.
We used the attenuation map obtained by the MRAC protocol for all PET reconstructions. It is however well-known that segmentation-based methods such as MRAC introduce bias in the reconstructed PET images. We have previously shown that the resulting bias for a given patient scan can be unacceptably large in lung and bone regions because the density variations within these regions are high. However, we have found such method yields acceptable bias when imaging soft-tissue organs such as the myocardium (Ouyang et al., 2013).
During the experiments, a MR surface coil was used to receive signals. However, the attenuating effects of the coil were not accounted for during the PET reconstruction. Previous studies have shown that large bias near the surface coil panels can be found if such correction is not performed (Ouyang et al., 2014). Since the mid/apical anterior wall of the myocardium is adjacent to the sternum and the rib cage in these animals, the distance between the heart wall and the surface coil panels may be only a few cm (in our case, ~2.5 cm in animal 1 and ~3 cm in animal 2). As a consequence, one may expect the surface coil panels to impact the activity estimated at least in the anterior wall. However, since the same bias affects all reconstructed volumes, the comparison between reconstruction methods and the conclusions drawn in this work remain valid. In order to include the surface coil in the overall attenuation map, several MR markers such as wired or wireless micro coils (Huang et al., 2014b; Huang et al., 2014a), can be attached to the surface coil to track its location and shape during the acquisition.
V. CONCLUSION
We have developed a methodology for tackling both issues of cardiac motion and PVE for PET MPI using simultaneous PET-MR. We investigated its impact on both static and dynamic 18F-Flurpiridaz PET MPI. Compared to the conventional Ungated method, we have demonstrated improved image resolution and overall higher MBF values throughout the myocardium. This methodology holds promise to improve the image quality and sensitivity of PET MPI studies performed using PET-MR.
Acknowledgments
The authors would like to thank Julia-Ann Scotton and Victoria Douglas for their help during the animal experiments. This work was supported by NIH R01-HL118261.
REFERENCES
- Alpert N, Fang Y-HD, El Fakhri G. Single-scan rest/stress imaging 18F-labeled flow tracers. Medical physics. 2012;39:6609–6620. doi: 10.1118/1.4754585. [DOI] [PMC free article] [PubMed] [Google Scholar]
- Axel L, Dougherty L. MR imaging of motion with spatial modulation of magnetization. Radiology. 1989;171:841–845. doi: 10.1148/radiology.171.3.2717762. [DOI] [PubMed] [Google Scholar]
- Bassingthwaighte JB, King RB, Roger SA. Fractal nature of regional myocardial blood flow heterogeneity. Circulation Research. 1989;65:578–590. doi: 10.1161/01.res.65.3.578. [DOI] [PMC free article] [PubMed] [Google Scholar]
- Berman DS, Germano G, Slomka PJ. Improvement in PET myocardial perfusion image quality and quantification with flurpiridaz F 18. Journal of nuclear cardiology. 2012;19:38–45. doi: 10.1007/s12350-011-9487-4. [DOI] [PubMed] [Google Scholar]
- Berman DS, J M, Tamarappoo BK, Czernin J, Taillefer R, Udelson JE, Gibson CM, Devine M, Lazewatsky J, Bhat G, Washburn D. Phase II safety and clinical comparison with single-photon emission computed tomography myocardial perfusion imaging for detection of coronary artery disease: flurpiridaz F 18 positron emission tomography. J. Am Coll. Cardiol. 2013;61:469–477. doi: 10.1016/j.jacc.2012.11.022. [DOI] [PMC free article] [PubMed] [Google Scholar]
- Boucher L, Rodrigue S, Lecomte R, Benard F. Respiratory gating for 3-dimensional PET of the thorax: feasibility and initial results. J. Nucl. Med. 2004;45:214–219. [PubMed] [Google Scholar]
- Cerqueira MD, Weissman NJ, Dilsizian V, Jacobs AK, Kaul S, Laskey WK, Pennell DJ, Rumberger JA, Ryan T, Verani MS. Standardized myocardial segmentation and nomenclature for tomographic imaging of the heart: A statement for healthcare professionals from the Cardiac Imaging Committee of the Council on Clinical Cardiology of the American Heart Association. J Nucl Cardiol. 2002;9:240–245. doi: 10.1067/mnc.2002.123122. [DOI] [PubMed] [Google Scholar]
- Chareonthaitawee P, Kaufmann PA, Rimoldi O, Camici PG. Heterogeneity of resting and hyperemic myocardial blood flow in healthy humans. Cardiovascular research. 2001;50:151–161. doi: 10.1016/s0008-6363(01)00202-4. [DOI] [PubMed] [Google Scholar]
- Chun S, Fessler J. A simple regularizer for B-spline nonrigid image registration that encourages local invertibility. IEEE Sel. Topics In Signal Process. 2009;3:159–169. doi: 10.1109/JSTSP.2008.2011116. [DOI] [PMC free article] [PubMed] [Google Scholar]
- Chun SY, Reese TG, Ouyang J, Guerin B, Catana C, Zhu X, Alpert NM, El Fakhri G. MRI-based nonrigid motion correction in simultaneous PET/MRI. Journal of Nuclear Medicine. 2012;53:1284–1291. doi: 10.2967/jnumed.111.092353. [DOI] [PMC free article] [PubMed] [Google Scholar]
- Coombs BD, Szumowski J, Coshow W. Two-point Dixon technique for water-fat signal decomposition with B0 inhomogeneity correction. Magn Reson Med. 1997;38:884–889. doi: 10.1002/mrm.1910380606. [DOI] [PubMed] [Google Scholar]
- Dawood M, Gigengack F, Jiang X, Schäfers KP. A mass conservation-based optical flow method for cardiac motion correction in 3D-PET. Medical physics. 2013;40:012505. doi: 10.1118/1.4770276. [DOI] [PubMed] [Google Scholar]
- Dayanikli F, Grambow D, Muzik O, Mosca L, Rubenfire M, Schwaiger M. Early detection of abnormal coronary flow reserve in asymptomatic men at high risk for coronary artery disease using positron emission tomography. Circulation. 1994;90:808–817. doi: 10.1161/01.cir.90.2.808. [DOI] [PubMed] [Google Scholar]
- Dinges J, Nekolla SG, Bundschuh RA. Motion artifacts in oncological and cardiac PET imaging. PET clinics. 2013;8:1–9. doi: 10.1016/j.cpet.2012.10.001. [DOI] [PubMed] [Google Scholar]
- Dutta J, Huang C, Li Q, El Fakhri G. Pulmonary imaging using respiratory motion compensated simultaneous PET/MR. Medical physics. 2015;42:4227–4240. doi: 10.1118/1.4921616. [DOI] [PMC free article] [PubMed] [Google Scholar]
- Erlandsson K, Buvat I, Pretorius PH, Thomas BA, Hutton BF. A review of partial volume correction techniques for emission tomography and their applications in neurology, cardiology and oncology. Phys Med Biol. 2012;57:R119–R159. doi: 10.1088/0031-9155/57/21/R119. [DOI] [PubMed] [Google Scholar]
- Feng T, Wang J, Fung G, Tsui B. Non-rigid dual respiratory and cardiac motion correction methods after, during, and before image reconstruction for 4D cardiac PET. Physics in medicine and biology. 2015;61:151. doi: 10.1088/0031-9155/61/1/151. [DOI] [PubMed] [Google Scholar]
- Furst S, Grimm R, Hong I, Souvatzoglou M, Casey ME, Schwaiger M, Nekolla SG, Ziegler SI. Motion correction strategies for integrated PET/MR. Journal of Nuclear Medicine. 2015;56:261–269. doi: 10.2967/jnumed.114.146787. [DOI] [PubMed] [Google Scholar]
- Fürst S, Grimm R, Hong I, Souvatzoglou M, Casey ME, Schwaiger M, Nekolla SG, Ziegler SI. Motion correction strategies for integrated PET/MR. J. Nucl. Med. 2015;56:261–269. doi: 10.2967/jnumed.114.146787. [DOI] [PubMed] [Google Scholar]
- Garot J, Bluemke DA, Osman NF, Rochitte CE, McVeigh ER, Zerhouni EA, Prince JL, Lima JA. Fast determination of regional myocardial strain fields from tagged cardiac images using harmonic phase MRI. Circulation. 2000;101:981–988. doi: 10.1161/01.cir.101.9.981. [DOI] [PubMed] [Google Scholar]
- Gewirtz H, Skopicki H, Abraham S, Castano H, Dinsmore R, Alpert N, Fischman A. Quantitative PET measurements of regional myocardial blood flow: observations in humans with ischemic heart disease. Cardiology. 1997;88:62–70. doi: 10.1159/000177312. [DOI] [PubMed] [Google Scholar]
- Gould K, Pan T, Loghin C, Johnson NP, Guha A, Sdringola S, et al. Frequent diagnostic errors in cardiac PET/CT due to misregistration of CT attenuation and emission PET images: a definitive analysis of causes, consequences, and corrections. The Journal of Nuclear Medicine. 2007;48:1112–1121. doi: 10.2967/jnumed.107.039792. [DOI] [PubMed] [Google Scholar]
- Grimm R, Fürst S, Souvatzoglou M, Forman C, Hutter J, Dregely I, Ziegler SI, Kiefer B, Hornegger J, Block KT. Self-gated MRI motion modeling for respiratory motion compensation in integrated PET/MRI. Medical Image Analysis. 2015;19:110–120. doi: 10.1016/j.media.2014.08.003. [DOI] [PubMed] [Google Scholar]
- Guehl N, Normandin M, Wooten D, Rozen G, Sitek A, Mansour M, Shoup T, Ptaszek L, El Fakhri G, Alpert N. Single-scan rest/stress imaging with [18F] flurpiridaz: demonstration in a porcine model. Journal of Nuclear Medicine. 2015;56:516-. doi: 10.1007/s00259-017-3684-6. [DOI] [PubMed] [Google Scholar]
- Huang C, Ackerman JL, Petibon Y, Brady TJ, El Fakhri G, Ouyang J. MR-based motion correction for PET imaging using wired active MR microcoils in simultaneous PET-MR: Phantom studya) Medical physics. 2014a;41:041910. doi: 10.1118/1.4868457. [DOI] [PMC free article] [PubMed] [Google Scholar]
- Huang C, Ackerman JL, Petibon Y, Normandin MD, Brady TJ, El Fakhri G, Ouyang J. Motion compensation for brain PET imaging using wireless MR active markers in simultaneous PET–MR: Phantom and non-human primate studies. Neuroimage. 2014b;91:129–137. doi: 10.1016/j.neuroimage.2013.12.061. [DOI] [PMC free article] [PubMed] [Google Scholar]
- Huang C, Dutta J, Petibon Y, Reese TG, Li Q, Catana C, El Fakhri G. A novel golden-angle radial FLASH motion-estimation sequence for simultaneous thoracic PET/MR. 2013 [Google Scholar]
- Huang C, Petibon Y, Ouyang J, Reese TG, Ahlman MA, Bluemke DA, El Fakhir G. Accelerated acquisition of tagged MRI for cardiac motion correction in simultaneous PET-MR: Phantom and patient studies. Med Phys. 2015;42:1087–1096. doi: 10.1118/1.4906247. [DOI] [PMC free article] [PubMed] [Google Scholar]
- Hudson HM, Larkin RS. Accelerated image reconstruction using ordered subsets of projection data. IEEE Transactions on Medical Imaging. 1994;13:601–609. doi: 10.1109/42.363108. [DOI] [PubMed] [Google Scholar]
- Huisman MC, Higuchi T, Reder S, Nekolla SG, Poethko T, Wester H, Jr, Ziegler SI, Casebier DS, Robinson SP, Schwaiger M. Initial characterization of an 18F-labeled myocardial perfusion tracer. Journal of Nuclear Medicine. 2008;49:630–636. doi: 10.2967/jnumed.107.044727. [DOI] [PubMed] [Google Scholar]
- King R, Bassingthwaighte J, Hales J, Rowell L. Stability of heterogeneity of myocardial blood flow in normal awake baboons. Circulation Research. 1985;57:285–295. doi: 10.1161/01.res.57.2.285. [DOI] [PMC free article] [PubMed] [Google Scholar]
- Klein R, Beanlands RS. Quantification of myocardial blood flow and flow reserve: technical aspects. Journal of nuclear cardiology. 2010;17:555–570. doi: 10.1007/s12350-010-9256-9. [DOI] [PubMed] [Google Scholar]
- Lamare F, Le Maitre A, Dawood M, Schäfers K, Fernandez P, Rimoldi O, Visvikis D. Evaluation of respiratory and cardiac motion correction schemes in dual gated PET/CT cardiac imaging. Medical physics. 2014;41:072504. doi: 10.1118/1.4881099. [DOI] [PubMed] [Google Scholar]
- Le Meunier L, Slomka PJ, Dey D, Ramesh A, Thomson LE, Hayes SW, Friedman JD, Cheng V, Germano G, Berman DS. Motion frozen 18F-FDG cardiac PET. Journal of nuclear cardiology. 2011;18:259–266. doi: 10.1007/s12350-010-9322-3. [DOI] [PMC free article] [PubMed] [Google Scholar]
- Li T, Thorndyke B, Schreibmann E, Yang Y, Xing L. Model-based image reconstruction for four-dimensional PET. Medical physics. 2006;33:1288–1298. doi: 10.1118/1.2192581. [DOI] [PubMed] [Google Scholar]
- Loghin C, Sdringola S, Gould KL. Common artifacts in PET myocardial perfusion images due to attenuation-emission misregistration: clinical significance, causes, and solutions. J. Nucl. Med. 2004;45:1029–1039. [PubMed] [Google Scholar]
- Martinez-Moller A, Souvatzoglou M, Navab N, Schwaiger M, Nekolla S. MR-based attenuation correction for whole-body MR/PET; Society of Nuclear Medicine Annual Meeting Abstracts: Soc Nuclear Med); 2008. p. 65P. [Google Scholar]
- Nekolla S, Reder S, Saraste A, Higuchi T, Dzewas G, Preissel A, Huisman M, Peoethko T, Schuster T, Yu M, Robinson S, Casebier D, Henke J, Wester H, Schwaiger M. Evaluation of the Novel Myocardial Perfusion Positron-Emission Tomography Tracer 18F-BMS-747158-02. Circulation. 2009;119:2333–2342. doi: 10.1161/CIRCULATIONAHA.108.797761. [DOI] [PubMed] [Google Scholar]
- O'Dell WG, Moore CC, Hunter WC, Zerhouni EA, McVeigh ER. Three-dimensional myocardial deformations: calculation with displacement field fitting to tagged MR images. Radiology. 1995;195:829–835. doi: 10.1148/radiology.195.3.7754016. [DOI] [PMC free article] [PubMed] [Google Scholar]
- Ouyang J, Chun S, Petibon Y, Bonab A, Alpert N, El Fakhri G. Bias atlases for segmentation-based PET attenuation correction using PET-CT and MR. IEEE Trans Nucl Sci. 2013;60:3373–3382. doi: 10.1109/TNS.2013.2278624. [DOI] [PMC free article] [PubMed] [Google Scholar]
- Ouyang J, Petibon Y, Huang C, Reese T, Aleksandra K, El Fakhir G. Quantitative simultaneous positron emission tomography. J. Med. Imag. 2014;1:033502. doi: 10.1117/1.JMI.1.3.033502. [DOI] [PMC free article] [PubMed] [Google Scholar]
- Pan T, Zaidi H. Attenuation Correction Strategies for Positron Emission Tomography/Computed Tomography and 4-Dimensional Positron Emission Tomography/Computed Tomography. PET Clin. 2013;8:37–50. doi: 10.1016/j.cpet.2012.09.009. [DOI] [PubMed] [Google Scholar]
- Panin VY, Kehren F, Michel C, Casey M. Fully 3-D PET reconstruction with system matrix derived from point source measurements. IEEE transactions on medical imaging. 2006;25:907–921. doi: 10.1109/tmi.2006.876171. [DOI] [PubMed] [Google Scholar]
- Parkash R, Ruddy T, Kitsikis A, Hart R, Beauschene L, Williams K, Davies R, Labinaz M, Beanlands R. Potential utility of rubidium 82 PET quantification in patients with 3-vessel coronary artery disease. Journal of nuclear cardiology. 2004;11:440–449. doi: 10.1016/j.nuclcard.2004.04.005. [DOI] [PubMed] [Google Scholar]
- Petibon Y, Huang C, Ouyang J, Reese T, Li Q, Syrkina A, Chen Y, El Fakhir G. Relative role of motion and PSF compensation in whole-body oncologic PET-MR imaging. Med Phys. 2014;41:042503. doi: 10.1118/1.4868458. [DOI] [PMC free article] [PubMed] [Google Scholar]
- Ratib O, Nkoulou R, Schwaiger M. Cardiovascular clinical applications of PET/MRI. Clin Transl Imaging. 2013;1:65–71. [Google Scholar]
- Reilhac A, Tomeï S, Buvat I, Michel C, Keheren F, Costes N. Simulation-based evaluation of OSEM iterative reconstruction methods in dynamic brain PET studies. Neuroimage. 2008;39:359–368. doi: 10.1016/j.neuroimage.2007.07.038. [DOI] [PubMed] [Google Scholar]
- Schindler TH, Schelbert HR, Quercioli A, Dilsizian V. Cardiac PET imaging for the detection and monitoring of coronary artery disease and microvascular health. JACC: Cardiovascular Imaging. 2010;3:623–640. doi: 10.1016/j.jcmg.2010.04.007. [DOI] [PubMed] [Google Scholar]
- Siddon RL. Fast calculation of the exact radiological path for a three-dimensional CT array. Medical physics. 1985;12:252–255. doi: 10.1118/1.595715. [DOI] [PubMed] [Google Scholar]
- Slomka PJ, Rubeaux M, Le Meunier L, Dey D, Lazewatsky J, Pan T, Dweck M, Newby D, Germano G, Berman DS. Dual-Gated Motion-Frozen Cardiac PET with Flurpiridaz F 18. J. Nucl. Med. 2015;56:1876–1881. doi: 10.2967/jnumed.115.164285. [DOI] [PubMed] [Google Scholar]
- Walker MD, Asselin M, Julyan PJ, Feldmann M, Talbot P, Jones T, Matthews J. Bias in iterative reconstruction of low-statistics PET data: benefits of a resolution model. Physics in medicine and biology. 2011;56:931. doi: 10.1088/0031-9155/56/4/004. [DOI] [PubMed] [Google Scholar]
- Watson CC. New, Faster, Image-based scatter correction for 3D PET. IEEE Trans. Nucl. Sci. 2000;74:1587–1594. [Google Scholar]
- Yu Y, Chan C, Ma T, Liu Y, Gallezot J-D, Naganawa M, Kelada OJ, Germino M, Sinusas AJ, Carson RE. Event-by-Event Continuous Respiratory Motion Correction for Dynamic PET Imaging. Journal of Nuclear Medicine. 2016;115:167676. doi: 10.2967/jnumed.115.167676. jnumed. [DOI] [PubMed] [Google Scholar]


