Abstract
Physical injury, stroke, trauma, traumatic brain injury and spinal cord injury rank among the top causes of disability. There are a total of 54 million people in the US requiring rehabilitative assistance of which 15.3 million people are in the age groups of 18–44. However, the compliance rate for patients performing rehabilitation exercises in the home environment is poor. In this paper, we design and prototype a personalized home rehabilitation system, MotionTalk, for the real time quantitative assessment of mobility. Performance of rehabilitation is designed to be assessed using the changes in mobility, reflected in the exercises performed by patients at home with respect to the same exercises performed in the clinic. Our system is capable of capturing motion using Microsoft Kinect and analyzing the position and rotation information to give scores for assessing rehabilitation progress. In comparison to conventional rehabilitation systems, MotionTalk is an inexpensive (<$150 compared to conventional systems costing >$1000), less intrusive and personalized home rehabilitation system, which was developed and tested using data from able-bodied volunteers at Georgia Institute of Technology.
1. INTRODUCTION
Physical injury, stroke, trauma, traumatic brain injury (TBI) and spinal cord injuries rank amongst the top causes of disability worldwide, affecting around 10 million individuals [1]. In the United States of America, nearly one in five individuals need rehabilitative assistance [2]. Conditions like stroke, TBI, trauma, paraplegia, physical injury hinder functional independence and often present cognitive, social, emotional and behavioral impairments. Survivors of these conditions present with disrupted central and executive mechanisms underlying arm and postural (trunk and legs) coordination [3, 4]. Research has shown that impairments in mobility can lead to poor quality of life [5]. Exercise has been shown to be beneficial in improving brain plasticity and neurocognitive performance in TBI and stroke [6]. In the elderly populations, regular exercise results in increased maximum aerobic capacity due to peripheral changes in muscle and also due to cardiovascular changes with increased stroke volume and cardiac output [7]. The fact that rhythmic exercises have been proven to help in the rehabilitation of TBI, stroke patients has formed the basis of the treatment of patients with TBI. Goldshtrom et al performed rhythmic exercises like alternating hands and feet movements and, bilateral activation of body and extremities, and then observed the pre and post treatment progress in the areas of gait, functional assessment and cognition [8]. Bilateral alternating exercises help in the improvement of motor coordination in the affected limb in patients with central or peripheral impairments [8] and a repetitive bilateral arm movement exercise has been found to be effective for upper extremity rehabilitation [9]. In addition to these rhythmic movements, range of motion has been shown to be an indicator of progress for patients with TBI and stroke. It is sought through these exercises to monitor and improve the range of motion values [10]. In traditional clinical setup, these exercises are typically performed with therapists either in clinics or rehabilitation centers. The exercises performed at these facilities need to be followed up at home. However the issue is that the motivation levels to exercise at home are low due to falls risk and other compliance related issues [11]. The use of wearable, interactive technology and virtual reality based applications for rehabilitation has been proposed as the solution to improve patient engagement and help rehabilitation in TBI and stroke [12–14]. Though these systems are fairly successful, they have certain inherent limitations.
Most technology-assisted studies in rehabilitation focus majorly on the rehabilitation of individual regions such as upper body rehabilitation, gait and balance analysis and arm rehabilitation. Wu et al designed a wearable robotic system for rehabilitation of the arms. The system allowed the users to perform rhythmic grasping and finger extending motions to help improve the self-powered motion of the fingers and thumb [15]. Ustinova et al demonstrated the use of virtual reality and gaming environment to improve the whole body motions. Their system uses preset exercises in the form of a game with a standard camera and marker based motion capture system as input and the data analyses are performed using statistical methods, following dimensionality reduction [3]. However, most of these systems require expensive devices or wearable sensors and are therefore unsuitable for convenient home based rehabilitation. Chang et al demonstrated that Microsoft Kinect sensor could be used for rehabilitation with a performance which could approximate the more expensive traditional rehabilitation systems such as the optiTrack systems [16]. Pastor et al used Microsoft Kinect as the input device for a game to perform upper limb rehabilitation for stroke survivors. A game was designed to increase the range of motion of the patients. This was performed by requiring the patients to move the cursor to a specific spot. The speed of the movement was considered indicative of progress and was used to score the game. Kalman filter was used to reduce the jitter in the points obtained from Kinect. The premise of the game was that repeated practice would help decrease the time spent on these preset movements [1]. However, this game used preset rehabilitation exercises which are not customizable based on each patient’s needs.
To make a truly customizable and personalized health system, we propose an inexpensive (<$150), and easy to use system requiring minimal setup called MotionTalk, which is capable of personalized physical rehabilitation in the home environment. It is capable of improving patient engagement and assist rehabilitation by capturing 3-D body motions using Microsoft Kinect. Our study focuses on the development of similarity scores between video features for assisting the rehabilitation of TBI patients using rotation scores, position scores and range of motion for the quantitative analysis and determination of progress in patients.
The rest of the paper is organized as follows: First, we present the design considerations of our system, wherein we discuss the use cases and system implementation. This is followed by the data analytics approach. Finally before we conclude, we present our results from the data from six volunteers.
2. DESIGN AND IMPLEMENTATION
MotionTalk compares the features from two videos created using the exercises performed at home and those ideally performed in the clinics to provide similarity scores based on position and rotation information. In addition, the system gives the range of motion scores for each session for each patient.
2.1 Use Cases
The use cases are represented in the Unified Modeling Language (UML). There are three actors identified: patients, caregivers/therapists and physical rehabilitation system (MotionTalk). The caregivers/therapists can use the system to track the patient progress and home based exercise remotely to ensure that patient progress is as expected. They can view the scores of each patient over time to assess the progress and can also assist in the creation of new videos to the video pool. The patients perform the rehabilitation and scores are presented to them in real time. The system captures the motions, stores the same performs analysis and presents the scores.
Figure 1 shows the seven use cases for these actors. The use cases are as follows:
Figure 1.
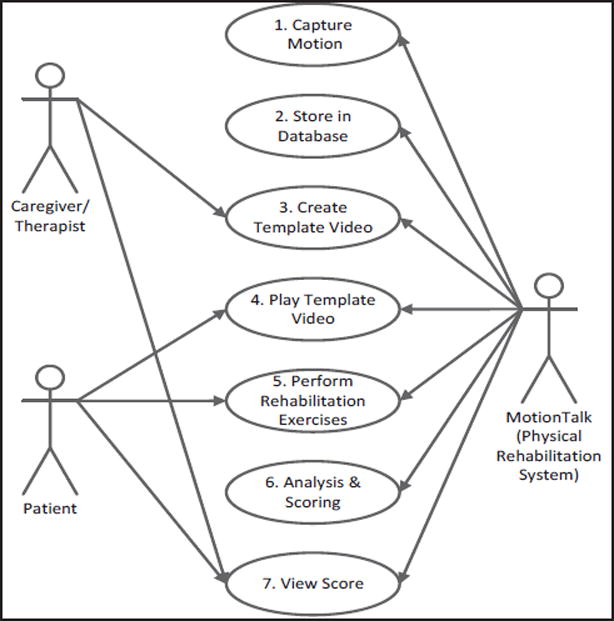
Actors and use cases in physical rehabilitation for traumatic brain injury. Caregivers and therapists include medical personnel at the clinics or rehabilitation institutes. Patients are individuals with mild TBI requiring rehabilitative assistance at home
2.1.1 Capture Motion
Microsoft Kinect is used to collect the motion data pertaining to 20 joint angles and rotation using Microsoft Kinect SDK v1.5. This is then subsequently stored in a database and analyzed.
2.1.2 Store Motion Data
Data collected is stored in a MySQL database. Each patient is assigned a user identification number and no personal details are stored.
2.1.3 Create Video Template
Personalized patient rehabilitation can be performed through the addition of new videos which are patient progress dependent. These videos are designed to be created in the presence of the therapists at clinics. They can then be used by the patient for home based rehabilitation subsequently.
2.1.4 Play Template Video
The patient should play a pre-created template video each time before performing the exercise.
2.1.5 Perform Rehabilitation Exercises
The patient performs rehabilitation exercises after playing the video. Once the patient saves the session the score is made available.
2.1.6 Analysis and Scoring
The data analysis engine performs dynamic time warping on position and rotation information to arrive at two different scores. In addition the maximum range of motion scores (obtained as the distance between the hip and wrist) are also given.
2.1.7 View Scores
The patients can view the scores of the current session. The caregivers/therapists can view the cumulative results for any given patient at any time to assess progress.
2.2 System Implementation
MotionTalk (Figure 2) captures patient exercise performance using Microsoft Kinect avoiding user-sensor contact. The major components of the system are the Microsoft Kinect sensor, an adaptor for adding the Kinect as a peripheral to a PC, the data storage module, data analytics module, and the software interface.
Figure 2.
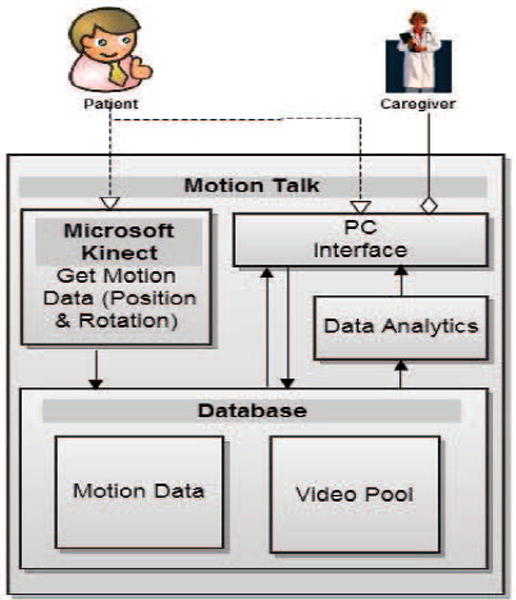
System architecture for MotionTalk: Personalized Home Rehabilitation system for TBI
2.2.1 Microsoft Kinect Sensor
The Kinect sensor is a low cost off the shelf component (<$100) which requires minimal setup and training. It uses two RGB video cameras and a near infrared sensor to detect motion and distance. We obtain X, Y, Z coordinates obtained in millimeters with the camera center as the origin and joint rotations as Quaternion (W, θX, θY, θZ) [17] from up to 20 joints along with the time stamp at a maximal rate of 30 frames per second (fps). This data can be obtained in two modes namely, sitting and standing. In seated mode only the upper joints are captured. Figure 3 shows the joints in seated and standing modes respectively. The data from this module is store in the data storage module.
Figure 3.
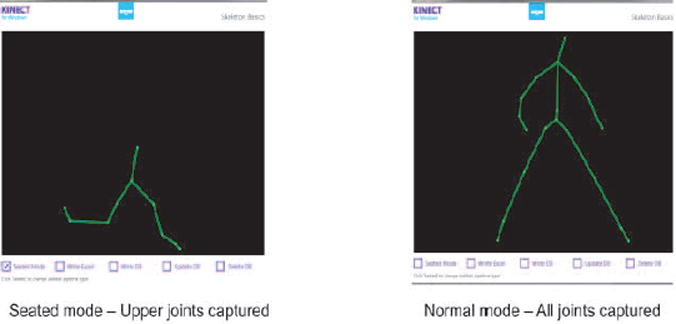
Kinect data shown in seated and standing modes respectively.
2.2.2 Data Storage Module
The position and rotation data from each session is stored in a MySQL database with each record being a frame. Each session is uniquely identified using a combination of the user ID and a stream ID which is system generated on the basis of the current timestamp. All the frames belonging to a specific session share a common session ID and each frame has its frame ID. The data belonging to a specific video can be retrieved using session ID. The timestamps for each frame is associated with both the session ID and frame ID. Since application is designed for personalized rehabilitation, the videos are also associated with user identities. In addition, a local copy storage in the form of excel sheets can also be made by the patients. The template is captured and stored as Audio Video Interleaved (media format) (Avi) files along with the position and rotation information. This Avi file (stored locally) is then played back then the rehabilitation occurs for user to follow. The user can select from a list of Avi files to be played.
2.2.3 Data analytics Module
The data analytics module analyzes the information from Kinect obtained from home videos, compares it with the original template video data designed to be collected from clinics and then arrives at a similarity score. The data is analyzed using dynamic time warping to arrive at two similarity scores based on position and rotation values. In addition the system is capable of giving the maximum range of motion achieved by the patient in each session. This would help the caregivers to be able to quantitatively assess the performance of each patient and assess improvements in gait and balance. In addition, we get the times and date at which the exercises were performed at home. Using this we can compute the compliance to the exercise schedule set by the therapists.
2.2.4 Software Interface
The system has an interface (Figure 4) with a panel to play the template video (clinic video) and two panels to show the exercise being performed in real time (home video). The user can also see the joints tracked by the camera. In addition, the user can either see the video camera image or the infrared image in the second panel. The user has options to record a template video, store a session for later review, make a local copy of the session, view the range of motion at each instant and the maximum range of motion scores in addition to the position and quaternion scores. A weighted overall score can also be viewed. The user has options to display either the instantaneous range of motion, position scores or rotation scores. The scores can be viewed for both the current session and the template session simultaneously. The trends of these scores over time can also be viewed. All these options are made available to the user after authentication with a password. Creation of new user accounts and profile deletions are also supported for users with administrative access. The cumulative progress over time can be viewed by the physician (Figure 5). It shows the range of motion, position and rotation scores over time.
Figure 4.
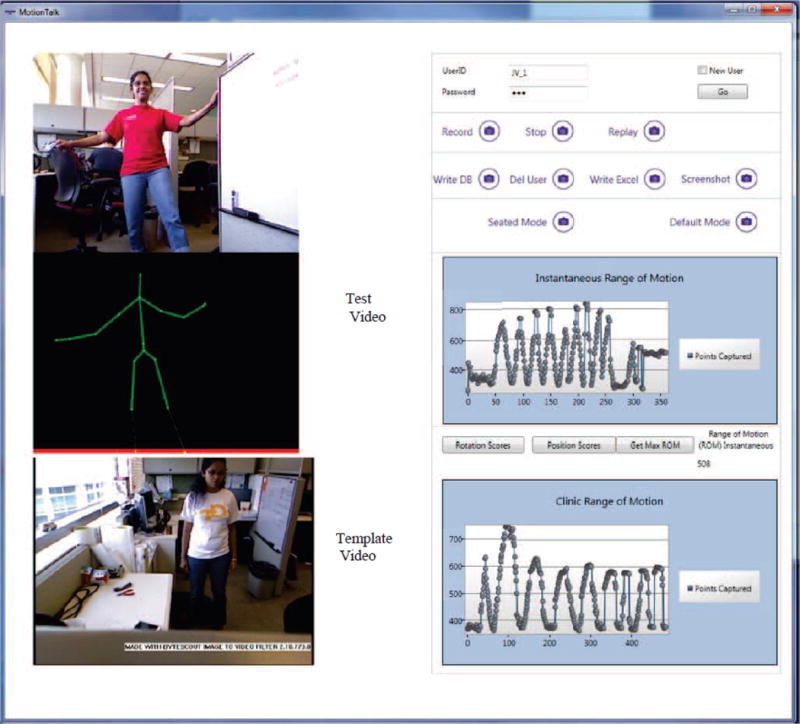
Palient Visualization Template and Test video Visualization.
Figure 5.
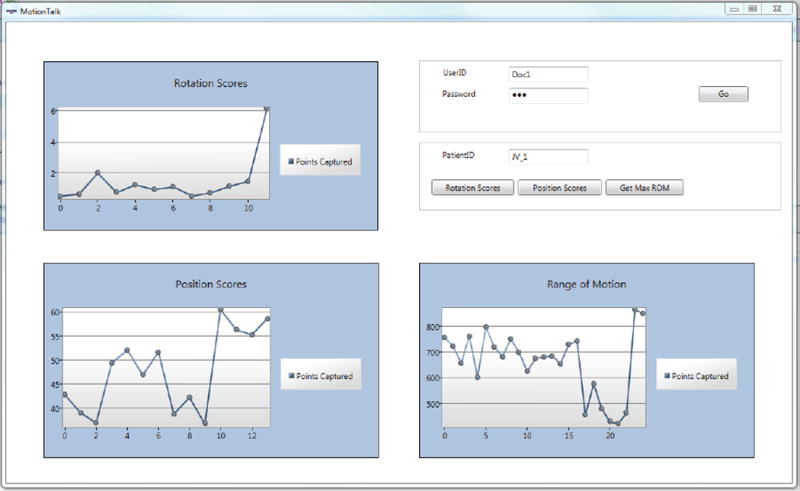
Caregiver Interface which gives the trend of position, rotation and range of motion scores over time
3. DATA ANALYSIS
Data analysis compares the test video (exercise performed by patients at home) against the template video (exercise performed by the same patient ideally at the clinic) and gives the similarity score as a performance measurement using steps shown in Figure 6.
Figure 6.
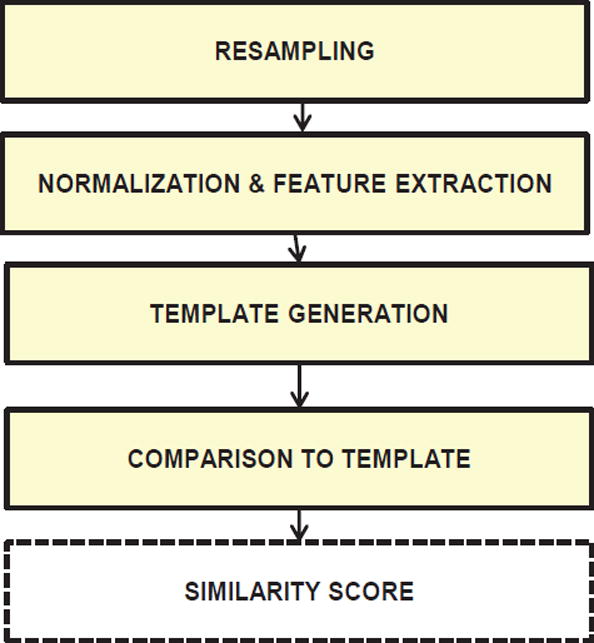
Steps in Motion Analysis
3.1 Motion Data
The data from Microsoft Kinect contains position (X, Y, Z) and rotation (W, θX, θY, θZ). Frames are obtained at a non-uniform sampling rate; hence the data from both the test and template videos needs to be resampled before they can be compared to one another.
3.2 Resampling Time Frames
Position frames are resampled using spline based (fitting a piecewise polynomial) interpolation techniques. Multidimensional interpolation traditionally uses data from multiple dimensions to impute a value from a single dimension. In our data, all the samples have to be imputed on the basis of time. Therefore imputation was performed by interpolating each dimension separately on the basis of time. This technique was tested on synthetic surfaces prior to implementation on the system. Quaternion data was interpolated using spherical linear interpolation (slerp) outlined by Buss et al [18]. The quaternion data is normalized prior to resampling since the implementation of slerp requires that all the quaternions to be normalized prior to interpolation.
3.3 Normalization & Feature Extraction
Feature extraction is performed after normalization of the raw position (X, Y, Z) and quaternion (W, θX, θY, θZ) data.
Motion data obtained from Kinect has the camera center as the origin. This can lead to discrepancy if the test and template videos are taken with the subject in different physical locations with respect to the camera. This is solved by shifting the frame of reference to the first frame. The template for the normalization of position data is the T calibration pose (two hands stretched out). The median of all the frames in the T pose is used as the normalization template. The variation in distance from the camera is accounted by scaling the data. The distance between the two palms in the normalization template and the distance between the head and hip are used for scaling. This pose is performed each time prior to the actual exercise.
Following normalization, feature extraction is performed. The features used for obtaining the position scores are normalized position (20 × 3), velocity (20 × 3) and acceleration (20 × 3). The velocity in three dimensions are obtained by the differentiation of position values ( , and ) between 2 adjacent frames. The acceleration values are obtained by differentiating the velocity values ( , and )) between two adjacent frames. The quaternion features are the rotation values obtained after resampling. All the quaternion values are taken with respect to the first frame.
3.4 Template generation
After feature extraction, the test video is compared to a template generated using the reference video to generate the scores. The approaches which were considered for generating template from the reference video were a) the use of the reference frames after feature extraction, b) combining five adjacent frames using median in a moving window technique. These approaches were used both for the position and quaternion values. The results obtained from both these approaches were very similar. The system is capable of updating the reference template using an aligned median of similar videos. The similarity of the test to the template is determined using DTW scores.
3.5 Comparison with Template
Our system is designed to provide similarity scores to compare a test video (exercises performed at home) with a template video (exercises ideally performed in the clinic) to give an assessment. Scores using position and rotation value are obtained using dynamic time warping (DTW). DTW aligns the two feature sets and finds the deviation between the two sets at best possible alignment. We use this principle to find the similarity score. The features from the test and template videos are both spatially and temporally aligned and then the similarity score is computed. The position score is computed by aligning the template video with the test based on Euclidean distance and then summing the deviation as the scores. The scores for rotation are generated by comparing quaternion distances. DTW scores proved to be reliable amongst the various methods tested such as correlation, direct difference scores and DTW [19].
3.5.1 Dynamic Time Warping
Dynamic time warping works by aligning two sequences with each other and finds the best path by minimizing the distance between them. Let A(t) and B(t) be two sequences of lengths M and N respectively. The two sequences A(t), B(t) are placed on two axes of a matrix. Then the distances between each point on the two are computed and stored in a matrix D1. Then a distance matrix D is calculated from the first matrix by minimizing equation 1.
| 1 |
where d(i,j) is the cumulative distance at points i, j in the matrix. Distance between the two sequences A(t), B(t) equals D(M, N) for a matrix of dimensions M, N. For position data, the distances used are the Euclidean distance. Jabalonski et al demonstrated the use of quaternion with dynamic time warping for alignment, however only one distance measure was used and tested [20]. Switonski et al demonstrated the use of DTW based quaternion analysis for motion analysis and gait classification [21]. In our application, multiple distance measures were investigated to pick the score best suited to the application. Given two quaternions, q1 and q2, represented as q = w + xȋ + yĵ + zќ and ȋ, ĵ, ќ are √−1, different distance measures are as follows:
- The minimum length of geodesic line connecting two quaternions on the four dimensional unit spheres. It is given in equation 2]
2 - Euclidean distance between two quaternions given in equation 3
3 - The L2 distance measure given in equation 4
4
Each of the distance measures described in the equations 2–4 was used as a distance measure to compute DTW. The DTW algorithm was used for both spatial and temporal alignment.
3.5.2 Temporal alignment
The features from video segments of 30 sec were aligned temporally to arrive at the DTW distances. After the best possible alignment was achieved, the sum was computed as the temporal alignment score. This was done to achieve best temporal alignment of frames. The aligned sequences were used for subsequent spatial alignment.
3.5.3 Spatial alignment
The features in each frame of the temporally aligned template video were aligned with the features in each frame of the temporally aligned test video using DTW. After the best possible alignment was achieved, the sum was computed as the DTW rehabilitation score.
This was performed for the position data and the rotation data to obtain a set of scores along with the range of motion information. The position and rotation scores have a range from 0 to ∞ with a lower score being considered better.
3.6 Computing Range of Motion Scores
Range of motion trends have been shown to be indicative of rehabilitation progress in patients with TBI and stroke [22]. It is used as a standard clinical test for patients requiring physical rehabilitation. The range of motion is defined as the distance between the wrist and the hip joint. The scores are obtained by taking the maximum range of motion values achieved in a session. An increase in the range of motion leads to an improvement in the patient’s condition. Patient assessment is performed by using the position, rotation and range of motion scores. While lower position and rotation scores imply better performance of the exercise and an increase in the range of motion scores implies patient progress.
3.7 Feature Ranking and Weighting of Scores
The scores obtained from rotation data and position data are ranked to find the top scores which are capable of achieving the best separation between the different exercises. The features are ranked to determine the top features which can be used for differentiating between the various movements in the future systems. In addition, it also gives us a system to weight the different scores to obtain a single composite score. Supervised ranking of the different scores is performed using minimum redundancy maximum relevance feature selection (mRMR) [23]. The score comparisons are used as labels for ranking the scores. The label is similar (‘0’) when the two sequences compared belong to the same exercise and dissimilar (‘1’) when the two sequences compared belong to different exercises. The position and rotation scores are then weighted according to the rank to obtain a single cumulative score.
3.8 Evaluating progress and alerts to the care provider
The trend of range of motion scores is considered to be indicative of rehabilitation progress in TBI and stroke. The trend of these scores, coupled with the position & quaternion scores are used to define rules for informing the care-giver of possible progress or reversal. When the mean of position & rotation scores are increasing and range of motion (ROM) scores are decreasing, the patient is likely to have possible reversals. However, when the trend in range of motion scores is increasing and the mean of position and rotation scores increase, it may mean possible progress. When the trend in range of motion scores is increasing and the mean position and quaternion scores is stable, it may also mean possible progress. In case the mean DTW scores are decreasing, it means that the patient is following the exercise and if the range of motion trends do not change appreciably, then the patient is stable (Figure 7).
Figure 7.
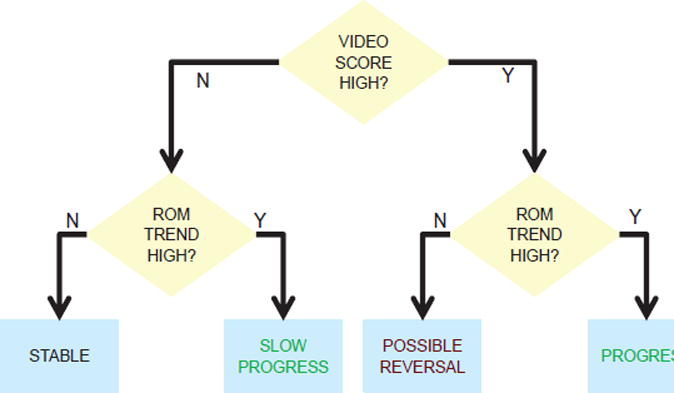
Evalutiug progress & providing alerts to care providers
4. RESULTS and DISCUSSION
A total of 36 videos captured from six able bodied volunteers in the age group 22–30 were used for the development and evaluation of the data analytics in MotionTalk. The volunteers performed three different rhythmic exercises and three static poses. The dynamic exercises performed were hand waving, rhythmic leg movement and alternate leg and hand movement. The static poses performed were standing with hands down, T pose (calibration pose) and vertical stretch. DTW algorithm (described above) was used on this data to obtain the scores for position and rotation. Each video of the 36 videos was compared to itself and all the other videos, obtaining a total of 1,296 (36×36) comparisons. Since scores are designed to give a lower score when two similar sequences are compared and a larger score when dissimilar sequences are compared, a separation in the values of these scores should be seen in the two situations. Figure 8(a) gives the ideal outcome where the scores of dissimilar videos have a large value and those of similar videos have a very small value. Red color represents to small score values and yellow represents large values.
Figure 8.
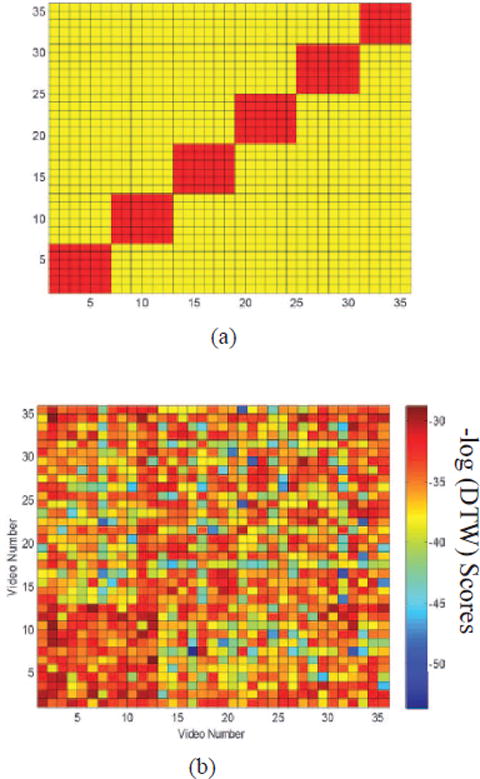
(a) Desired Visualization. The red color represents similar videos and yellow represents dissimilar videos (b) Log of DTW Position Scores
4.1 Euclidean Scores from Position Data
The application of DTW on the position data gives a total of three different scores, which were scores obtained after spatial temporal alignment, scores from temporal alignment alone, and scores from spatial alignment alone. Figure 8b shows the negative log of the spatial temporal scores. Though some separation between similar and dissimilar videos was seen, it was not enough to perceive visually. Hence we classified the scores obtained from the 1,296 comparisons into similar and dissimilar using two different techniques, namely, logistic regression and support vector machines (SVM).
4.2 Scores from Rotation Data
The application of DTW with three different distance metrics on rotation data resulted in a total of 3 different rotation scores, namely, 1) minimal geodesic line for quaternion, 2) L2 distance for quaternion and 3) Euclidean distance for quaternion. The Figure 9(a) gives the quaternion scores obtained using minimum length of geodesic line measure. This method was able to give a large difference between the scores of the similar and dissimilar videos, but the results are not visually discernible. Figure 9(b) gives the log of the DTW scores which were obtained using Euclidean distance. This score separation, though numerically less than that of geodesic line was more visually distinguishable. Figure 9 (c) gives the quaternion scores which were obtained using L2 distance measure. The rotation scores produced from similar and dissimilar videos also feature ranked and classified using support vector machines and logistic regression.
Figure 9.

(a) Minimum length of geodesic line quaternion scores (b) Euclidean distance quaternion scores (c) L2 distance quaternion scores
4.3 Feature Ranking & Classification
The scores obtained from the total 36 × 36 (1,296) comparisons (see section 4 for details) were first feature ranked using mRMR and then classified as similar and dissimilar using logistic regression and SVM classifiers. Two of the three quaternion scores were found to be ranked higher than position scores (Table 1) using all the samples. The scores from comparisons with 30 videos were used for training and six videos containing one pose each were used for validation. Of the 30 videos used for training, 24 were used for training the classifier and six containing one pose each were used for testing the classifier. This process was repeated six times. The performance of the two classification schemes was tested by ranking the position and quaternion scores. The number of features was picked based on best mean area under the curve statistic (AUC) when tested with the test data. For validation, the model with best mean AUC was chosen. This model was tested against the validation data set (Figure 10). The model with the best mean AUC used all the six features. The validation AUC for logistic regression was 57±1% and that for SVM was found to be 78±0%. These results suggest that a combination of these scores is capable of differentiating between similar and dissimilar movements. Therefore, these scores can be used for assessing whether patients are making the same motion. The scores may show better separability if the number of test participants were increased. In the future we hope to evaluate motion talk on a larger set of patients and healthy volunteers.
Table 1.
Scores ranked using mRmR to achieve best separation between similar and dissimilar motions.
| Ranking | Features |
|---|---|
| 1 | Minimum length of geodesic line for quaternion |
| 2 | L2 distance measure for quaternion |
| 3 | Temporal alignment for position scores |
| 4 | Spatiotemporal alignment for position scores |
| 5 | Spatial alignment for position scores |
| 6 | Euclidean distance measure for quaternion |
Figure 10.
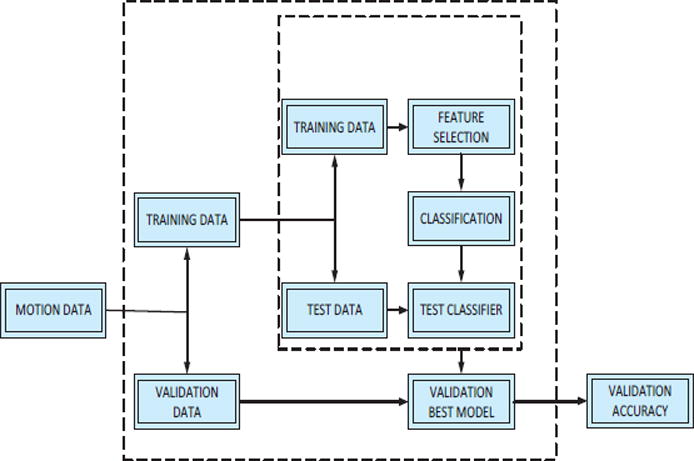
DTW score classification plan
5. CONCLUSION and FUTURE WORK
Conventional physical rehabilitation in TBI, stroke, paraplegia and other physical disorders are sparse and home based systems suffer from issues of compliance, low patient engagement and lack of personalization. MotionTalk is a system intended to improve patient engagement and assist physiotherapeutic rehabilitation in the home environment by capturing 3-D body motions using Microsoft Kinect. The system has the functionality to allow the therapists to customize and add physical therapy exercises and corresponding 3-D motion videos for each patient depending on the requirements of the patients for their rehabilitation at home. Our study combines rotation features as quaternions to enhance the scores obtained using position data and range of motion studies. MotionTalk is proposed as a convenient and comfortable way to allow patients the access to the expertise of physical therapists in the home environment and to help reduce the health care costs through remote access and improved compliance.
MotionTalk is currently limited in its evaluation which we hope to improve in the future by testing MotionTalk on patients with TBI to demonstrate usability and improved clinical outcomes. We will test the results of the system using more quantitative measures such as t-test and ANNOVA. MotionTalk is currently limited in the evaluation of fine motor movements and in the tracking of joints not in front of the camera. We hope to improve upon this with the use of more sensing modules. In addition, each joint is given equal weight, we will evaluate the importance of each joint to the rehabilitation process using knowledge driven analysis and weigh each joints accordingly. We will improve upon the template updates to reflect and account for patient progress. More scores of performance such and balance will also be incorporated. Ultimately, we would like to see MotionTalk as a combination of open source motion sensing, cloud database, data analytics, and mobile app technologies, which provides a low-cost and easy-to-use channel for motion assessment.
References
- 1.Pastor I, Hayes HA, Bamberg SJM. A feasibility study of an upper limb rehabilitation system using kinect and computer games. Engineering in Medicine and Biology Society (EMBC), 2012 Annual International Conference of the IEEE. 2012:1286–1289. doi: 10.1109/EMBC.2012.6346173. [DOI] [PubMed] [Google Scholar]
- 2.Gabel M, Gilad-Bachrach R, Renshaw E, Schuster A. Full body gait analysis with Kinect. Engineering in Medicine and Biology Society (EMBC), 2012 Annual International Conference of the IEEE. 2012:1964–1967. doi: 10.1109/EMBC.2012.6346340. [DOI] [PubMed] [Google Scholar]
- 3.Ustinova KI, Leonard WA, Cassavaugh ND, Ingersoll CD. Development of a 3D immersive videogame to improve arm-postural coordination in patients with TBI. J Neuroeng Rehabil. 2011;8:61. doi: 10.1186/1743-0003-8-61. [DOI] [PMC free article] [PubMed] [Google Scholar]
- 4.Gordon NF, Gulanick M, Costa F, Fletcher G, Franklin BA, Roth EJ, et al. Physical Activity and Exercise Recommendations for Stroke Survivors: An American Heart Association Scientific Statement From the Council on Clinical Cardiology, Subcommittee on Exercise, Cardiac Rehabilitation, and Prevention; the Council on Cardiovascular Nursing; the Council on Nutrition, Physical Activity, and Metabolism; and the Stroke Council. Circulation. 2004 Apr 27;109:2031–2041. doi: 10.1161/01.CIR.0000126280.65777.A4. 2004. [DOI] [PubMed] [Google Scholar]
- 5.Motl RW, McAuley E. Physical activity, disability, and quality of life in older adults. Phys Med Rehabil Clin N Am. 2010 May;21:299–308. doi: 10.1016/j.pmr.2009.12.006. [DOI] [PubMed] [Google Scholar]
- 6.Archer T. Influence of physical exercise on traumatic brain injury deficits: scaffolding effect. Neurotox Res. 2012 May;21:418–34. doi: 10.1007/s12640-011-9297-0. [DOI] [PubMed] [Google Scholar]
- 7.Schwandt M, Harris JE, Thomas S, Keightley M, Snaiderman A, Colantonio A. Feasibility and Effect of Aerobic Exercise for Lowering Depressive Symptoms Among Individuals With Traumatic Brain Injury: A Pilot Study. The Journal of Head Trauma Rehabilitation. 2012;27:99–103. doi: 10.1097/HTR.0b013e31820e6858. [DOI] [PubMed] [Google Scholar]
- 8.Goldshtrom Y, Knorr G, Goldshtrom I. Rhythmic exercises in rehabilitation of TBI patients: a case report. J Bodyw Mov Ther. 2010 Oct;14:336–45. doi: 10.1016/j.jbmt.2009.06.002. [DOI] [PubMed] [Google Scholar]
- 9.Hijmans JM, Hale LA, Satherley JA, McMillan NJ, King MJ. Bilateral upper-limb rehabilitation after stroke using a movement-based game controller. Journal of rehabilitation research and development. 2011;48:1005–1013. doi: 10.1682/jrrd.2010.06.0109. [DOI] [PubMed] [Google Scholar]
- 10.Sietsema JM, Nelson DL, Mulder RM, Mervau-Scheidel D, White BE. The Use of a Game to Promote Arm Reach in Persons With Traumatic Brain Injury. The American Journal of Occupational Therapy. 1993 Jan 1;47:19–24. doi: 10.5014/ajot.47.1.19. 1993. [DOI] [PubMed] [Google Scholar]
- 11.Keith CLT, Slifer J, Gerson Arlene C, Sevier Robert C, Kane Alana C, Amara Adrianna, Clawson Betsy P. Antecedent management and compliance training improve adolescents’ participation in early brain injury rehabilitation. Brain Injury. 1997;11:877–890. doi: 10.1080/026990597122954. [DOI] [PubMed] [Google Scholar]
- 12.Cantin JF, McFadyen BJ, Doyon J, Swaine B, Dumas D, Vallee M. Can measures of cognitive function predict locomotor behaviour in complex environments following a traumatic brain injury? Brain Inj. 2007 Mar;21:327–34. doi: 10.1080/02699050701209972. [DOI] [PubMed] [Google Scholar]
- 13.Bland DC, Zampieri C, Damiano DL. Effectiveness of physical therapy for improving gait and balance in individuals with traumatic brain injury: A systematic review. Brain Injury. 2011;25:664–679. doi: 10.3109/02699052.2011.576306. 2011/07/01. [DOI] [PMC free article] [PubMed] [Google Scholar]
- 14.Cancelliere C, Cassidy JD, Cote P, Hincapie CA, Hartvigsen J, Carroll LJ, et al. Protocol for a systematic review of prognosis after mild traumatic brain injury: an update of the WHO Collaborating Centre Task Force findings. Syst Rev. 2012;1:17. doi: 10.1186/2046-4053-1-17. [DOI] [PMC free article] [PubMed] [Google Scholar]
- 15.Wu J, Huang J, Wang Y, Xing K. A Wearable Rehabilitation Robotic Hand Driven by PM-TS Actuators. In: Liu H, Ding H, Xiong Z, Zhu X, editors. Intelligent Robotics and Applications. Vol. 6425. Springer Berlin Heidelberg; 2010. pp. 440–450. [Google Scholar]
- 16.Chien-Yen C, Lange B, Mi Z, Koenig S, Requejo P, Noom S, et al. Towards pervasive physical rehabilitation using Microsoft Kinect. Pervasive Computing Technologies for Healthcare (PervasiveHealth), 2012 6th International Conference on. 2012:159–162. [Google Scholar]
- 17.Zhang F. Quaternions and matrices of quaternions. Linear algebra and its applications. 1997;251:21–57. [Google Scholar]
- 18.Buss SR, Fillmore JP. Spherical averages and applications to spherical splines and interpolation. ACM Trans Graph. 2001;20:95–126. [Google Scholar]
- 19.Venugopalan J, Cheng C, Stokes TH, Wang MD. Kinect-based Rehabilitation System for Patients with Traumatic Brain Injury. presented at the IEEE-EMBC. 2013 doi: 10.1109/EMBC.2013.6610578. [DOI] [PMC free article] [PubMed] [Google Scholar]
- 20.Jablonski B. Quaternion Dynamic Time Warping. Signal Processing, IEEE Transactions on. 2012;60:1174–1183. [Google Scholar]
- 21.Adam Œ, Agnieszka M, Henryk J, Andrzej P, Konrad W. Dynamic Time Warping In Gait Classification of Motion Capture Data. World Academy of Science, Engineering and Technology. 2012;71:53–58. [Google Scholar]
- 22.Upper limb virtual rehabilitation for traumatic brain injury: Initial evaluation of the elements system. Brain Injury. 2010;24:780–791. doi: 10.3109/02699051003652807. 2010/05/01. [DOI] [PubMed] [Google Scholar]
- 23.Peng H, Long F, Ding C. Feature selection based on mutual information criteria of max-dependency, max-relevance, and min-redundancy. Pattern Analysis and Machine Intelligence, IEEE Transactions on. 2005;27:1226–1238. doi: 10.1109/TPAMI.2005.159. [DOI] [PubMed] [Google Scholar]


