

Abstract
There has been much debate recently over the functional role played by the planum temporale (PT) within the context of the dorsal auditory processing stream. Some studies indicate that regions in the PT support spatial hearing and other auditory functions, whereas others demonstrate sensory‐motor response properties. This multifunctionality has led to the claim that the PT is performing a common computational pattern matching operation, then routing the signals (spatial, object, sensory‐motor) into an appropriate processing stream. An alternative possibility is that the PT is functionally subdivided with separate regions supporting various functions. We assess this possibility using a within subject fMRI block design. DTI data were also collected to examine connectivity. There were four auditory conditions: stationary noise, moving noise, listening to pseudowords, and shadowing pseudowords (covert repetition). Contrasting the shadow and listen conditions should activate regions specific to sensory‐motor processes, while contrasting the stationary and moving noise conditions should activate regions involved in spatial hearing. Subjects (N = 16) showed greater activation for shadowing in left posterior PT, area Spt, when the shadow and listen conditions were contrasted. The motion vs. stationary noise contrast revealed greater activation in a more medial and anterior portion of left PT. Seeds from these two contrasts were then used to guide the DTI analysis in an examination of connectivity via streamline tractography, which revealed different patterns of connectivity. Findings support a heterogeneous model of the PT, with functionally distinct regions for sensory‐motor integration and processes involved in auditory spatial perception. Hum Brain Mapp 33:2453–2463, 2012. © 2011 Wiley Periodicals, Inc.
Keywords: fMRI, diffusion tensor imaging (DTI), functional seed masks, motion, covert repetition
INTRODUCTION
The functional role of the planum temporale (PT) has been a long‐standing topic of debate. Initially thought to subserve language function, much recent research has focused on its role in the posterior dorsal auditory processing stream [Hickok, 2009]. Results suggest that a diverse range of processes involve the left hemisphere PT, including: speech perception [Jäncke et al., 2002; Meyer et al., 2005], speech production [Graves et al., 2007; Peschke et al., 2009], music processing [Schlaug et al., 1995], tone sequence perception [Binder et al., 2000], auditory spatial processing [Barrett and Hall, 2006; Krumbolz et al., 2005), and auditory‐motor integration [Hickok et al., 2003, 2009; Warren et al., 2005]. However, since these data stem from separate domains of research, potential overlap between these processes and consequently the internal structure of the PT remains unknown.
The PT is widely thought to be part of the dorsal auditory pathway. One line of research has posited its involvement as a location sensitive “where” stream, citing primate cortical auditory evidence [Rauschecker, 1998]. Neuroimaging studies on spatial hearing in humans report regions sensitive to motion [Krumbholz et al., 2005; Pavani et al., 2002; Warren et al., 2002], spatial change [Smith et al., 2004, 2007], and sound source location [Altmann et al., 2007; Barrett and Hall, 2006; Warren and Griffiths, 2003]. Results clearly indicate the PTs responsivity to spatial manipulations; however, there is some debate about whether these networks are responsive purely to spatial information or are more broadly engaged in supporting auditory stream segregation [Smith et al., 2010; Zatorre et al., 2002]. This suggests that the PT's role in the posterior auditory stream may be more involved than a simple “where” function.
Another line of research on dorsal stream function has implicated sensory‐motor integration [Buchsbaum et al., 2001; Hickok et al., 2003; Hickok and Poeppel, 2000, 2004, 2007; Warren et al., 2005; Wise et al., 2001]. A region in posterior PT along the temporal parietal boundary, area Spt, exhibits auditory‐motor response properties during covert production [Buchsbaum et al., 2001; Hickok et al., 2003, 2009; Peschke et al., 2009] similar to posterior parietal regions, which supports visuomotor integration for grasping or eye movements [Culham, 2004; Grefkes et al., 2004]. Disruption to area Spt resulting from lesion or electrical stimulation [Anderson et al., 1999; Buchsbaum et al., in press; Damasio and Damasio, 1980] impairs verbatim repetition of heard speech, leaving speech perception relatively spared. Thus, the involvement of posterior PT regions in sensory‐motor integration could be broadly characterized as part of a “how” stream.
In summary, these results present a muddled picture of PT and dorsal stream function. Some have attempted to unify these data by positing a common computational mechanism in the PT [Griffiths and Warren, 2002; Rauschecker and Scott, 2009]. An alternative account has been proposed, which argues for functionally subdivided processing regions in the PT [Hickok, 2009], but has yet to be explored. The current study addresses this issue by employing a within subjects fMRI design to explicitly delineate whether discrete or overlapping processing systems are supporting spatial hearing and sensory‐motor integration.
METHODS
Subjects
Seventeen (7 females) subjects between 18 and 30 years of age (mean age 23 years) were recruited from the University of California, Irvine (UCI) community and all received monetary compensation for their time. The volunteers were right‐handed, native English speakers with normal or corrected‐to‐normal vision, normal hearing by self‐report, no known history of neurological disease, and no other contraindications for MRI. Informed consent was obtained from each participant prior to participation in the study in accordance with UCI Institutional Review Board guidelines.
Materials and Procedure
The auditory speech stimuli consisted of 144 monosyllabic, CVC pseudowords generated using IPhOD (Irvine Phonotactic Online Dictionary, v. 1.4, http://www.iphod.com). Stimuli were selected from a normal range of phonotactic probability (Mean biphoneme probability = 0.0013, SD = 0.0007) and neighborhood density (Mean density = 26, SD = 9.5). Multiple natural tokens were recorded by an experienced male speaker; the best token recording of each pseudoword was selected to optimally match length and amplitude across recordings. Spatial hearing stimuli were broadband Gaussian noise bursts, matched for length to the mean of the pseudowords (677 ms), with a sampling rate of 44.1 kHz. Noise bursts were presented as a single stationary noise or as a noise sweep, spatially “moving” from left to right to left or right to left to right. To produce the percept of motion, stimulus interaural level differences (ILDs) were manipulated: 12 dB in the left when favoring the left ear and 12 dB in the right when favoring right ear.
Stimuli were presented in 12.5‐s blocks, with eight stimulus presentations per block at 1.5 s intervals. Each condition was presented 27 times over the course of the experiment. Blocks were presented consecutively in a pseudo‐randomized order, alternating one of four conditions or rest, such that no condition was heard twice in a row. Subjects were instructed to attend to a visual cue, which appeared in synchrony with the onset and offset of the auditory stimulus or in the case of rest conditions for the mean duration of the pseudoword stimuli. An X indicated that the subject should listen attentively to one of the following: (1) pseudowords, (2) stationary noise, (3) moving noise, or (4) rest. A “play” symbol (>) indicated that subjects should covertly, without mouth movement, repeat the stimuli once in the brief pause following stimulus presentation. Pseudowords were presented in all such conditions. The listen‐repeat condition was used to drive activity in sensory‐motor regions of the posterior planum temporale (Spt) and the listen‐rest condition served as a control for the effects of acoustic stimulation alone. Previous studies giving evidence for sensory‐motor integration in area Spt have relied on a covert rehearsal task to elicit production‐related activation [Buchsbaum et al., 2001; Hickok et al., 2003]. A shadowing paradigm was used here to elicit production in an attempt to lessen the contribution of working memory common to the more traditional rehearsal paradigm [Peschke et al., 2009].
The experiment started with a short scanning session to ensure they could comfortably hear the stimuli through the scanner noise, and to acclimatize them to the fMRI environment. This was followed by a brief DTI session and three experimental sessions (runs). Each experimental session contained an equal number of trials (blocks) of each condition and a single run was approximately 7 min long. Auditory stimuli were presented through an MR compatible headset and stimulus delivery and timing were controlled using Cogent software (http://www.vislab.ucl.ac.uk/cogent_2000.php) implemented in Matlab 6 (Mathworks, Inc, USA).
Data Acquisition
MR images were obtained in a Philips Achieva 3T (Philips Medical Systems, Best, The Netherlands) using an 8‐channel RF receiver head coil, which is located at the Center for Functional Onco‐Imaging at the University of California, Irvine. Diffusion‐weighted images were collected first, with an SE‐EPI pulse sequence. Acquisition included 32 non‐collinear gradient directions with b value = 800 and a single acquisition with b value = 0 for reference. Sixty axial slices were collected to cover the whole brain with FOV = 230 × 230 mm2 and 1.797 × 1.797 × 2 mm3 voxel size, NEX = 1. TR = 12,883 ms and TE = 48.7 ms were used with SENSE = 2 (POS factor = 1). Total scan duration was 6 min and 30 s including high order shimming, de‐ghosting and RF calibrations. Next, 231 functional volumes were collected in each of three sessions using Gradient Echo EPI (sense reduction factor = 2.4, matrix = 112 × 112 mm, slices = 34, TR = 2.5 s, TE = 25 ms, flip angle = 70, voxel size = 1.95 × 1.95 × 2 mm3). After the functional scans, a high resolution anatomical image was acquired in axial plane with an MPRAGE pulse sequence (matrix = 256 × 256 mm; slices = 160; TR = 8 ms; TE = 3.7 ms; flip angle = 8, size = 1 × 1 × 1 mm3, 13 subjects) or in sagittal plane (slice thickness = 1 mm; slices = 240; FOV = 240 mm; matrix 240 × 240; TR = 11 ms, TE = 3.55 ms; flip angle = 18°; SENSE factor reduction 1.5 × 1.5, 4 subjects).
Data Analysis
fMRI analysis
Preprocessing of the data was primarily performed using AFNI software [Cox, 1996], exceptions to this will be noted. First, motion correction was performed by aligning all volumes to volume 135 in the first run using a 6‐parameter rigid‐body model. Images in each run were scaled relative to the mean and smoothed with an isotropic 6 mm full width half maximum (FWHM) Gaussian kernel. For each subject, functional maps were then transformed into Montreal Neurological Institute (MNI) space to facilitate group level analysis using Advanced Normalization Tools [ANTs, Avants et al., 2008; Avants and Gee, 2004]. First, an optimal group template was generated using the high resolution anatomical image for each subject [Avants et al., 2007, 2010]. Second, the optimal template was mapped to MNI space using nonlinear (diffeomorphic) transformations derived using the ANTs software. Third, registration of the functional data was performed in a single transformation moving from native to MNI space, by applying the transformations derived from the respective anatomical images. Anatomical morphology of the posterior Sylvian Fissure is highly variable making good normalization difficult to achieve using standard 12‐parameter affine transforms. Choice of the registration algorithm utilized here (SyN) was motivated by its performance and ranking in an independent evaluation of 14 nonlinear deformation algorithms [Klein et al., 2009; Klein et al., 2010].
Analysis proceeded in two stages. First level analysis was performed on each subject using AFNI software [Cox, 1996]. To find parameter estimates that best explained variability in the data, regression analysis was performed on each subject. Each predictor variable representing the time course of stimulus presentation was convolved with a standard hemodynamic response function (HRF) and entered into the general linear model. The four regressors used in estimation of the model are the following: listen‐repeat, listen‐rest, stationary noise bursts, and spatially changing noise bursts. In addition, six motion parameters and the mean intensity were entered into the model for a total of 11 regressors. T‐statistics were calculated for each voxel and statistical parametric maps (SPMs) were created for each subject. Linear contrasts were then performed to identify regions significantly activated in the spatial hearing and sensory‐motor conditions. We contrasted spatially varying noise bursts with stationary noise bursts to identify cortical regions of enhanced activity associated with spatial hearing. We contrasted listen‐repeat activity with listen‐rest to find regions specifically activated in the sensory‐motor task. Group level analysis was then performed on the linear contrasts of the parameter estimates, treating each subject as a random effect. T‐tests were then performed for both contrasts of interest. Additional mixed‐effects meta‐analyses [Chen et al., 2010] were performed to directly compare the two contrasts (listen‐repeat—listen rest and moving noise—stationary noise) to quantitatively assess regional differences and interactions between conditions.
DTI analysis
Diffusion‐weighted images were preprocessed using AFNI software [Cox, 1996]. Images were aligned to the reference image (b = 0) using a 12‐parameter affine transformation in order to correct for head motion and distortions caused by eddy currents, and then aligned to the high resolution anatomical. The tensor was calculated and eigenvectors, eigenvalues, mean diffusivity, and fractional anisotropy were derived according to Basser and Pierpaoli [ 1996]. Fiber tracking was then performed for each subject in DTI Studio [Jiang et al., 2006], using the principal eigenvector and the fractional anisotropy map.
Definition of Seed Regions
Seed regions for streamlined tractography were derived from the t‐maps of the two contrasts of interest: sensory‐motor and spatial hearing. The peak voxel from within the major activation cluster in our region of interest (PT) were used to generate a sphere with a radius of 6 mm for each contrast (Figs. 1 and 2). Seed regions were defined in MNI space and then transformed into native space for each subject to perform fiber tracking, using the inverse transforms of the normalization process described above. The seed regions were defined in normalized space, but tracking performed in native space given debate in the field regarding normalization and transformation of vector data and the problems that can arise following spatial transformation (see Singh et al., 2010 for a brief review).
Figure 1.
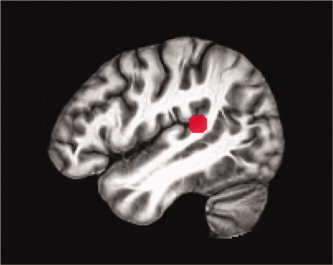
Seed region derived from the spatial hearing contrast displayed on the study‐specific template in MNI space.
Figure 2.
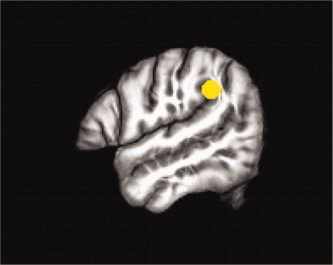
Seed region derived from the sensory‐motor contrast displayed on the study‐specific template in MNI space.
Fiber Tracking
Fiber tracts were reconstructed using FACT algorithm [Mori et al., 1999]. Two sets of fiber tracks, one for each seed region, were generated for each subject and spatially normalized to the standardized space, as previously described for the fMRI data, with consideration taken in the application of the transformations as appropriate for vector data [Avants et al., 2011]. Normalized fiber tracks were combined for all subjects and divided by the number of subjects to generate probabilistic population fiber tracks.
RESULTS
fMRI
Results are presented for 16 subjects. Data for one subject were excluded from further analysis based on self‐reported difficulty staying awake and completing the task, which was confirmed by the absence of suprathreshold activity for either contrast in the temporal lobes. Peak MNI coordinates for activation clusters above threshold (P < 0.001, uncorrected) with a minimum extent of 20 mm3 are reported in Table I. Figures 3 and 4 illustrate group results for the spatial hearing and the sensory‐motor contrasts, respectively. Individual peak MNI coordinates with a 2 mm radius sphere surrounding the peak are shown for each subject for both contrasts in Figure 5. Overlap for the two contrasts at a liberal threshold (P < 0.001, uncorrected) is observed in only four subjects, with none showing identical distributions for both contrasts. Group results for the mixed‐effects meta‐analysis comparing the two contrasts of interest are comparable to the conjunction analysis for the two contrasts (Supporting Information Fig. 1). In particular, in Spt the difference between listen‐repeat and listen‐rest is significantly greater than the difference between moving‐noise and stationary noise; the reverse holds in the more anterior region.
Table I.
Peak MNI coordinates
| Brain region | x | y | z | Extent (mm3) | P value, uncorrected | Max T |
|---|---|---|---|---|---|---|
| Sensory motor integration contrast | ||||||
| Left hemisphere | ||||||
| Inferior frontal gyrus (and surrounding tissue) | −58 | 6 | 20 | 27,142 | <0.0001 | 10.98 |
| Cingulate gyrus | −7 | 8 | 37 | 7,805 | <0.0001 | 9.62 |
| Spta | −55 | −42 | 30 | 1,200 | <0.0001 | 6.22 |
| Inferior parietal lobe (dorsal) | −41 | −44 | 57 | 294 | <0.0001 | 5.39 |
| Inferior prefrontal gyrus | −31 | 30 | 0 | 148 | 0.00026 | 4.74 |
| Middle frontal gyrus | −53 | 32 | 17 | 84 | 0.00026 | 4.74 |
| Inferior frontal gyrus | −52 | 22 | 12 | 36 | 0.00071 | 4.24 |
| Precentral gyrus | −33 | −19 | 35 | 36 | 0.00057 | 4.35 |
| Lentiform nucleus/Putamen/Lateral globus pallidus | −21 | −13 | 7 | 36 | 0.00074 | 4.22 |
| Inferior frontal gyrus | −31 | 28 | 10 | 32 | 0.00023 | 4.81 |
| STG | −50 | −34 | 12 | 28 | 0.00035 | 4.59 |
| Precentral gyrus | −37 | −9 | 67 | 24 | 0.00066 | 4.28 |
| Anterior STG | −25 | 11 | −25 | 24 | 0.00063 | 4.30 |
| Anterior STG | −35 | 20 | −25 | 20 | 0.00046 | 4.46 |
| Right hemisphere | ||||||
| Precentral gyrus | 47 | −12 | 45 | 1,976 | <0.0001 | 7.45 |
| Anterior STG/Insula | 49 | 5 | 2 | 767 | <0.0001 | 5.64 |
| Lentiform nucleus/Putamen | 22 | 12 | 2 | 686 | <0.0001 | 5.23 |
| Precentral gyrus | 62 | 11 | 7 | 274 | <0.0001 | 6.05 |
| Lentiform nucleus/Putamen | 26 | −5 | 7 | 236 | 0.00015 | 5.02 |
| Precentral gyrus | 65 | 2 | 20 | 192 | 0.00016 | 5.00 |
| Caudate | 11 | 1 | 10 | 180 | <0.0001 | 5.34 |
| Thalamus | 14 | −18 | 10 | 160 | 0.00022 | 4.82 |
| Claustrom | 34 | −7 | 0 | 120 | 0.0002 | 4.87 |
| Lentiform nucleus/Putamen/Amygdala | 28 | −3 | −10 | 72 | 0.0004 | 4.52 |
| Precentral gyrus | 65 | 3 | 30 | 64 | 0.00046 | 4.46 |
| Thalamus | 6 | −5 | 12 | 60 | <0.0001 | 5.64 |
| Inferior parietal lobe (dorsal) | 55 | −34 | 25 | 50 | 0.00016 | 4.99 |
| Middle frontal gyrus | 2 | 42 | 20 | 40 | 0.00057 | 4.35 |
| Lentiform nucleus/Putamen | 28 | −21 | 7 | 36 | 0.00014 | 5.07 |
| STG | 61 | −27 | 12 | 24 | 0.00087 | 4.14 |
| Spatial hearing contrast | ||||||
| Left hemisphere | ||||||
| Anterior STG/Insula | −45 | −1 | −5 | 450 | <.0001 | 6.71 |
| Anterior planum temporalea | −45 | −36 | 12 | 243 | <.0001 | 5.58 |
| Insula | −29 | −27 | 15 | 128 | <.0001 | 6.06 |
| Anterior STG | −54 | −1 | −3 | 112 | <.0001 | 5.68 |
| STG | −52 | −29 | 5 | 88 | 0.0003 | 4.67 |
| Thalamus/Pulvinar | −17 | −25 | 7 | 72 | <.0001 | 5.23 |
| Precentral gyrus | −58 | 3 | 32 | 52 | <.0001 | 5.47 |
| Thalamus | −9 | −17 | 2 | 44 | 0.00011 | 5.21 |
| Insula | −47 | −11 | 12 | 28 | 0.00056 | 4.36 |
| Middle frontal gyrus | −43 | 12 | 32 | 24 | 0.00044 | 4.48 |
| Middle frontal gyrus/Superior frontal gyrus | −17 | −15 | 67 | 24 | 0.00035 | 4.59 |
| Right hemisphere | ||||||
| Inferior parietal lobe/Insula | 45 | −33 | 25 | 72 | <0.0001 | 6.12 |
| Putamen/Lentiform nucleus | 22 | 3 | 12 | 56 | 0.00018 | 4.93 |
| Anterior STG | 51 | −9 | 0 | 32 | 0.00039 | 4.54 |
| Precuneus | 12 | −60 | 30 | 20 | 0.00021 | 4.85 |
| Insula | 38 | −15 | 22 | 20 | 0.00018 | 4.93 |
Indicates ROIs in the Planum Temporale. Corresponding brain region: Spt, supramarginal gyrus; Anterior PT, STG
Figure 3.
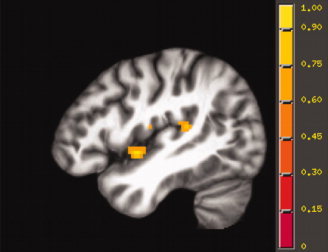
Left hemisphere activation elicited by the spatial hearing contrast, displayed on the study‐specific template in MNI space.
Figure 4.
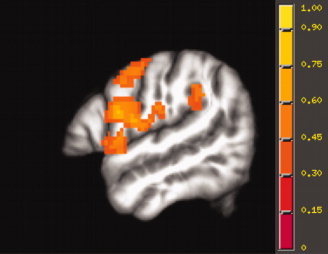
Left hemisphere activation elicited by the sensory‐motor contrast, displayed on the study‐specific template in MNI space.
Figure 5.
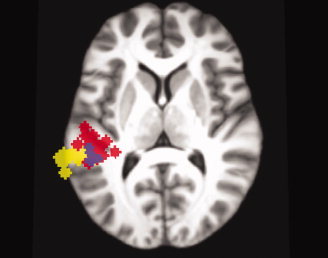
Left hemisphere activation with 2 mm sphere around peak activation for each subject are 3D rendered and displayed on an axial slice of the study‐specific template in MNI space. Spheres for the spatial hearing contrast are shown in red, the sensory‐motor integration contrast in yellow and areas where the spheres for the two contrasts overlap are shown in purple.
Activations for the spatial hearing contrast were observed in the superior temporal gyrus (STG) bilaterally, including the PT and more anterior STG. Activation was also seen in insular and subcortical regions. The sensory‐motor contrast (covert repetition − listening) activated a left lateralized network of regions involving left superior temporal gyrus (STG, Spt), inferior parietal lobe (BA 40), supramarginal gyrus, inferior and middle frontal gyrus (IFG, BA 44/45, MFG), precentral gyrus (including regions in primary motor and premotor regions, BA 4/6), cingulate gyrus (BA 32/24), insula, and several subcortical structures including the thalamus. The sensory motor contrast also activated regions in the right hemisphere, including STG, inferior parietal region (BA 40), precentral gyrus (BA 4/6), insula, several sites in the frontal cortex (IFG, MFG), and subcortical regions. The spatial hearing condition activated sites in the PT situated anterior medially to the sites activated by the sensory‐motor task as illustrated in Figure 6.
Figure 6.

PT activation for both contrasts. The sensory‐motor contrast is shown in yellow (A) and the spatial hearing contrast in red (B).
DTI
Probabilistic maps of white matter projections from each seed region are shown in Figures 7 and 8. Projections from the spatial hearing seed region project ventrally through the superior longitudinal fasciculus (SLF) and into middle temporal gyrus (MTG), as well as locally to auditory association areas. In contrast, projections from the sensory‐motor contrast project more dorsally through the SLF into the precentral gyrus, IFG and MFG. Spt also projects robustly into IPL regions and into more posterior regions in MTG as compared to the spatial hearing seed region.
Figure 7.

Probabilistic maps for both contrasts, showing 20% or greater overlap. Projections from Spt are in yellow, from the spatial hearing seed in red and the overlap is in blue. DTI data is rendered in 3D and superimposed on a 2D sagittal slice of the left hemisphere from the standard 1 mm FMRIB58 FA template in MNI space (FMRIB, Oxford. http://www.fmrib.ox.ac.uk/fsl/), as viewed from the left.
Figure 8.
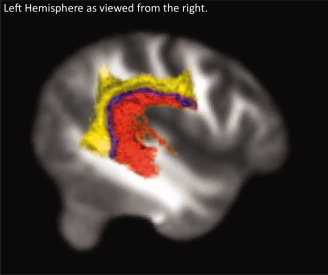
Probabilistic maps for both contrasts, showing 20% or greater overlap. Projections from Spt are in yellow, from the spatial hearing seed in red and the overlap is in blue. DTI data are rendered in 3D and superimposed on a 2D sagittal slice of the left hemisphere from the standard 1 mm FMRIB58 FA template in MNI space (FMRIB, Oxford. http://www.fmrib.ox.ac.uk/fsl/), as viewed from the right.
DISCUSSION
The current study explored the hypothesis that the PT is functionally segregated using a within subject fMRI design and functionally guided tractography. Our results provide evidence for a clear separation between regions supporting spatial‐hearing and sensory‐motor integration. Auditory motion activation elicited by moving versus stationary noise in a passive listening paradigm was observed in anterior regions of the PT, consistent with previous studies for both attended [Krumbholz et al., 2005] and unattended motion [Deouell et al., 2007]. In contrast, activation obtained for covert repetition of pseudowords versus listening to pseudowords was observed in posterior dorsal regions of the PT, area Spt, in keeping with previous findings for covert rehearsal [Buchsbaum et al., 2001; Hickok et al., 2003] and overt repetition [Peschke et al., 2009]. Current findings are the first reported activations in area Spt using a covert shadowing paradigm, which engages the auditory‐motor integration network while minimizing contributions from working memory and production‐related auditory input inherent to rehearsal and overt production paradigms, respectively. Separate spatial and sensory‐motor regions of activity were observed in the PT, even at a relatively liberal threshold for multiple comparisons (P < 0.001, uncorrected).
These functional results are supported by connectivity data from the functionally guided tractography. Using functionally defined seeds is well motivated theoretically to parcellate the white matter connectivity of distinct functional regions whose anatomic boundaries are not well delineated. However, functional activity in the gray matter when projected into surrounding white matter for tracking does not allow for the specificity that using anatomically defined white matter seeds would provide and may thus tap overlapping distributions in the close‐knit underlying white matter tract delineations, discussed below. Saur et al. 2008 noted that functionally defined seeds result in composite pathways, as opposed to tracking different anatomically distinct white matter fiber bundles. Present findings should be interpreted in this light.
The seed region in anterior medial PT for the spatial hearing contrast yielded projections through ventral portions of the SLF, while the more posterior seed, from area Spt, projected more dorsally through the SLF. A division of the SLF has been proposed in monkeys [Petrides and Pandya, 1984; Schmahmann et al., 2007], including the arcuate fasciculus (AF) and three further subsections of the SLF (I, II, and III). A similar organization in humans has been inferred and explored using in vivo tractography [Catani et al., 2005; Makris et al., 2005; Makris and Pandya, 2009]. In our present result, the spatial hearing seed seems to be projecting through AF as well as another more ventromedial pathway, the extreme capsule (EmC). Area Spt, however, appears to project to premotor cortex (BA 6) and part of Broca's area (BA 44) through portions of SLF II and III, and the AF. This is in agreement with previous findings for sensory‐motor function [Glasser and Rilling, 2008; Rilling et al., 2008; Saur et al., 2008], and corresponds well to monkey data connectivity from sensory‐motor area Tpt [Frey et al., 2008]. The functional seeds also yielded projections into different areas of the MTG, with the anterior spatial seed projecting into more anterior MTG, and the posterior sensory‐motor seed projecting into a more posterior MTG region, suggesting a functional differentiation within MTG. Projections described here are generally in good accord with several studies [Anwander et al., 2007; Catani et al., 2005; Frey et al., 2008; Glasser and Rilling 2008; Saur et al., 2008], although there is ongoing debate over the specific roles of anatomically differentiated fiber bundles (e.g., EmC, AF, and the SLF; Makris and Pandya, 2009). For present purposes, of primary importance are the differences in connectivity distributions associated with the two functionally defined seeds, which provides further support for functional subdivisions of the PT.
Results described above represent the first functionally defined connectivity for spatial hearing regions. Some authors [Makris et al., 2005; Makris and Pandya, 2009] have inferred connectivity for spatial hearing networks based on separate functional and in vivo tractography studies in humans, together with extrapolations from anatomical [Petrides and Pandya, 1988; Schmahmann and Pandya, 2006] and experimental work in monkeys [Leinonen et al., 1980]. Based on this work, it has been suggested that spatial hearing‐related regions in the PT project to frontal regions through the AF. The present finding is consistent with this hypothesis and additionally clarifies the source of these spatial hearing‐related projections, anterior PT.
Together with the functional data, results strongly suggest a heterogeneous view of PT function, with functionally distinct regions for sensory‐motor integration and processes involved in auditory spatial perception. Additional evidence that lends support for a heterogeneous model of PT function is derived from human cyctoarchitectonic data [Galaburda and Sanides, 1980] and comparative monkey data [Smiley et al., 2007], which classifies posterior PT not as unimodal auditory cortex like the anterior regions, but as an auditory‐related multisensory or transitional integration area. This anatomical division along with the functional and connectivity data detailed here, suggest at least two broad regions exist within the PT, anterior and posterior sections, each sustaining separate functions.
Although posited as a “where” stream by some, the PT has been implicated in a variety of auditory perceptual processes in addition to motion processing [Pavani et al., 2002; Warren et al., 2002], including auditory object perception [Altman et al., 2007], changes in spatial location [Smith et al., 2004, 2007], and auditory stream segregation [Smith et al., 2010; Zatorre et al., 2002]. So while sensitivity of this region to spatial information has been amply demonstrated, there is no conclusive evidence for selectivity of the PT to spatial stimuli. In fact all of the findings are consistent with the suggestion of Zatorre et al [ 2002] that the region is involved in sound source separation. Spatial cues provide important information for sound source separation [Bregman, 1990], which could explain why the anterior PT activates both during the perception of spatially changing auditory signals [Barrett and Hall, 2006; Krumbolz et al., 2005] and during perception of (non‐moving) multiple auditory streams [Smith et al., 2004, 2010]. One study [Smith et al., 2010] that factorially crossed spatial change and number of sound sources found that a spatial manipulation of a single sound source yielded no more activation in the PT than presentation of multiple sources in a single stationary location. Activation was strongest for multiple streams presented at multiple locations, without spatial change, implying particular sensitivity to the interaction of auditory spatial and object information. Results are thus consistent with the region's proposed role in auditory stream segregation, wherein spatial information contributes an important cue.
A clearer picture has emerged with regard to functionality in the posterior section of the PT. Early neuroimaging studies identified a region in posterior PT at the parietal temporal boundary which exhibits both sensory and motor response properties, area Spt [Buchsbaum et al., 2001; Hickok et al. 2003]. Specifically, activation in this region is elicited by passive listening to speech stimuli (sensory) as well as by covert production (motor). Although responsive to both, activation is greater for the combined listen‐produce conditions when sensory information is used to guide motor output, suggesting a role in auditory‐motor integration. In addition, differential patterns of activity have been demonstrated within Spt for the sensory versus sensory‐motor portions of the response profile, suggesting separate neural subpopulations in Spt may support the different components involved in sensory‐motor integration [Hickok et al., 2009]. Although much research has focused on area Spt's involvement in speech‐related processes, it does not appear to be selective for speech, as it is also responsive to the perception and covert production (humming) of tone sequences/melodies [Hickok et al., 2003; Pa and Hickok, 2008], as well as vocal singing [Brown et al., 2009; Callan et al., 2006]. This pattern of responses suggests area Spt may instead be selective for the vocal tract effector system [Pa and Hickok, 2008], comparable to parietal sensory‐motor integration areas for the eyes or hands in which sensory input is used to guide eye or hand movements (for a review see Grefkes and Fink, 2005). Functionally, activity in Spt is highly correlated with activity in pars opercularis [Buchsbaum et al., 2001] an anatomic sub‐region of Broca's area (BA 44), which is prominently involved in speech production. From an anatomical perspective, Spt's location in posterior PT, the presence of multiple cytoarchetectonic fields [Galaburda and Sanides, 1980] and strong white matter tract projections to speech production and motor regions (present study; for reviews see Friederici, 2009; Rogalsky & Hickok, 2010) point towards involvement of the posterior PT region, area Spt, in a sensory‐motor integration circuit for vocal tract related processes, including speech.
Previous proposals attempting to characterize the diverse function of the PT have suggested a common computational mechanism [Griffiths and Warren, 2002; Rauschecker and Scott, 2009] to account for the observed multifunctionality. Although this characterization accounts for available data in the field, as discussed above, much is left unclear about the internal functional organization of the PT. In contrast, results for the two contrasts of interest in the current study are congruent with previous findings and together present a strong case for heterogeneity within the PT, with a diversity of response reflecting a diversity of function.
Supporting information
Additional Supporting Information may be found in the online version of this article.
Supporting Information
Acknowledgements
Authors are grateful to the subjects who participated in this research.
L. Tugan Muftuler is currently at Department of Neurosurgery, Medical College of Wisconsin.
REFERENCES
- Altmann C, Bledowski C, Wibral M, Kaiser J ( 2007): Processing of location and pattern changes of natural sounds in the human auditory cortex. Neuroimage 35: 1192–1200. [DOI] [PubMed] [Google Scholar]
- Anderson J, Gilmore R, Roper S, Crosson B, Bauer R, Nadeau S, Beversdorf D, Cibula J, Rogish Mr, Kortencamp S, Hughes J, Gonzalez Rothi L, Heilman K ( 1999): Conduction aphasia and the arcuate fasciculus: A reexamination of the Wernicke‐Geschwind model. Brain Lang 70: 1–12. [DOI] [PubMed] [Google Scholar]
- Anwander A, Tittgemeyer M, von Cramon D, Friederici A, Knösche T ( 2007): Connectivity‐based parcellation of broca's area. Cereb Cortex 17: 816–825. [DOI] [PubMed] [Google Scholar]
- Avants B, Gee J ( 2004): Geodesic estimation for large deformation anatomical shape averaging and interpolation. Neuroimage 23 ( Suppl 1): S139–S150. [DOI] [PubMed] [Google Scholar]
- Avants B, Anderson C, Grossman M, Gee J ( 2007): Spatiotemporal normalization for longitudinal analysis of gray matter atrophy in frontotemporal dementia. Med Image Comput Comput Assist Interv 10 ( Part 2): 303–310. [DOI] [PubMed] [Google Scholar]
- Avants B, Duda J, Kim J, Zhang H, Pluta J, Gee J, Whyte J ( 2008): Multivariate analysis of structural and diffusion imaging in traumatic brain injury. Acad Radiol 15: 1360–1375. [DOI] [PMC free article] [PubMed] [Google Scholar]
- Avants B, Tustison N, Song G, Cook P, Klein A, Gee J ( 2011): A reproducible evaluation of ANTs similarity metric performance in brain image registration. Neuroimage 54:2033–2044. [DOI] [PMC free article] [PubMed] [Google Scholar]
- Avants B, Yushkevich P, Pluta J, Minkoff D, Korczykowski M, Detre J, Gee J ( 2010) The optimal template effect in hippocampus studies of diseased populations. Neuroimage 49: 2457–2466. [DOI] [PMC free article] [PubMed] [Google Scholar]
- Barrett D, Hall D ( 2006): Response preferences for “what” and “where” in human non‐primary auditory cortex. Neuroimage 32: 968–977. [DOI] [PubMed] [Google Scholar]
- Basser P, Pierpaoli C ( 1996): Microstructural and physiological features of tissues elucidated by quantitative‐diffusion‐tensor MRI. J Magn Reson B 111: 209–219. [DOI] [PubMed] [Google Scholar]
- Binder J, Frost J, Hammeke T, Bellgowan P, Springer J, Kaufman J, Possing E ( 2000): Human temporal lobe activation by speech and nonspeech sounds. Cereb Cortex 10: 512–528. [DOI] [PubMed] [Google Scholar]
- Bregman AS ( 1990): Auditory Scene Analysis: The Perceptual Organization of Sound. Cambridge, Mass.: MIT Press; xiii, 773 p. [Google Scholar]
- Brown S, Laird AR, Pfordresher PQ, Thelen SM, Turkeltaub P, Liotti M ( 2009): The somatotopy of speech: Phonation and articulation in the human motor cortex. Brain Cogn 70: 31–41. [DOI] [PMC free article] [PubMed] [Google Scholar]
- Buchsbaum B, Hickok G, Humphries C ( 2001): Role of left posterior superior temporal gyrus in phonological processing for speech perception and production. Cogn Sci 25: 663–678. [Google Scholar]
- Buchsbaum BR, Baldo J, Okada K, Berman KF, Dronkers N, D'Esposito M, Hickok G ( 2011): Conduction aphasia, sensory‐motor integration, and phonological short‐term memory—An aggregate analysis of lesion and fMRI data. Brain Lang (in press). [DOI] [PMC free article] [PubMed] [Google Scholar]
- Callan DE, Tsytsarev V, Hanakawa T, Callan AM, Katsuhara M, Fukuyama H, Turner R ( 2006): Song and speech: Brain regions involved with perception and covert production. Neuroimage 31: 1327–1342. [DOI] [PubMed] [Google Scholar]
- Catani M, Jones D, ffytche D ( 2005): Perisylvian language networks of the human brain. Ann Neurol 57: 8–16. [DOI] [PubMed] [Google Scholar]
- Chen G, Saad ZS, Cox RW ( 2010): Modeling multilevel variance components and outliers in group analysis. In: 16th Annual Meeting of the Organization for Human Brian Mapping. Barcelona, Spain, 2010.
- Cox R ( 1996): AFNI: Software for analysis and visualization of functional magnetic resonance neuroimages. Comput Biomed Res 29: 162–173. [DOI] [PubMed] [Google Scholar]
- Culham J ( 2004): Human brain imaging reveals a parietal area specialized for grasping In: Kanwisher N, Duncan J, editors. Attention and Performance: Functional Brain Imaging of Visual Cognition: Oxford: Oxford University Press; pp 417–438. [Google Scholar]
- Damasio H, Damasio A ( 1980): The anatomical basis of conduction aphasia. Brain 103: 337–350. [DOI] [PubMed] [Google Scholar]
- Deouell L, Heller A, Malach R, D'Esposito M, Knight R ( 2007): Cerebral responses to change in spatial location of unattended sounds. Neuron 55: 985–996. [DOI] [PubMed] [Google Scholar]
- Frey S, Campbell J, Pike G, Petrides M ( 2008): Dissociating the human language pathways with high angular resolution diffusion fiber tractography. J Neurosci 28: 11435–1144. [DOI] [PMC free article] [PubMed] [Google Scholar]
- Friederici A ( 2009): Pathways to language: Fiber tracts in the human brain. Trends Cogn Sci 13: 175–181. [DOI] [PubMed] [Google Scholar]
- Galaburda A, Sanides F ( 1980): Cytoarchitectonic organization of the human auditory cortex. J Comp Neurol 190: 597–610. [DOI] [PubMed] [Google Scholar]
- Glasser M, Rilling J ( 2008): DTI tractography of the human brain's language pathways. Cereb Cortex 18: 2471–2482. [DOI] [PubMed] [Google Scholar]
- Graves W, Grabowski T, Mehta S, Gordon J ( 2007): A neural signature of phonological access: Distinguishing the effects of word frequency from familiarity and length in overt picture naming. J Cogn Neurosci 19: 617–631. [DOI] [PubMed] [Google Scholar]
- Grefkes C, Fink G ( 2005): The functional organization of the intraparietal sulcus in humans and monkeys. J Anat 207: 3–17. [DOI] [PMC free article] [PubMed] [Google Scholar]
- Grefkes C, Ritzl A, Zilles K, Fink G ( 2004): Human medial intraparietal cortex subserves visuomotor coordinate transformation. Neuroimage 23: 1494–1506. [DOI] [PubMed] [Google Scholar]
- Griffiths T, Warren J ( 2002): The planum temporale as a computational hub. Trends Neurosci 25: 348–353. [DOI] [PubMed] [Google Scholar]
- Hickok G ( 2009): The functional neuroanatomy of language. Phys Life Rev 6: 121–143. [DOI] [PMC free article] [PubMed] [Google Scholar]
- Hickok G, Poeppel D ( 2000): Towards a functional neuroanatomy of speech perception. Trends Cogn Sci 4: 131–138. [DOI] [PubMed] [Google Scholar]
- Hickok G, Poeppel D ( 2004): Dorsal and ventral streams: A framework for understanding aspects of the functional anatomy of language. Cognition 92: 67–99. [DOI] [PubMed] [Google Scholar]
- Hickok G, Poeppel D ( 2007): The cortical organization of speech processing. Nat Rev Neurosci 8: 393–402. [DOI] [PubMed] [Google Scholar]
- Hickok G, Buchsbaum B, Humphries C, Muftuler T ( 2003): Auditory‐motor interaction revealed by fMRI: Speech, music, and working memory in area Spt. J Cogn Neurosci 15: 673–682. [DOI] [PubMed] [Google Scholar]
- Hickok G, Okada K, Serences J ( 2009): Area Spt in the human planum temporale supports sensory‐motor integration for speech processing. J Neurophysiol 101: 2725–2732. [DOI] [PubMed] [Google Scholar]
- Jäncke L, Wüstenberg T, Scheich H, Heinze H ( 2002): Phonetic perception and the temporal cortex. Neuroimage 15: 733–746. [DOI] [PubMed] [Google Scholar]
- Jiang H, van Zijl P, Kim J, Pearlson G, Mori S ( 2006): DtiStudio: resource program for diffusion tensor computation and fiber bundle tracking. Comput Methods Programs Biomed 81: 106–116. [DOI] [PubMed] [Google Scholar]
- Klein A, Andersson J, Ardekani B, Ashburner J, Avants B, Chiang M, Christensen G, Collins D, Gee J, Hellier P, Song J, Jenkinson M, Lepage C, Rueckert D, Thompson P, Vercauteren T, Woods R, Mann J, Parsey R ( 2009): Evaluation of 14 nonlinear deformation algorithms applied to human brain MRI registration. Neuroimage 46: 786–802. [DOI] [PMC free article] [PubMed] [Google Scholar]
- Klein A, Ghosh S, Avants B, Yeo B, Fischl B, Ardekani B, Gee J, Mann J, Parsey R ( 2010): Evaluation of volume‐based and surface‐based brain image registration methods. Neuroimage 51: 214–220. [DOI] [PMC free article] [PubMed] [Google Scholar]
- Krumbholz K, Schönwiesner M, Rübsamen R, Zilles K, Fink G, von Cramon D ( 2005): Hierarchical processing of sound location and motion in the human brainstem and planum temporale. Eur J Neurosci 21: 230–238. [DOI] [PubMed] [Google Scholar]
- Leinonen L, Hyvärinen J, Sovijärvi A ( 1980): Functional properties of neurons in the temporo‐parietal association cortex of awake monkey. Exp Brain Res 39: 203–215. [DOI] [PubMed] [Google Scholar]
- Makris N, Pandya D ( 2009): The extreme capsule in humans and rethinking of the language circuitry. Brain Struct Funct 213: 343–358. [DOI] [PMC free article] [PubMed] [Google Scholar]
- Makris N, Kennedy D, McInerney S, Sorensen A, Wang R, Caviness VJ, Pandya D ( 2005): Segmentation of subcomponents within the superior longitudinal fascicle in humans: A quantitative, in vivo, DT‐MRI study. Cereb Cortex 15: 854–869. [DOI] [PubMed] [Google Scholar]
- Meyer M, Zaehle T, Gountouna V, Barron A, Jancke L, Turk A ( 2005): Spectro‐temporal processing during speech perception involves left posterior auditory cortex. Neuroreport 16: 1985–1989. [DOI] [PubMed] [Google Scholar]
- Mori S, Crain B, Chacko V, van Zijl P ( 1999): Three‐dimensional tracking of axonal projections in the brain by magnetic resonance imaging. Ann Neurol 45: 265–269. [DOI] [PubMed] [Google Scholar]
- Pa J, Hickok G ( 2008): A parietal‐temporal sensory‐motor integration area for the human vocal tract: Evidence from an fMRI study of skilled musicians. Neuropsychologia 46: 362–368. [DOI] [PMC free article] [PubMed] [Google Scholar]
- Pavani F, Macaluso E, Warren J, Driver J, Griffiths T ( 2002): A common cortical substrate activated by horizontal and vertical sound movement in the human brain. Curr Biol 12: 1584–1590. [DOI] [PubMed] [Google Scholar]
- Peschke C, Ziegler W, Kappes J, Baumgaertner A ( 2009): Auditory‐motor integration during fast repetition: The neuronal correlates of shadowing. Neuroimage 47: 392–402. [DOI] [PubMed] [Google Scholar]
- Petrides M, Pandya D ( 1984): Projections to the frontal cortex from the posterior parietal region in the rhesus monkey. J Comp Neurol 228: 105–116. [DOI] [PubMed] [Google Scholar]
- Petrides M, Pandya D ( 1988): Association fiber pathways to the frontal cortex from the superior temporal region in the rhesus monkey. J Comp Neurol 273: 52–66. [DOI] [PubMed] [Google Scholar]
- Rauschecker J ( 1998): Parallel processing in the auditory cortex of primates. Audiol Neurootol 3: 86–103. [DOI] [PubMed] [Google Scholar]
- Rauschecker J, Scott S ( 2009): Maps and streams in the auditory cortex: nonhuman primates illuminate human speech processing. Nat Neurosci 12: 718–724. [DOI] [PMC free article] [PubMed] [Google Scholar]
- Rilling J, Glasser M, Preuss T, Ma X, Zhao T, Hu X, Behrens T ( 2008): The evolution of the arcuate fasciculus revealed with comparative DTI. Nat Neurosci 11: 426–428. [DOI] [PubMed] [Google Scholar]
- Rogalsky C, Hickok G ( 2010): The role of Broca's area in sentence comprehension. J Cogn Neurosci. [DOI] [PubMed] [Google Scholar]
- Saur D, Kreher B, Schnell S, Kümmerer D, Kellmeyer P, Vry M, Umarova R, Musso M, Glauche V, Abel S, Huber W, Rijntjes M, Hennig J, Weiller C ( 2008): Ventral and dorsal pathways for language. Proc Natl Acad Sci USA 105: 18035–18040. [DOI] [PMC free article] [PubMed] [Google Scholar]
- Schlaug G, Jäncke L, Huang Y, Steinmetz H ( 1995): In vivo evidence of structural brain asymmetry in musicians. Science 267: 699–701. [DOI] [PubMed] [Google Scholar]
- Schmahmann JD, Pandya DN ( 2006): Fiber Pathways of the Brain. Oxford; New York: Oxford University Press; xviii, 654 p. [Google Scholar]
- Schmahmann J, Pandya D, Wang R, Dai G, D'Arceuil H, de Crespigny A, Wedeen V ( 2007): Association fibre pathways of the brain: parallel observations from diffusion spectrum imaging and autoradiography. Brain 130 ( Part 3): 630–653. [DOI] [PubMed] [Google Scholar]
- Singh M, Jeong J, Hwang D, Sungkarat W, Gruen P ( 2010): Novel diffusion tensor imaging methodology to detect and quantify injured regions and affected brain pathways in traumatic brain injury. Magn Reson Imaging 28: 22–40. [DOI] [PMC free article] [PubMed] [Google Scholar]
- Smiley J, Hackett T, Ulbert I, Karmas G, Lakatos P, Javitt D, Schroeder C ( 2007): Multisensory convergence in auditory cortex. I. Cortical connections of the caudal superior temporal plane in macaque monkeys. J Comp Neurol 502: 894–923. [DOI] [PubMed] [Google Scholar]
- Smith K, Okada K, Saberi K, Hickok G ( 2004): Human cortical auditory motion areas are not motion selective. Neuroreport 15: 1523–1526. [DOI] [PubMed] [Google Scholar]
- Smith K, Saberi K, Hickok G ( 2007): An event‐related fMRI study of auditory motion perception: No evidence for a specialized cortical system. Brain Res 1150: 94–99. [DOI] [PubMed] [Google Scholar]
- Smith K, Hsieh I, Saberi K, Hickok G ( 2010): Auditory spatial and object processing in the human planum temporale: No evidence for selectivity. J Cogn Neurosci 22: 632–639. [DOI] [PubMed] [Google Scholar]
- Warren J, Griffiths T ( 2003): Distinct mechanisms for processing spatial sequences and pitch sequences in the human auditory brain. J Neurosci 23: 5799–5804. [DOI] [PMC free article] [PubMed] [Google Scholar]
- Warren J, Zielinski B, Green G, Rauschecker J, Griffiths T ( 2002): Perception of sound‐source motion by the human brain. Neuron 34: 139–148. [DOI] [PubMed] [Google Scholar]
- Warren J, Wise R, Warren J ( 2005): Sounds do‐able: Auditory‐motor transformations and the posterior temporal plane. Trends Neurosci 28: 636–643. [DOI] [PubMed] [Google Scholar]
- Wise R, Scott S, Blank S, Mummery C, Murphy K, Warburton E. ( 2001): Separate neural subsystems within ‘Wernicke's area’. Brain 124 ( Part 1): 83–95. [DOI] [PubMed] [Google Scholar]
- Zatorre R, Bouffard M, Ahad P, Belin P ( 2002): Where is ‘where’ in the human auditory cortex? Nat Neurosci 5: 905–909. [DOI] [PubMed] [Google Scholar]
Associated Data
This section collects any data citations, data availability statements, or supplementary materials included in this article.
Supplementary Materials
Additional Supporting Information may be found in the online version of this article.
Supporting Information