

Abstract
Although inhaled glucocorticoids, or corticosteroids (ICS), are generally effective in asthma, understanding their anti‐inflammatory actions in vivo remains incomplete. To characterize glucocorticoid‐induced modulation of gene expression in the human airways, we performed a randomized placebo‐controlled crossover study in healthy male volunteers. Six hours after placebo or budesonide inhalation, whole blood, bronchial brushings, and endobronchial biopsies were collected. Microarray analysis of biopsy RNA, using stringent (≥2‐fold, 5% false discovery rate) or less stringent (≥1.25‐fold, P ≤ 0.05) criteria, identified 46 and 588 budesonide‐induced genes, respectively. Approximately two third of these genes are transcriptional regulators (KLF9, PER1, TSC22D3, ZBTB16), receptors (CD163, CNR1, CXCR4, LIFR, TLR2), or signaling genes (DUSP1, NFKBIA, RGS1, RGS2, ZFP36). Listed genes were qPCR verified. Expression of anti‐inflammatory and other potentially beneficial genes is therefore confirmed and consistent with gene ontology (GO) terms for negative regulation of transcription and gene expression. However, GO terms for transcription, signaling, metabolism, proliferation, inflammatory responses, and cell movement were also associated with the budesonide‐induced genes. The most enriched functional cluster indicates positive regulation of proliferation, locomotion, movement, and migration. Moreover, comparison with the budesonide‐induced expression profile in primary human airway epithelial cells shows considerable cell type specificity. In conclusion, increased expression of multiple genes, including the transcriptional repressor, ZBTB16, that reduce inflammatory signaling and gene expression, occurs in the airways and blood and may contribute to the therapeutic efficacy of ICS. This provides a previously lacking insight into the in vivo effects of ICS and should promote strategies to improve glucocorticoid efficacy in inflammatory diseases.
Keywords: Anti‐inflammatory, asthma, corticosteroid, gene expression, transactivation
Abbreviations
- AP‐1
activator protein 1
- ASM
airway smooth muscle
- DAVID
database for annotation, visualization, and integrated discovery
- FBS
fetal bovine serum
- FDR
false discovery rate
- GAGE
generally applicable gene‐set enrichment for pathway analysis
- GO
gene ontology
- GPCR
G‐protein coupled receptor
- GR
glucocorticoid receptor
- HBE
human bronchial epithelial
- ICS
inhaled corticosteroid
- KEGG
kyoto encyclopedia of genes and genomes
- NF‐κB
nuclear factor κB
- PBS
phosphate buffered saline
Introduction
Inhaled glucocorticoids (ICSs), more correctly referred to as glucocorticoids, continue to be the pharmacotherapeutic cornerstone for the treatment of asthma (Bateman et al. 2008). Acting on the glucocorticoid receptor (GR; Gene symbol: NR3C1), these drugs reduce inflammatory gene expression to attenuate airway inflammation. With increasing disease severity, treatment intensity is stepped up, initially increasing the ICS dose, then by adding long‐acting β 2‐adrenoceptor agonists, or ultimately oral glucocorticoids. This increases the risk of adverse effects, including diabetes, hypertension, myopathies, and osteoporosis (Schacke et al. 2002). As such effects are GR dependent, a mandate for pharma has been to develop GR ligands that dissociate unwanted effects from clinically beneficial anti‐inflammatory effects (Uings and Farrow 2005). However, an ongoing lack of clarity as to the key molecular mechanisms driving the therapeutic effectiveness of existing glucocorticoid therapies hampers rational efforts to develop improved GR ligands for inflammatory diseases (Newton and Holden 2007; Newton et al. 2010; Clark and Belvisi 2012).
There are many transcriptionally induced (transactivated) effector genes contributing to the adverse effects of glucocorticoids, and this has previously supported the premise that GR transactivation is clinically undesirable (Schacke et al. 2002). Conversely, the paradigm has held that the anti‐inflammatory effects of glucocorticoids involve repressing inflammatory gene expression. One mechanism for this may involve direct GR interaction with, and reduction in the activity of transcription factors, such as NF‐κB or AP‐1 that drive inflammatory gene expression (De Bosscher et al. 2003). This effect is referred to as transrepression, and drug screening strategies have sought to maximize GR transrepression of NF‐κB/activator protein 1 (AP‐1), to enhance anti‐inflammatory benefits, while minimizing transactivation, to reduce the risk of adverse effects (Uings and Farrow 2005). A further form of transrepression also occurs when GR binds cis‐acting DNA elements to inhibit gene transcription (Surjit et al. 2011). However, direct repression of inflammatory gene transcription is often insufficient to explain the repression of inflammatory gene expression, in part, as this may also involve posttranscriptional and translational repression, but also as GR transactivation is strongly implicated in repression (Newton 2000; Stellato 2004; Clark and Belvisi 2012). Indeed, in vitro glucocorticoids induce the expression of numerous genes that reduce inflammatory signaling and gene expression (Newton and Holden 2007). Furthermore, the repression of inflammatory gene expression occurring via GR transactivation is likely to operate concurrently with transrepression (King et al. 2013).
Although expression of TSC22D3, a glucocorticoid‐inducible gene that reduces NF‐κB and AP‐1 activity (Ayroldi and Riccardi 2009), is increased in mild asthmatics taking inhaled budesonide (Kelly et al. 2012), therapeutically relevant evidence of in vivo transactivation is sparse. We therefore addressed this key knowledge gap by performing a prospective, randomized placebo‐controlled, double‐blind, crossover study in which gene expression was examined in bronchial biopsies collected 6 h following a single dose (1600 μg) of inhaled budesonide. This represents the top of the dose–response relationship for inhaled budesonide (Masoli et al. 2004), is the highest dose clinically administered to more severe asthmatics (Masoli et al. 2004) (Global Initiative for Asthma (GINA); 2016 Pocket Guide for Asthma Management and Prevention (http://ginasthma.org/2016-pocket-guide-for-asthma-management-and-prevention/), and was selected to maximize identification of ICS‐induced gene expression. Importantly, expression of glucocorticoid‐induced gene expression occurs rapidly, with peaks in gene expression often observed within 1–8 h of glucocorticoid treatment (Chivers et al. 2006; Kaur et al. 2008a; Reddy et al. 2009; Chinenov et al. 2014). This also coincides with GR transactivation‐dependent repression of numerous inflammatory genes being most strongly implicated at 6 h (King et al. 2013). Thus, in this study, 6 h posttreatment was selected as the endpoint to test for ICS‐induced gene expression in vivo. The resultant data represent a comprehensive molecular characterization of the acute response of normal individuals to ICS therapy. We unequivocally confirm increased expression of anti‐inflammatory/bronchoprotective genes in the human airways following ICS dosing. This provides a platform to interrogate functional roles of glucocorticoid‐induced genes in the context of inflammatory airway disease where glucocorticoid function(s) may be modified, or even lost.
Materials and Methods
Nomenclature
With the exception of the glucocorticoid receptor (GR, gene symbol NR3C1), all genes are described using human genome nomenclature committee (HGNC) symbols. Those subjected to PCR validation are listed with common symbols and brief descriptions (Table S1).
Study design and subjects
Twelve healthy nonsmoking, nonallergic male volunteers (age 18–50 years) with normal lung function were recruited into this prospective, double‐blind, randomized, placebo‐controlled, two‐period crossover study. The study design involved an initial screening visit, followed by two intervention visits, separated by a 2–3 weeks washout period (Fig. S1). The study protocol and consent form were approved by the Conjoint Health Research Ethics Board at the University of Calgary and Alberta Health Services. Participants provided written informed consent and were then screened (visit 1) for fulfillment of the study eligibility criteria (Table 1). At visit 2, study participants were randomized to receive either a single dose of inhaled budesonide (1600 μg) or inhaled placebo, both delivered via a Turbuhaler® device. Randomization was performed by using computer‐generated randomization codes, which were maintained by a research pharmacist at the University of Calgary who was independent of the study. Following a washout period of 2–3 weeks, participants received, at visit 3, either inhaled budesonide or placebo, as appropriate to complete both study arms. Treatment allocations were concealed from the participants and the study investigators for the duration of the study, and for all downstream analyses (except downstream analysis of microarray data). Study Turbuhalers® were independently packaged and labeled by the hospital research pharmacy, and placebo Turbuhalers® were identical in appearance and labeling to budesonide Turbuhalers® (Pulmicort Turbuhaler®, 400 μg/dose), both supplied by AstraZeneca (AstraZeneca Canada Inc., Mississauga, Ontario).
Table 1.
Eligibility criteria for inclusion of healthy volunteers
| Nonsmoker men aged 18–50 who are not on ICS or other glucocorticoid containing medications |
| Negative skin prick test to common aero‐allergens |
| Normal lung function (FEV1/FVC ≥ 0.7, FEV1 ≥80%) |
| Normal airway responsiveness (PC20 methacholine >16 mg/mL) |
| No exposure to glucocorticoids in the preceding 3 months |
| No participation in any other drug study in the preceding 4 weeks |
| No morbidity where bronchoscopy is a contraindication |
Visit 1 – Screening
Patient demography and clinical history were documented to avoid confounding medication usage and to exclude individuals with potential risk factors for bronchoscopy. Following a physical examination, volunteers underwent allergy skin prick testing (Omega laboratories ltd, Montreal, Quebec) against a panel of common aero‐allergens (cat hair, dog epithelium, horse epithelium, grass mix, trees, weeds, ragweed, and house dust mite) and histamine as positive control. Reactions were considered positive when the wheal and flare produced was ≥2 mm in diameter greater than negative control. Lung function and methacholine provocation were all performed according to in‐house standard operating procedures. To ensure normal lung function and to exclude preexisting asthma and/or other lung conditions, spirometry was performed according to American Thoracic Society/European Respiratory Society Task Force Standardisation of Lung Function Testing criteria (Miller et al. 2005). The methacholine inhalation challenge was performed using the tidal‐breathing method described by Cockcroft and colleagues (Cockcroft et al. 1977). Lung function (FEV1 as % predicted and FEV1/FVC) for all volunteers was in a range that is clinically considered to be normal (Table S2). No study participants had a positive allergy skin prick test and methacholine responsiveness was normal for all participants.
Visits 2 and 3 – Procedures
Placebo or budesonide (1600 μg) was administered to study participants via Turbuhaler® under direct observation of the research study coordinator. After 6 h, venous blood was collected into PAXgene tubes (Qiagen, Valencia, CA) and participants underwent research fibreoptic bronchoscopy under conscious sedation. During the procedure, bronchial brushings were obtained from the second‐ or third‐generation airways of the right lung using cytology brushes (Cat #4204, PriMed Canada Inc, Calgary, Alberta). Brushed cells, which are reported to be >90% epithelial cells (Woodruff et al. 2007), were recovered in: (1) sterile phosphate buffered saline (PBS), and (2) bronchial epithelial cell culture medium. Cells in PBS were centrifuged prior to resuspending in lysis buffer RLT (RNeasy kit, Qiagen) for later RNA extraction. Cells from four donors were subjected to cytospin analysis and differential cell counts performed. This confirmed that >90% were bronchial epithelial cells (Fig. S3). Cells recovered in bronchial epithelial cell medium were cultured according to a previously described method (Donnelly and Barnes 2001). Following the bronchial brushings, endobronchial mucosal biopsies (3–5 from each subject) were taken from the segmental and subsegmental bifurcations of the right lung, starting distally and working proximally. At the second bronchoscopy, brushings and endobronchial mucosal biopsies were taken from the left lung, using the same approaches. In each case, one or two biopsies were placed in Tissue Tek OCT (Sakura Finetek, Torrance, CA) for later fixing and histological examination. The remaining biopsies were snap frozen in liquid nitrogen, prior to storage at −80°C for later RNA extraction. All biopsy samples were inspected to confirm the presence of airway tissues.
Histology
Formalin‐fixed biopsy tissues were processed into paraffin blocks, and 3‐mm‐thick serial sections were cut and stained with hematoxylin and eosin staining according to standard protocols. All samples were inspected by an anatomical pathologist to determine the adequacy and general morphology of the sample, and to ensure that the airway mucosa was normal. With the exception of individual #2, who showed eosinophilic bronchitis, all individuals showed normal histology. While the findings for this individual were replicated in both biopsy samples, as lung function was normal and skin prick testing was normal, analysis of this individual was completed and the data included in the current analysis.
RNA extractions and qPCR
RNA was extracted from whole blood collected in PAXgene tubes (Qiagen) according to the manufacturer's instructions. Brushed bronchial cells, cultured human bronchial epithelial (HBE) cells, human airway smooth muscle (ASM) cells, human bronchial fibroblast cells, and human umbilical vein endothelial cells were processed for RNA according to the RNeasy protocol (Qiagen). Biopsy samples stored at −80°C were subjected to homogenization using a TissueLyser (Qiagen) and then processed for RNA according to the RNeasy protocol (Qiagen). RNA was reverse transcribed using Qscript (Quanta Biosciences, Gaithersburg, MD) and quantitative real‐time polymerase chain reaction (qPCR) conducted using Sybr GreenER chemistry (Invitrogen, Burlington, OH) according to the manufacturer's instructions. Where possible, amplification primers were designed to span an intron. In all cases, melt curve analyses were performed to confirm primer specificity and all samples for any given gene were analyzed simultaneously against a common standard curve. Relative expression for each of the test genes was normalized to that of the housekeeping gene, GAPDH.
Microarray hybridization and analysis
Total RNA was prepared from biopsy samples using the RNeasy protocol (Qiagen), as above. Resultant RNA quality was assessed using an Agilent technologies (Santa Clara, CA) 2100 Bioanalyzer using RNA 6000 nano LabChips. Total RNA from biopsy samples (50 ng) was subjected to first and second strand synthesis using Affymetrix (Santa Clara, CA) GeneChip 3′IVT express kits, according to the manufacturer's specification. In vitro transcription was used to generate biotin‐labeled amplified RNA (aRNA). This was purified and fragmented prior to hybridization to Affymetrix PrimeView microarray chips for 16 h. Microarray chips were washed and scanned using the GeneChip Fluidics Station 450 and Scanner 3000 G7, respectively. CEL files generated by Affymetrix Expression Console software were analyzed by Partek Genomics Suite (version 6.6) (Partek Inc., St Louis, MO). Robust multiarray averaging, quantile normalization, and median polishing on logged values were performed during CEL file import. Downstream analyses were performed by one‐way analysis of variance (ANOVA) with, where stated, discrimination by Fisher's least significance difference using a false discovery rate (FDR), with step‐up, of <0.05. One set of samples (individual #9) failed to produce sufficient aRNA for hybridization and was excluded from the analysis. Microarray data are deposited with NCBI's Gene Expression Omnibus (GEO) and are accessible through GEO Series accession number GSE83233 (http://www.ncbi.nlm.nih.gov/geo/query/acc.cgi?acc=GSE83233). Where genes have multiple probe sets, only probe sets showing the greatest overall level of change were retained for subsequent analyses as this produced the best fit with experimentally derived gene expression changes obtained by real‐time PCR (Fig. S4). In downstream gene ontology (GO) analyses of microarray data, the Database for Annotation, Visualization and Integrated Discovery (DAVID) gene ID conversion tool was used to remove redundant probes sets as well as pseudogenes, noncoding RNAs and other sequences lacking annotation (Huang et al. 2009). Functional classification and functional annotation clustering of GO terms were also performed with the relevant tools within DAVID.
Pathway analysis
The Bioconductor package, generally applicable gene‐set enrichment for pathway analysis (GAGE) (Luo et al. 2009), was used to perform gene‐set enrichment using the Kyoto Encyclopedia of Genes and Genomes (KEGG) Pathways database (Kanehisa et al. 2014). Default parameters were used; in cases in which multiple probe sets were assigned to a single gene, we began by calculating the log2‐fold change in treatment versus control for the groups. The probe set with the maximum absolute log2‐fold change was chosen as the single probe set to represent the gene and the others were discarded for the purposes of GAGE analysis. P‐values are those produced by the GAGE software and calculations have been described in detail (Luo et al. 2009). Subsequently, the Bioconductor package, Pathview (Luo and Brouwer 2013), was used to generate visualizations of the KEGG pathways with nodes colored to indicate fold change increases or decreases, with the coloring reflecting the maximum log2‐fold change found in the gene set within the nodes.
Cell culture
HBE cells were cultured from the bronchial brushings, as described (Donnelly and Barnes 2001). Additionally, primary human ASM and fibroblasts were cultured from nontransplanted lungs obtained via the International Institute for the Advancement of Medicine, Jessup, PA. The donors were nonsmokers, with normal chest radiographs without any history of significant preceding respiratory disease and who died from nonrespiratory causes. Primary human umbilical vein endothelial (endothelial) cells from umbilical cords were collected at term normal deliveries each with appropriate local ethical approval according to established protocols (Wierzbicki et al. 2003; Kaur et al. 2008b). To obtain primary human bronchial fibroblasts (fibroblasts), airways were dissected free of parenchyma tissue and a portion of the airway was washed with HAMs F12 medium containing 10% fetal bovine serum (FBS), penicillin (10 U/mL), streptomycin (100 μg/mL), and fungizone (25 μg/mL) (PSF). This airway section was dissected into smaller pieces (1–5 mm) and placed into 24‐well tissue culture plates containing Dulbecco's modified Eagle medium (DMEM), 10% FBS (1 mL/well), and incubated at 37°C, 5% CO2 until fibroblast cell outgrowths occurred. The original tissue plugs were removed and the cells were removed from the wells using TryplE Select (Invitrogen) and passaged into T‐175 flasks. Cells were grown to confluence and were used at passages 2–6. Prior to treatments, cells were incubated overnight in the appropriate serum, or supplement, free medium.
Detection of serum budesonide
Blood was collected immediately prior to bronchoscopy. Serum was prepared and samples were analyzed by liquid chromatography‐tandem mass spectrometry (LC‐MS/MS) to determine budesonide concentration. The lower limit of quantitation of the assay was 0.05 nmol/L. Samples showing no detectable budesonide were assigned a value of 0.05 nmol/L. The analysis was performed by Dr Anders J. Lundqvist (AstraZeneca Gothenburg).
Statistical analysis
Relative PCR expression data for biopsies, bronchial brushings, and blood analyses are expressed as the gene of interest/GAPDH. In vitro cell data are expressed as gene of interest/GAPDH as fold of untreated. Graphical and other data are plotted as means ± SE. Statistical significance was performed on raw gene of interest/GAPDH values and assessed by Wilcoxon signed rank test or paired ANOVA (Dunn's Multiple Comparison Test) as indicated. * P ≤ 0.05, ** P ≤ 0.01, *** P ≤ 0.001.
Results
Study population
Twelve healthy nonsmoking men, mean age 31.4 ± 2.2 (SE) years, with normal spirometry, negative allergy skin prick testing, and normal airway responsiveness (methacholine PC20 >16 mg/mL) were recruited into the study (Table S2).
Effect of inhaled budesonide on gene expression in the airways
Microarray analysis of biopsy RNA collected 6 h posttreatment revealed 109 probe sets (68 genes) increased ≥2‐fold (P ≤ 0.05) and 35 probes sets (28 genes) decreased ≤50% (≤0.5‐fold, P ≤ 0.05) following budesonide inhalation (Fig. 1A; Table 2; Table S3). Applying a more stringent 5% false discovery rate (FDR) produced 46 upregulated and 10 downregulated genes (Table 2; Fig. S2) and a less stringent ≥1.25‐fold (P ≤ 0.05) criterion gave 588 induced genes (Table S4). Initial gene ontology (GO) characterization showed transcriptional control, receptors, and signaling to represent ~2/3 of the high‐ and low‐stringency–induced gene lists (Fig. 1B). Transcriptional regulators were absent from the repressed gene list.
Figure 1.
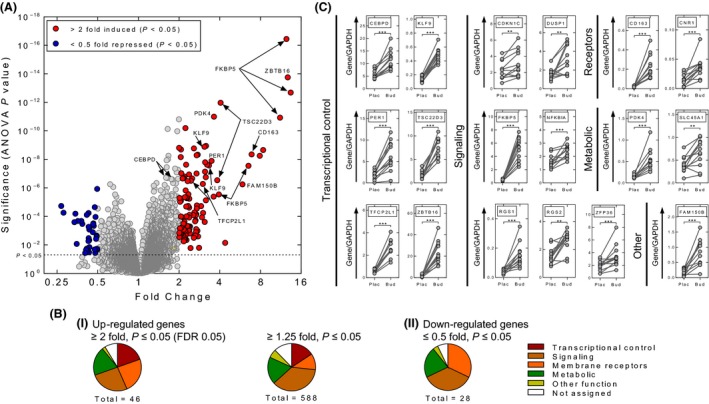
Gene expression in bronchial biopsies following budesonide inhalation. RNA was prepared from biopsy samples taken 5–6 h after placebo (Plac) or budesonide (1600 μg) (Bud) inhalation. (A) RNA was subjected to expression profiling using Affymetrix PrimeView microarrays. Analysis (n = 11 individuals) was performed with Partek Genomics Suite (v6.6). Resultant fold expression and P values were used to generate a volcano plot. Probe sets with coloring (red = 109 increased probe sets, blue = 35 repressed probe sets) indicate fold ≥2 or ≤0.5 with P ≤ 0.05. (B) i, Budesonide‐induced probe sets meeting the expression criteria; ≥2‐fold, FDR 0.05, or ≥1.25‐fold, P ≤ 0.05, were analyzed by the DAVID gene ID conversion tool to give: 46 (Table 2) and 588 upregulated genes (Table S5), respectively. ii, Budesonide‐repressed probe sets (≤0.5‐fold, P ≤ 0.05) were analyzed by the DAVID gene ID conversion tool to give 28 repressed genes (Table 2). Using gene ontology (GO) and NCBI Gene information, genes were assigned to one of six groups: 1, Transcriptional control; 2, Membrane receptors (Receptors); 3, Signaling and regulation of signaling (Signaling); 4, Metabolic and metabolism (Metabolic); 5, Other function; or 6, Not assigned, where insufficient data were available to assign a particular function or activity and were plotted as pie charts. (C) Real‐time PCR was performed for the indicated genes. Data from the 12 individuals are expressed as the gene of interest/GAPDH and are plotted (arbitrary units) as means ±SE. Significance was assessed by Wilcoxon signed rank test. ** P ≤ 0.01, *** P ≤ 0.001.
Table 2.
Genes increased by ≥2‐fold or decreased by at least 50% (≤0.5‐fold) in bronchial biopsies following budesonide inhalation
| A. Upregulated genes (≥2‐fold) | |
| Transcription factors and transcriptional control | |
| Positive regulator: | FOXO3, HIF3A, KLF9, KLF15, PER1, TFCP2L1 |
| Negative regulator: | TSC22D3, ZBTB16 |
| Other regulator: | ATAD2, JADE1 |
| (cofactors, chromatin remodeling, etc.) | |
| Receptors | |
| GPCR: | ADORA3, CNR1, CXCR4, GPR34, HCAR2/HCAR3 |
| Cytokine, growth factor, and similar: | IL7R, LIFR |
| Other membrane receptors: | CD163, CLE4E, ITGA10, MRC1, MS4A4A |
| Signaling and regulation | |
| Kinase: | CIT, ERBB4, RPS6KA2 |
| GTP binding (GTPase, GEF, GAP): | ERRFI1, RGS1, RHOBTB3 |
| Cytokine, growth factor: | CXCL13, IGF1 |
| Other: | CCND3, CELF2, CRISPLD2, FAM107A, KCNB1, FKBP5, IGFBP5, P2RX5, PHACTR3, PIK3R1, PKIB, PKP2, PLCL1, SLA, SLA2, WIPI1 |
| Metabolic and metabolism | ALOX15B, CPM, INMT, GALNT15, GMPR, GNMT, MTHFD2, MT1M, PAPPA, PDK4, SLC6A1, ST6GALNAC3, SULT1E1, SULT2B1, TPO |
| Other function | CLDN8, LCN6, NID1 |
| Not assigned | FAM150B, FAM196A, FIBIN |
| B. Downregulated genes (≤0.5‐fold) | |
| Receptors | |
| GPCRs: | APLNR, CXCR1, SIPR3 |
| Cytokine, growth factor and similar: | TNFRSF11B |
| Other membrane receptors: | CD207, FCER1A, TM4SF1, SELE, VCAM1 |
| Signaling and regulation | |
| Cytokine/chemokine, growth factor: | CCL2, CCL11, CXCL10, CXCL12, IL1RN, IL33 |
| Other: | CLCA4, S100A9, TRIL, VSNL1 |
| Metabolic and metabolism | ADH7, APOBEC3A, APOBEC3B, HAS3, MMP10, MMP13 |
| Other function | CDH6 |
| Not assigned | C15ORF48, C11ORF96 |
Probe sets meeting the expression criteria (≥2‐fold, ≤0.5‐fold, FDR 0.05) were analyzed by the DAVID gene ID conversion tool to produce 46 upregulated and 10 downregulated genes. Alternatively, probe sets meeting the criteria (≥2‐fold, ≤0.5‐fold, P ≤ 0.05) were analyzed to produce 68 upregulated and 28 downregulated genes. These additional genes are shown in italics. Genes subjected to qPCR validation are underlined. Using gene ontology (GO) and NCBI gene, genes were assigned to one of four general groups: 1, Transcription factors and transcriptional control; 2, Receptors; 3, Signaling and regulation; 4, Metabolic and metabolism; 5, Other function; or 6, Not assigned, where insufficient data were available to assign a particular function or activity. Note: HCAR2 and HCAR3 are highly homologous and are not distinguishable by the PrimeView arrays (Probe set: 11722615_s_at).
Nine genes (CDKN1C, CEBPD, DUSP1, FKBP5, NFKBIA, RGS2, SLC45A1, TSC22D3, and ZFP36), showing glucocorticoid inducibility in human epithelial cell lines (Wang et al. 2004; Chivers et al. 2006; Kaur et al. 2008a; Reddy et al. 2009), were verified by qPCR as being significantly increased in the biopsies following budesonide inhalation (Fig. 1C). Similar mRNA changes in expression of 7 of these 9 genes were also observed in bronchial brushings (93.1 ± 3.1% airway epithelial cells) (Fig. S3). Nine additional genes (all >2‐fold, Table 2) were also confirmed as budesonide‐induced in the biopsies (Fig. 1C). Whereas qPCR clearly confirms the overall robustness of the array analysis, numerous probe sets were below 2‐fold induced, yet reflected gene expression changes that were readily validated by qPCR (Table S5, Fig. S4). Indeed, of the 69 probe sets corresponding to genes that were validated by qPCR as being significantly enhanced following budesonide inhalation, 41 probes sets fell below the 2‐fold criterion (Table S5). Furthermore, 29 of these probe sets showed less than 1.5‐fold induction. Given that many genes on each PrimeView arrays are only represented by 1 or 2 probe sets, such criteria will unnecessarily exclude considerable numbers of genes that are genuinely induced by budesonide in these biopsies. Moreover, the obvious fact that genes expressed in restricted cell populations will be subjected to dilution effects means that relevant data are excluded with the twofold exclusion criterion. These issues, justify consideration of the ≥1.25 (P ≤ 0.05) induced gene list. GO analysis was therefore performed using both high (≥2‐fold, FDR 0.05) and low (≥1.25‐fold, P ≤ 0.05) stringency criteria for budesonide inducibility.
Gene ontology analysis of budesonide upregulated genes
Functional annotation clustering with the 46 budesonide‐induced (≥2‐fold, FDR 0.05) genes produced 15 clusters, with cluster one containing GO terms for cell migration and movement that are significantly associated with the list (Table S6). Clusters 2–4 contain many surface receptors and the GO terms for intracellular signaling cascades, cytokine binding, and cytokine–receptor interactions that are significantly associated with the list. Overall, membrane receptors including: Gi/o‐coupled G‐protein coupled receptors (GPCRs) (ADORA3, CNR1, CXCR4, GRP34, HCAR2/HCAR3) (Pawson et al. 2014); JAK‐STAT‐linked cytokine receptors (IL7R, LIFR); a scavenger receptor (CD163); lectin (CLE4E); and integrin (ITGA10), represent ~24% of these induced genes (Fig. 1B, Table 2). Other signaling components made up ~25% of the list (Fig. 1B). Sequence‐specific transcriptional activators (KLF9, KLF15, HIF3A, PER1), cofactor/chromatin remodeling factors (ATAD2, JADE1) and the highly induced repressors (TSC22D3, ZBTB16) associated with terms for DNA binding and transcriptional regulation (cluster 12).
Examination of the lower stringency 588 (≥1.25‐fold, P < 0.05) budesonide‐induced gene list revealed ~15% to be transcriptional regulators, >35% as signaling related, with a further 11% corresponding to membrane receptors, and ~20% having metabolic function (Fig. 1B; Table S4). The term, regulation of transcription (GO:0045449), associated with ~18% of these genes and the more restricted, but significantly enriched term, regulation of transcription from RNA polymerase II promoter (GO:0006357), corresponded to 7.6% of the list (Fig. 2A). This, along with identification of some ~90 possible transcription factors, highlights major roles for positive (GO:001626, GO:0045944) and negative (GO:0010629, GO:0016481) control of transcription by budesonide (Table S4; Fig. 2A). Likewise, 11% of the genes associate with the enriched term, intracellular signaling cascade (GO:0007242), and terms for phosphorylation, receptor and kinase cascades, response to cytokine stimulus (GO:0034097), which includes inflammatory and growth factor receptors (CALCOCO2, IL1R1, IL6R, IL6ST, INSR, LIFR, and PDGFRA), were significantly enriched (Fig. 2A). More selective terms, including cytokine/cytokine receptor interaction, regulation of kinase activity, MAPK cascades, and cytokine production also associate with these budesonide‐induced genes. Equally, budesonide‐induced genes associate with immune, defense, and inflammatory responses, regulation of immune system, and leukocyte activation (Fig. 2A). Many receptors and signaling cascades regulate cell migration and motion and/or cell cycle–related events. Indeed, up to 4.3% of the induced genes associate with enriched terms for cell motion and migration and up to 8% associate with terms for cell cycle regulation, proliferation, and/or apoptosis (Fig. 2A).
Figure 2.
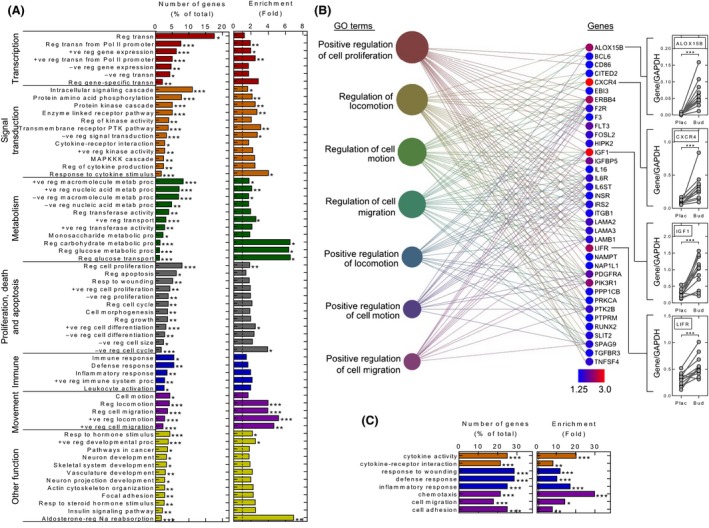
Gene Ontology (GO) analysis of biopsy microarray data. (A) GO analysis of biological process: the 588 (≥1.25‐fold, P ≤ 0.05) budesonide‐induced gene list was analyzed by DAVID functional annotation to produce gene clusters (≥2 genes/cluster) corresponding to 647 GO annotation terms. GO terms corresponding to biological process (GOTERM_BP_FAT and KEGG_PATHWAY) were extracted. Those significantly associated (P ≤ 0.05) with the gene list are plotted with the numbers of genes (as a percentage of the list total) for each term along with the fold enrichment for each term. GO terms with less than 2% of the total genes are not plotted unless significantly enriched (Benjamini ≤0.05). Many terms were excluded as being redundant or having wide meaning (Table S7). (B) Functional cluster analysis, using DAVID, of the 588 (≥1.25‐fold, P ≤ 0.05) gene list produced 183 gene clusters. The top 20 clusters are listed (Table S8). The most highly enriched cluster, containing GO terms for cell proliferation and movement, is depicted. GO terms are represented by filled circles where size is proportional to the number of genes. Individual genes are color coded to indicate expression induced by budesonide. GO terms are linked to the respective genes by lines. qPCR was performed for four genes in the biopsy samples as shown in Figure 1C. (C) The 28 budesonide‐repressed genes (≤0.5‐fold, P ≤ 0.05) (Table 2) were functionally annotated using DAVID as in A. Abbreviations are as follows: +ve, positive; ‐ve, negative, reg, regulation; proc, process; metab, metabolism; transn, transcription. A number of GO terms are further abbreviated: +ve reg nucleic acid metabolic process = GO:0045935~positive regulation of nucleobase, nucleoside, nucleotide, and nucleic acid metabolic process; +ve reg nucleic acid metabolic process = GO:0045934~negative regulation of nucleobase, nucleoside, nucleotide, and nucleic acid metabolic process; transmembrane receptor PTK pathway GO:0007169 ~transmembrane receptor protein tyrosine kinase signaling pathway; enzyme‐linked receptor pathway, GO:0007167~enzyme‐linked receptor protein signaling pathway.
Functional annotation clustering using the 588 budesonide‐induced genes produced 183 GO clusters, with the most highly enriched cluster containing terms for regulation of locomotion, movement, or migration (Table S8, Fig. 2B). ALOX15B, CXCR4 IGF1, and LIFR were highly upregulated in this cluster and their expression was confirmed by qPCR (Fig. 2B). Cluster 2 contains metallothionein genes, and clusters 3–6 further reiterate that budesonide enhances signaling and transcription. Thus, cluster 3 contains >30 kinases, including tyrosine kinases/receptor protein tyrosine kinases, whereas cluster 4 relates broadly to transcription factors and the positive regulation of gene expression. Cluster 5 includes terms for cytokine binding, cytokine receptor activity, and growth factor binding, and contains upregulated cytokine, chemokine, and growth factor receptor genes. Cluster 6 also involves regulation of phosphorylation and contains terms for protein kinase, serine/threonine kinase, and nucleotide binding. Whereas the regulation of transcription and gene expression are in cluster 7, many of these terms and genes, including CDKN1C, PER1, and ZBTB16, may negatively regulate transcription and gene expression. Thus, negative regulation of signal transduction (GO:0009968) represents 3.3% of the budesonide‐induced list, contains inhibitors of NF‐κB (NFKBIA, IRAK3), and GPCR signaling (RGS1, RGS2), and is significantly enriched.
Pathway analysis of budesonide‐modulated gene expression
To better appreciate potential ICS functions, gene array data were subjected to GAGE pathway analysis and the most up‐ and downregulated KEGG pathways are listed (Table 3). The aldosterone‐regulated sodium reabsorption pathway (hsa04960), also an enriched GO term (Fig. 2A), shows how the upregulation of IGF1, SCNN1A (a component of the epithelial cell sodium channel), SGK1, various K+ channels, the Na+/K+ ATPase, and other more modestly induced genes could collectively act to enhance sodium and fluid uptake (Fig. S5A). Likewise, the upregulation of HSD11B2, which is physiologically upregulated to convert cortisol into cortisone, and thereby prevent activation of the mineralocorticoid receptor (NR3C2), shows how an ICS could render cells refractory to later effects of endogenous glucocorticoid.
Table 3.
Pathway analysis showing top associations with budesonide‐regulated genes
| KEGG code | Pathway Name | P Value | Q Value |
|---|---|---|---|
| A. Upregulated pathways | |||
| hsa04960 | Aldosterone‐regulated sodium reabsorption | 8.44 E‐07 | 0.000138 |
| hsa00920 | Sulfur metabolism | 2.44 E‐05 | 0.00200 |
| hsa04920 | Adipocytokine signaling pathway | 0.000618 | 0.0337 |
| hsa04640 | Hematopoietic cell lineage | 0.00386 | 0.130 |
| hsa00770 | Pantothenate and CoA biosynthesis | 0.00397 | 0.130 |
| hsa04610 | Complement and coagulation cascades | 0.00611 | 0.151 |
| hsa04710 | Circadian rhythm – mammal | 0.00643 | 0.151 |
| hsa04910 | Insulin signaling pathway | 0.00761 | 0.156 |
| hsa04150 | mTOR signaling pathway | 0.0177 | 0.304 |
| hsa00532 | Glycosaminoglycan biosynthesis – chondroitin sulfate | 0.0185 | 0.304 |
| hsa03010 | Ribosome | 0.0421 | 0.615 |
| hsa00450 | Selenocompound metabolism | 0.0466 | 0.615 |
| hsa04070 | Phosphatidylinositol signaling system | 0.0487 | 0.615 |
| hsa04630 | Jak‐STAT signaling pathway | 0.0614 | 0.677 |
| B. Downregulated pathways | |||
| hsa00010 | Glycolysis/Gluconeogenesis | 1.34 E‐06 | 0.000117 |
| hsa00053 | Ascorbate and aldarate metabolism | 1.43 E‐06 | 0.000117 |
| hsa00830 | Retinol metabolism | 3.55 5E‐06 | 0.000194 |
| hsa04141 | Protein processing in endoplasmic reticulum | 1.39 E‐05 | 0.000569 |
| hsa00860 | Porphyrin and chlorophyll metabolism | 5.89 E‐05 | 0.00180 |
| hsa00040 | Pentose and glucuronate interconversions | 6.58 E‐05 | 0.00180 |
| hsa00980 | Metabolism of xenobiotics by cytochrome P450 | 0.000127 | 0.00297 |
| hsa04110 | Cell cycle | 0.000181 | 0.00356 |
| hsa00020 | Citrate cycle (TCA cycle) | 0.000195 | 0.00356 |
| hsa04142 | Lysosome | 0.000290 | 0.00476 |
| hsa00982 | Drug metabolism – cytochrome P450 | 0.000395 | 0.00589 |
| hsa00240 | Pyrimidine metabolism | 0.00100 | 0.0137 |
| hsa03050 | Proteasome | 0.00187 | 0.0236 |
| hsa00500 | Starch and sucrose metabolism | 0.00218 | 0.0255 |
The Bioconductor package, GAGE, was used to perform gene‐set enrichment using the Kyoto Encyclopedia of Genes and Genomes (KEGG) Pathway database. P‐ and Q‐values were produced by the GAGE software. The Bioconductor package, Pathview, was used to generate visualizations of the KEGG pathways (Fig.S5).
Similarly, many cytokine/chemokine, growth factor, complement, and coagulation pathways were significantly upregulated. These are generally consistent with the GO analysis and suggest a widespread ICS‐dependent upregulation of signaling. Thus, the adipocytokine signaling pathway and the hematopoietic cell lineage are ranked third and fourth most upregulated pathways, respectively. Both pathways show roles for type I cytokine receptors that activate JAK‐STAT signaling (Fig.S5B and C). Thus, both the IL7R (CD127 in KEGG) and LIFR were both induced by more than twofold (Table 2). Likewise, both chains of the IL6 receptor, IL6R (CD126) and IL6ST (GP130), as well as the α chain, CSF2RA (CD116), for CSF2 (GM‐CSF) were significantly upregulated (Table S4). FLT3 (CD135) is a tyrosine kinase receptor that is important in hematopoetic cell development. Along with CSF1R (CD115) for CSF1 (M‐CSF), PDGFRA, TGFBR3, and GFRA1, these are all tyrosine kinase growth factor receptors that were upregulated following budesonide inhalation (Table S4). Ranking sixth most upregulated pathway (Table 3), the complement and coagulation cascades show various components being upregulated in a manner that should promote activation of these pathways (Fig. S5D). Thus, the extrinsic complement activation pathway shows upregulation of F3, F10 along with other less highly induced components that are predicted to activate thrombin, itself modestly induced, and promote activation of the protease‐activated receptor 1, F2R (Table S4). F2R is also budesonide induced and is a GPCR that signals through Gq to induce various proinflammatory effects, including smooth muscle contraction. Equally, events leading to the membrane attack complex formation and to C3AR1‐, and to a lesser extent, C5R1‐dependent responses were upregulated by budesonide inhalation (Fig.S5D).
The GAGE pathway analysis also highlights the extensive metabolic effects that are likely to occur in vivo following ICS inhalation. Upregulation of insulin, mTOR, phosphatidylinositol pathways, as well as the downregulation of multiple metabolic pathways, is consistent with GO terms for metabolism, such as regulation of carbohydrate and glucose metabolic process (GO:0006109, GO:0010906) and glucose transport (GO:0010827), being budesonide enriched (Fig. 2A). This confirms that in addition to regulating metabolic pathways, ICS upregulates multiple, inflammatory, and signaling pathways.
GO analysis of genes downregulated by inhaled budesonide
Applying a 5% FDR, 10 genes showed ≤0.5‐fold changes in expression following budesonide inhalation (Table 2). Although no validation was performed, these genes are consistent with established repressive effects. Thus, CD207, FCERIA, and SELE are a lectin, Fc fragment of the high‐affinity IgE receptor and E‐selectin, respectively. CCL2 and CXCL12 are chemokines and TRIL, or TLR4 interactor with leucine‐rich repeats, enhances TLR3 and TLR4 signaling (Carpenter et al. 2009, 2011). Equally, the matrix metalloproteases, MMP10 and 13, are repressed along with HAS3, a hyaluronan synthase that synthesizes extracellular matrix. A less stringent ≤0.5‐fold, P ≤ 0.05 criteria yields 28 genes (Fig. 1B, Table 2) mapping to 107 significantly associated GO terms (Table S7). This identified nine surface receptors/receptor family members, six cytokines/chemokines, HAS3, and the cadherin, CDH6 (Table 2). Thus, GO terms for cytokine activity, chemotaxis, cell adhesion, responses to wounding, defense response, inflammation, cytokine–cytokine receptor interaction, and cell migration associate with, and are enriched in, the budesonide‐repressed gene list (Fig. 2C).
Glucocorticoid‐induced gene expression in vitro
Given the variable cell populations in the biopsies, maximally effective concentrations of budesonide and dexamethasone were tested on structural cells in vitro as a means of further exploring the changes in gene expression that were observed in the in vivo components of the study (Chivers et al. 2004; King et al. 2009; Kelly et al. 2012). In primary human bronchial epithelial (HBE) cells, positive (CEBPD, KLF9, PER1, TFCP2L1) and negative (TSC22D3 and ZBTB16) transcriptional regulators were strongly induced by both glucocorticoids (Fig. 3A). Although NFKBIA and ZFP36 expression were modestly induced, DUSP1 and RGS2 were significantly increased. TLR2 mRNA, identified in the later HBE microarray analysis, was also significantly increased (6.5–7.0‐fold) by both glucocorticoids. In ASM and fibroblasts, the transcriptional regulators, but not TFCP2L1, were glucocorticoid induced, as were DUSP1 and NFKBIA. IGF1 and the surface receptors, CD163 and LIFR, were increased in ASM, with similar, nonsignificant, trends in fibroblasts. Whereas the metabolic genes, PDK4 and SLC45A1, were robustly induced in all the airway cells, expression of ALOX15B was substantially induced in ASM and fibroblasts. Endothelial cells produced qualitatively similar results, but with lower overall gene inducibility. FKBP5 was also robustly induced in all cell types.
Figure 3.
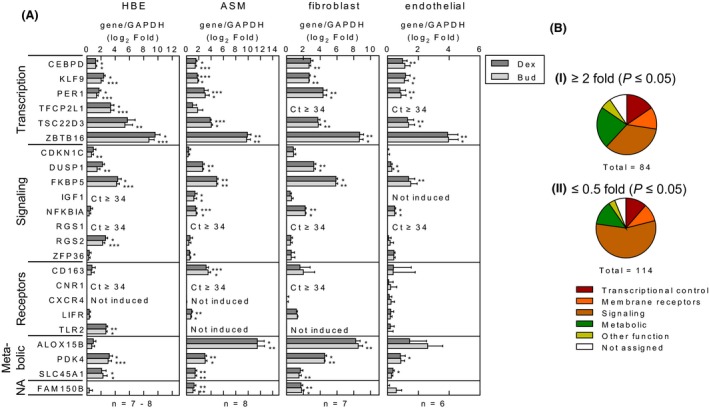
Expression of glucocorticoid‐induced genes in human cells. (A) Human bronchial epithelial (HBE) cells, airway smooth muscle (ASM) cells, lung fibroblasts, and endothelial cells were either not treated or treated with dexamethasone (1 μmol/L) (Dex) or budesonide (Bud) at 0.3 μmol/L (or 0.1 μmol/L for HBE cells). RNA was subjected to qPCR for the indicated genes and GAPDH. Where threshold cycle (CT) values were ≥34, then the gene was deemed not to be expressed. Data, n = 7–8 individuals (HBE), n = 8 individuals (ASM), n = 7 individuals (fibroblasts), n = 6 individuals (endothelial), expressed as the gene of interest/GAPDH, are plotted as log2‐fold relative to not treated as means ±SE. Significance was assessed by paired analysis of variance (ANOVA) (Dunn's Multiple Comparison Test). * P < 0.05, ** P < 0.01, *** P < 0.001. (B) Primary HBE cells from six individuals were not treated or treated with budesonide (0.1 μmol/L). RNA was prepared and microarray analysis performed using Affymetrix Primeview arrays. Analysis was performed with Partek Genomics Suite (v6.6) and resultant fold expression and P values were used to generate a volcano plot (Fig. S6). Budesonide‐induced and ‐repressed probe sets meeting the criteria; i, ≥2‐fold, P ≤ 0.05, or ii, ≤0.5‐fold, P ≤ 0.05, were analyzed by the DAVID gene ID conversion tool to give: i, 84 upregulated and ii, 114 downregulated genes, respectively (Table S10). Using gene ontology (GO) and NCBI gene information, genes were assigned to one of six groups: 1, Transcriptional control; 2, Membrane receptors (Receptors); 3, Signaling and regulation of signaling (Signaling); 4, Metabolic and metabolism (Metabolic); 5, Other function; or 6, Not assigned, where insufficient data were available to assign a particular function or activity, and were plotted as pie charts.
Using standard cut‐off criteria for induced (≥2‐fold, P < 0.05) and repressed (≤0.5‐fold, P ≤ 0.05) genes, microarray analysis of HBE cells revealed 84 upregulated and 114 downregulated genes following 6‐h budesonide treatment (Fig. S6, Table S9). Both groups showed reduced fractions involved in transcription relative to genes involved in signaling (Fig. 3B). Nevertheless, GO terms for the regulation of transcription and transcription regulator activity associated with ~20% of induced genes (Fig. S6). In the downregulated genes, there were many transcriptional regulators, but over 50% were involved in signaling (Fig. 3B). With individual GO terms relating to signal transduction representing up to 24% of the repressed list (Fig. S6), such data suggest that the downregulation of gene expression and signaling are major glucocorticoid effects on the bronchial epithelium. Indeed, terms for the regulation of transcription, gene expression, various signaling terms along with wounding, defense, immune responses, and chemotaxis were significantly enriched in the repressed gene list. Some explanation of this is apparent in the induced gene list (Table S10), which shows over 20% of genes to be involved in transcriptional regulation, and associated with terms for the negative regulation of gene expression, transcription, and signal transduction (Fig. S6). GO terms for positive and negative effects on cell proliferation, apoptosis, and motion appear in both the up‐ and downregulated gene lists.
Comparison of glucocorticoid effects in biopsies and HBE cells
The fold change obtained for all probe sets was compared between the biopsy and in vitro HBE cell culture data (Fig. 4A). Of the 109 probes sets (66 genes) induced ≥2‐fold in the biopsies and 166 induced ≥2‐fold (84 genes) in the HBE samples, there were 24 probes (12 genes) in common. Likewise, 44 probe sets (28 genes) were repressed (≤0.5‐fold) in the biopsies and 209 probe sets (181 genes) repressed (≤0.5‐fold) in the HBE cells, with only five probe sets corresponding to three genes, in common. To visualize these differences, heat maps were generated following ranking of genes according to; (1) fold change in the biopsy samples, and (2) fold change in the HBE cells (Fig. 4B). This highlights differences in expression that are likely to be functionally important between cells types present in the biopsies. For example, in contrast to the biopsies, the Gα i‐coupled GPCRs, or the Gα i‐selective RGS, RGS1, or the scavenger receptor, CD163, were not upregulated in HBE cells. Conversely, expression of genes including; TLR2, GHR, and RGS2 (a Gα q‐selective RGS) were increased in the HBE cells, but less so in the biopsies. Thus, whereas TLR2 expression increased by 6.5–7.0‐fold in HBE cells (Fig. 3A), this did not occur in ASM, fibroblasts, or endothelial cells, and may explain the relatively low, but significant, inducibility observed on the biopsy array (1.35‐fold) and by qPCR (2‐fold) (Fig. 4C).
Figure 4.
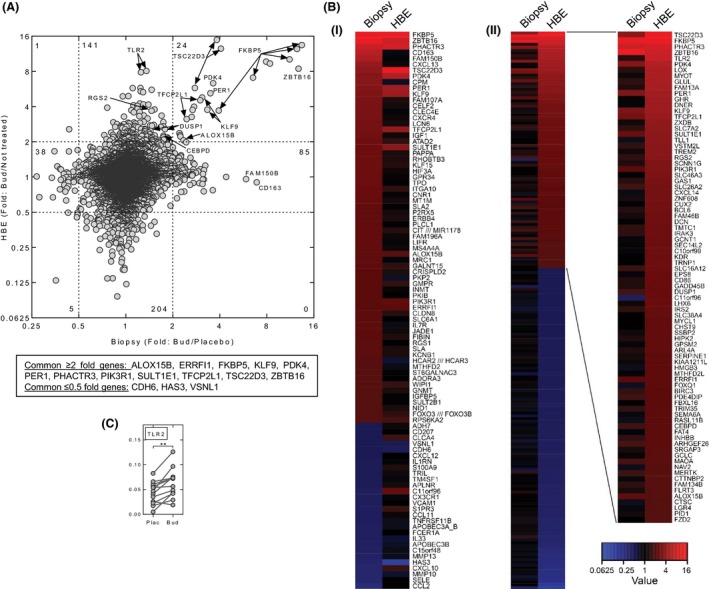
Comparison of budesonide‐modulated gene expression in bronchial biopsies with human bronchial epithelial cells in culture. (A) Fold change (budesonide/not treated) for all probe sets in human bronchial epithelial cells (HBE) treated with budesonide (Bud) (0.1 μmol/L) (data from Fig. 3B) was plotted against the fold change (budesonide/placebo) obtained with the bronchial biopsies (data from Fig. 1A). (B) Heat maps representing the data in panel A are shown for: i) genes (≥2‐fold or ≤0.5‐fold, P ≤ 0.05) ranked by fold (budesonide/placebo) in the biopsies; and for ii) genes (≥2‐fold or ≤0.5‐fold, P ≤ 0.05) by fold (budesonide/not treated) in the human bronchial epithelial cells. Genes with multiple probe sets are represented by the probe set with the greatest absolute value (modulus). Genes with probe sets showing ≥2‐fold and ≤0.5‐fold for each ranked set are shown. Repressed genes in panel ii) are listed in Table S10. (C) qPCR was performed for TLR2 in the biopsy samples as described in Figure 1C.
Budesonide‐induced gene expression in peripheral blood
Six hours following a single dose (1600 μg) of budesonide inhalation, serum budesonide levels were 1.19 ± 0.15 nmol/L (Fig. 5A). Using whole blood RNA, qPCR showed ALOX15B, CEBPD, DUSP1, FKBP5, NFKBIA, PER1, RGS2, TLR2, TSC22D3, ZBTB16, and ZFP36 to be significantly increased following budesonide inhalation (Fig. 5B).
Figure 5.
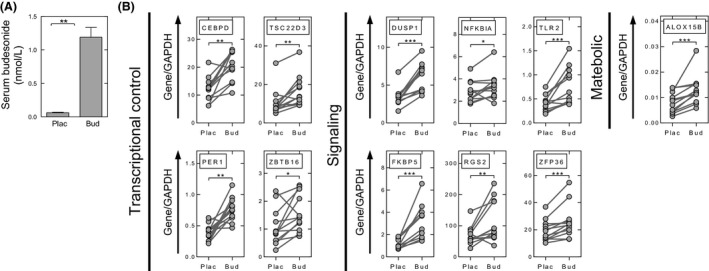
Elevated serum budesonide and budesonide‐induced gene expression in blood. (A) Blood was collected 5–6 h post placebo (Plac) or budesonide (Bud) (1600 μg) inhalation, immediately prior to bronchoscopy. Serum was prepared and samples analyzed by LC‐MS/MS to determine budesonide concentration. Data (n = 12 individuals) are plotted as mean ± SE. (B) RNA was prepared from whole blood taken 5–6 h post placebo or budesonide inhalation. Data, from all 12 individuals, are expressed as the gene of interest/GAPDH and are plotted as means ± SE. All genes investigated by qPCR in Figures 1, 2, 3 were analyzed, but only those showing significant changes are shown. Significance was assessed by Wilcoxon signed rank test. * P ≤ 0.05, ** P ≤ 0.01, *** P ≤ 0.001.
Discussion
While ICS are key anti‐inflammatory medications in managing asthma, they offer limited clinical efficacy in patients with mixed granulocytic or neutrophilic inflammatory phenotypes, such as asthmatic smokers or in asthmatic subjects who experience viral‐induced exacerbations (Newton et al. 2010). Despite this, a molecular understanding of anti‐inflammatory glucocorticoid action and the contributions of GR transactivation and transrepression remain unclear. Nevertheless, transrepression cannot account for posttranscriptional, translational, or posttranslational repression, events in which GR transactivation is implicated (Newton 2000; Clark and Belvisi 2012). However, whereas glucocorticoids clearly induce expression of many anti‐inflammatory/antiasthma genes in vitro (Newton and Holden 2007; Newton et al. 2010), robust in vivo evidence has to date been limited. This study confirms upregulation of numerous genes capable of reducing inflammatory responses in the human airways and in peripheral blood by a high, but clinically relevant dose of inhaled budesonide. Thus, the therapeutics effects of ICS may be manifest not only in the airways, but also in inflammatory cells while still in the blood. For example, NFKBIA, the cytoplasmic NF‐κB inhibitor, TSC22D3, which inhibits NF‐κB and AP‐1, ZFP36, a mRNA destabilizing protein, and DUSP1, the MAPK phosphatase are significantly upregulated and may each reduce inflammatory gene expression (Newton and Holden 2007; Clark et al. 2008; Ayroldi and Riccardi 2009; Brooks and Blackshear 2013; Newton 2014). Likewise, RGS2, a bronchoprotective gene that reduces signaling from proasthma, Gα q‐linked, GPCRs (Holden et al. 2011, 2014; Xie et al. 2012), is induced by inhaled budesonide. Similarly, in the airways numerous other inhaled budesonide‐induced genes show anti‐inflammatory potential: CRISPLD2 represses IL6 and IL8 expression (Himes et al. 2014); IRAK3 is a glucocorticoid‐induced inhibitor of signaling to NF‐κB (Miyata et al. 2015); and the GTPase‐activating protein, RGS1, reduces T‐cell chemotaxis (Gibbons et al. 2011). In addition, other GTPase‐activating proteins, for example, ERRFI1, which impairs EGF signaling and may protect from osteoarthritis (Zhang and Vande Woude 2007; Staal et al. 2014), were budesonide induced. Thus, multiple repressive effects may be promoted and this is consistent with GO terms for negative regulation of transcription and gene expression being significant features of ICS inhalation. In addition, the transcriptional repressor, ZBTB16, which reduces inflammatory gene expression (Sadler et al. 2015), was significantly and robustly induced in the biopsies and was generally the most highly induced gene tested in vitro. Related repressor genes, including ZBTB8A, ZBTB20, and BCL6, were also upregulated by inhaled budesonide, suggesting novel mechanisms for ICS‐induced repression of inflammatory gene expression.
Genes involved in transcriptional control are prominent among the budesonide‐induced genes. While many are repressors, a greater number positively regulate transcription. Thus, transcription factors, such as KLF9, PER1, CEBPD, and TFCP2L1, as well as KLF15 and HIF3A, and potentially >50 less highly expressed transcriptional activators in this study, indicate extensive budesonide‐induced transcriptional activation. Although this is consistent with key roles for factors, such as KLF9 and KLF15 (Sasse et al. 2013; Chinenov et al. 2014), causal relationships between glucocorticoid‐induced transcription factors and downstream targets remain largely uncharacterized.
This analysis reveals the extent to which ICS induces the expression of signaling genes. Although many (DUSP1, IRAK3, NFKBIA, etc.) play roles in repressing inflammatory processes, a great number of ICS‐induced genes appear to be proinflammatory. Indeed, growth factors, chemokines, receptors for chemokines, cytokines, growth factors, and other mediators were all budesonide enhanced. This finding provides strong support for an in vitro analysis of human peripheral blood mononuclear cells in which dexamethasone upregulated many genes involved in complement activation, as well and innate immune and other proinflammatory responses (Galon et al. 2002). Likewise, genes for kinases, GTPases, and positive regulators of signaling are upregulated. Thus, budesonide upregulates numerous signaling pathways, a concept that is illustrated by the GAGE pathway analysis (Table 3; Fig. S5). For example, sodium absorption involves serum/glucocorticoid‐induced kinase (SGK1), the epithelial sodium channel and, along with changes to carbohydrate metabolism, these are major features of glucocorticoid action (Schacke et al. 2002). However, GO terms for immune and inflammatory responses are also associated with the budesonide‐induced gene list and indeed glucocorticoids can clearly enhance innate immune responses (Galon et al. 2002; Zhang et al. 2007; van de Garde et al. 2014). Possibly more significant is that many budesonide‐induced signaling genes are associated with highly enriched GO terms for cell migration, movement, and proliferative effects. Thus, the chemokine, CXCL13, and the chemokine receptor, CXCR4, were strongly budesonide induced. Similarly, various GPCRs, which like chemokine receptors signal via Gα i, were also budesonide induced. Increased expression of the secreted metalloproteinase, PAPPA, which cleaves IGFBPs to increase IGF signaling, could enhance the effects of budesonide‐induced IGF1, and is implicated in IGF1‐induced smooth muscle migration and proliferation (Boldt and Conover 2007). Likewise, CRISPLD2 aids wound repair, a process that involves fibroblast growth and migration (Zhang et al. 2015). CXCL13 and the Gα i‐coupled GPCRs, as well as IGF1, PAPPA, and CRISPLD2, were less induced in HBE cells, demonstrating that cell type differences in expression and consequent downstream function will need to be carefully assessed. Furthermore, budesonide‐induced increases in growth factors and their receptors, including PDGFRA, INSR, and TGBR3, suggest that ICSs may promote responses to remodeling factors, including TGFβ (Gratchev et al. 2008). Such effects may reflect endogenous roles for glucocorticoids in dampening inflammation and promoting healing. However, enhanced remodeling could be undesirable in the context of anti‐inflammatory therapies and it is striking that glucocorticoids are generally regarded as being ineffective in attenuating airway remodeling in asthma, and in treating fibrotic lung diseases (Newton et al. 2010).
Taken together, these data are consistent with prior demonstration that TSC22D3 and FKBP5 mRNAs are increased in the airways of asthmatics receiving ICS (Kelly et al. 2012), but show less clear correspondence with data from ASM of patients following 14 days of oral prednisolone (Yick et al. 2013). Nevertheless, all genes tested by qPCR were budesonide upregulated in the biopsy samples and were also largely reproduced in multiple cells in vitro, as well as to some extent in peripheral blood. Thus, whereas cell type–dependent differences are clearly evident, the induction of numerous genes common to multiple cell types provides considerable confidence in this data. Indeed, genes such as DUSP1, KLF15, PER1, TSC22D3, and CRISPLD2 are glucocorticoid induced in ASM cells (Himes et al. 2014). Further support comes from macrophage where transcriptional regulators, in particular KLF9, but also, KLF15, and PER1, agree with the current data (Chinenov et al. 2014). Similarly, glucocorticoid upregulation of ALOX15B and receptors, including ADORA3 and CD163, is described (van de Garde et al. 2014). Clearly, it is now important to assess the above changes in gene expression in the context of disease as well as with chronic treatment protocols, as would clinically occur in asthma. Any loss of glucocorticoid responsiveness may provide key information as to underlying mechanisms for poor responsiveness to ICS in the context of severe asthma, exacerbations, or in chronic obstructive pulmonary disease. Similarly, the relationship among the dose of ICS, therapeutic efficacy, and the ability to induce expression of effector genes warrants investigation. Likewise studies to assess ICS‐induced changes in gene expression occurring in women are required.
In conclusion, a clinically relevant inhaled dose of budesonide upregulates expression of numerous genes, which impact on transcription, signaling, and metabolism in the human airways. These data unequivocally support multiple roles for ICS‐induced genes in repressing inflammatory gene expression and support the concept that redundant actions are likely (King et al. 2009; Shah et al. 2014, 2016). However, the data also highlight that glucocorticoids are not simply anti‐inflammatory drugs and whereas they profoundly dampen many components of the inflammatory response, they markedly enhance expression of many proinflammatory genes. Such effects are cell type specific. We hypothesize, based on the GO data, that, by selectively upregulating gene expression, glucocorticoids may promote cell migration, movement, and possibly proliferative responses. While this may reflect roles of endogenous glucocorticoids in promoting healing and repair, such effects may be undesirable in glucocorticoid therapies for some chronic anti‐inflammatory diseases. This suggestion could account for poor glucocorticoid efficacy in interstitial fibrotic lung diseases, and this provides a wealth of new targets that may be exploited to modify and improve glucocorticoid effectiveness and safety. Thus, the inhibition of one or more glucocorticoid‐induced tyrosine, or other, kinases may represent appropriate add‐on therapies to either enhance anti‐inflammatory activity or potentially reduce side effects. Indeed, such an approach was recently suggested with respect to DDIT4 (REDD1). This gene plays a key role in side‐effect generation, but not in anti‐inflammatory effects (Baida et al. 2015), and was significantly induced by budesonide in this study. Finally, long‐acting β 2‐adrenoceptor agonists are routinely coadministered along with an ICS, as combination treatments in moderate and severe asthma, as well as in COPD (Newton et al. 2010). Although these drugs have been demonstrated as enhancing glucocorticoid‐dependent transcription (Kaur et al. 2008a), and lead to synergistic enhancements of genes including RGS2, CRISPLD2, and others (Holden et al. 2011, 2014; Joshi et al. 2015), and additivity on DUSP1 (Kaur et al. 2008a; Manetsch et al. 2012), the effect of LABAs on side effect, or the many ICS‐induced genes reported here, remains unknown. Such data will also be important, particularly in the context of add‐on therapies, for example, phosphodiesterase 4 inhibitors, which are increasingly suggested for use in the context of ICS combinations (Giembycz and Newton 2014, 2015). Thus, oral dosing of a phosphodiesterase 4 inhibitor may produce therapeutically relevant synergies on genes that are ICS induced in the blood.
Author contributions
RL, EMK, CD, SLT, MMK: Clinical components (participant consents, record keeping, sample collection and preparation, and histology); SLT, CK, DMS: Collection and culture of primary cells; MMM, EMK, CFR, SS: RNA extractions and qPCR; CFR, Microarray analysis; CFR, AM, TK, MB, RN: Data handling, KEGG pathway analysis, bioinformatics; RL, AML, RN: Concept and experimental design: Obtained funding; RL, MMM, EMK, CFR, SS, CD, SLT, AM, TK, CK, DMS, MMM, MB, AML, and RN: Manuscript preparation.
Disclosures
None declared.
Supporting information
Data S1. Results
Table S1. Gene symbols, names, and description of genes analyzed by qPCR
Table S2. Clinical characteristics of study participants
Table S3. Biopsy microarray data: Probe sets showing ≥2‐fold or ≤0.5‐fold change (P ≤ 0.05) following budesonide inhalation
Table S4. Biopsy microarray data – Induced genes: Genes corresponding to probes sets showing ≥1.25‐fold (P ≤ 0.05) with inhaled budesonide are collected into functional groups
Table S5. Probe sets corresponding to the 23 genes validated by qPCR as being significantly induced by inhaled budesonide in the biopsy samples
Table S6. Functional annotation clustering of genes significantly increased by ≥2‐fold (FDR 0.05) by budesonide inhalation in bronchial biopsies
Table S7. Gene ontology (GO) terms used and not used in Fig. 2
Table S8. Functional cluster analysis with the 588 budesonide upregulated (≥1.25, P ≤ 0.05) genes
Table S9. Primary human bronchial epithelial cell microarray data: Probes sets showing ≥2‐fold or ≤0.5‐fold change (P ≤ 0.05) following 6 h of in vitro budesonide treatment
Table S10. Primary human bronchial epithelial cell microarray data: Functional grouping of genes showing ≥2‐ or ≤0.5‐fold change (P ≤ 0.05) following 6 h in vitro budesonide treatment
Figure S1. Study design: overview and procedures conducted at each visit. Following screening, the study participants were each randomized to receive either inhaled placebo followed by inhaled budesonide or inhaled budesonide followed by inhaled placebo.
Figure S2. Heat map of budesonide‐modulated genes showing ≥2‐ or ≤0.5‐fold change with 5% false discovery rate (FDR).
Figure S3. Differential cell counts and gene expression in bronchial brushings.
Figure S4. Comparison of biopsy microarray data with qPCR analysis of budesonide‐induced genes.
Figure S5. Pathway analysis showing selected pathways from the top 10 pathways most significantly associated with the microarray data.
Figure S6. Microarray and gene ontology analysis of primary human bronchial epithelial cells treated with budesonide.
Acknowledgements
The authors would like to thank: all the study participants; Drs Steven Woods and Kamala Patel for assistance with the provision of umbilical cords and HUVEC cells; and Dr Anders J. Lundqvist for the analysis of budesonide in blood serum.
Leigh R., Mostafa M. M., King E. M., Rider C. F., Shah S., Dumonceaux C., Traves S. L., McWhae A., Kolisnik T., Kooi C., Slater D. M., Kelly M. M., Bieda M., Miller‐Larsson A., Newton R.. An inhaled dose of budesonide induces genes involved in transcription and signaling in the human airways: enhancement of anti‐ and proinflammatory effector genes, Pharma Res Per, 4(4), 2016, e00243, doi: 10.1002/prp2.243
References
- Ayroldi E, Riccardi C (2009). Glucocorticoid‐induced leucine zipper (GILZ): a new important mediator of glucocorticoid action. FASEB J 23: 3649–3658. [DOI] [PubMed] [Google Scholar]
- Baida G, Bhalla P, Kirsanov K, Lesovaya E, Yakubovskaya M, Yuen K, et al. (2015). REDD1 Functions at the Crossroads Between the Therapeutic and Adverse Effects of Topical Glucocorticoids. EMBO Mol Med 7: 42–58. [DOI] [PMC free article] [PubMed] [Google Scholar]
- Bateman ED, Hurd SS, Barnes PJ, Bousquet J, Drazen JM, Fitzgerald M, et al. (2008). Global strategy for asthma management and prevention: GINA executive summary. Eur Respir J 31: 143–178. [DOI] [PubMed] [Google Scholar]
- Boldt HB, Conover CA (2007). Pregnancy‐associated plasma protein‐A (PAPP‐A): a local regulator of IGF bioavailability through cleavage of IGFBPs. Growth Horm IGF Res 17: 10–18. [DOI] [PubMed] [Google Scholar]
- Brooks SA, Blackshear PJ (2013). Tristetraprolin (TTP): interactions With MRNA and proteins, and current thoughts on mechanisms of action. Biochim Biophys Acta 1829: 666–679. [DOI] [PMC free article] [PubMed] [Google Scholar]
- Carpenter S, Carlson T, Dellacasagrande J, Garcia A, Gibbons S, Hertzog P, et al. (2009). TRIL, a functional component of the TLR4 signaling complex, highly expressed in brain. J Immunol 183: 3989–3995. [DOI] [PubMed] [Google Scholar]
- Carpenter S, Wochal P, Dunne A, O'Neill LA (2011). Toll‐like receptor 3 (TLR3) signaling requires TLR4 interactor with leucine‐rich repeats (TRIL). J Biol Chem 286: 38795–38804. [DOI] [PMC free article] [PubMed] [Google Scholar]
- Chinenov Y, Coppo M, Gupte R, Sacta MA, Rogatsky I (2014). Glucocorticoid receptor coordinates transcription factor‐dominated regulatory network in macrophages. BMC Genom 15: 656. [DOI] [PMC free article] [PubMed] [Google Scholar]
- Chivers JE, Cambridge LM, Catley MC, Mak JC, Donnelly LE, Barnes PJ, et al. (2004). Differential effects of RU486 reveal distinct mechanisms for glucocorticoid repression of prostaglandin E release. Eur J Biochem 271: 4042–4052. [DOI] [PubMed] [Google Scholar]
- Chivers JE, Gong W, King EM, Seybold J, Mak JC, Donnelly LE, et al. (2006). Analysis of the dissociated steroid, RU24858, does not Exclude a role for inducible genes in the anti‐inflammatory actions of glucocorticoids. Mol Pharmacol 70: 2084–2095. [DOI] [PubMed] [Google Scholar]
- Clark AR, Belvisi MG (2012). Maps and legends: the quest for dissociated ligands of the glucocorticoid receptor. Pharmacol Ther 134: 54–67. [DOI] [PubMed] [Google Scholar]
- Clark AR, Martins JR, Tchen CR (2008). Role of dual specificity phosphatases in biological responses to glucocorticoids. J Biol Chem 283: 25765–25769. [DOI] [PMC free article] [PubMed] [Google Scholar]
- Cockcroft DW, Killian DN, Mellon JJ, Hargreave FE (1977). Bronchial reactivity to inhaled histamine: a method and clinical survey. Clin Allergy 7: 235–243. [DOI] [PubMed] [Google Scholar]
- De Bosscher K, Vanden Berghe W, Haegeman G (2003). The interplay between the glucocorticoid receptor and nuclear factor‐kappaB or activator protein‐1: molecular mechanisms for gene repression. Endocr Rev 24: 488–522. [DOI] [PubMed] [Google Scholar]
- Donnelly LE, Barnes PJ (2001). Expression of heme oxygenase in human airway epithelial cells. Am J Respir Cell Mol Biol 24: 295–303. [DOI] [PubMed] [Google Scholar]
- Galon J, Franchimont D, Hiroi N, Frey G, Boettner A, Ehrhart‐Bornstein M, et al. (2002). Gene profiling reveals unknown enhancing and suppressive actions of glucocorticoids on immune cells. FASEB J 16: 61–71. [DOI] [PubMed] [Google Scholar]
- van de Garde MD, Martinez FO, Melgert BN, Hylkema MN, Jonkers RE, Hamann J (2014). Chronic exposure to glucocorticoids shapes gene expression and modulates innate and adaptive activation pathways in macrophages with distinct changes in leukocyte attraction. J Immunol 192: 1196–1208. [DOI] [PubMed] [Google Scholar]
- Gibbons DL, Abeler‐Dorner L, Raine T, Hwang IY, Jandke A, Wencker M, et al. (2011). cutting edge: regulator of G Protein signaling‐1 selectively regulates gut T cell trafficking and colitic potential. J Immunol 187: 2067–2071. [DOI] [PMC free article] [PubMed] [Google Scholar]
- Giembycz MA, Newton R (2014). How phosphodiesterase 4 inhibitors work in patients with chronic obstructive pulmonary disease of the severe, bronchitic, frequent exacerbator phenotype. Clin Chest Med 35: 203–217. [DOI] [PubMed] [Google Scholar]
- Giembycz MA, Newton R (2015). Potential mechanisms to explain how LABAs and PDE4 inhibitors enhance the clinical efficacy of glucocorticoids in inflammatory lung diseases. F1000Prime Rep 7:16. [DOI] [PMC free article] [PubMed] [Google Scholar]
- Gratchev A, Kzhyshkowska J, Kannookadan S, Ochsenreiter M, Popova A, Yu X, et al. (2008). Activation of a TGF‐beta‐specific multistep gene expression program in mature macrophages requires glucocorticoid‐mediated surface expression of TGF‐beta receptor II. J Immunol 180: 6553–6565. [DOI] [PubMed] [Google Scholar]
- Himes BE, Jiang X, Wagner P, Hu R, Wang Q, Klanderman B, et al. (2014). RNA‐Seq transcriptome profiling identifies CRISPLD2 As a glucocorticoid responsive gene that modulates cytokine function in airway smooth muscle cells. PLoS ONE 9: e99625. [DOI] [PMC free article] [PubMed] [Google Scholar]
- Holden NS, Bell MJ, Rider CF, King EM, Gaunt DD, Leigh R, et al. (2011). Beta2‐adrenoceptor agonist‐induced RGS2 expression is a genomic mechanism of bronchoprotection that is enhanced by glucocorticoids. Proc Natl Acad Sci U S A 108: 19713–19718. [DOI] [PMC free article] [PubMed] [Google Scholar]
- Holden NS, George T, Rider CF, Chandrasekhar A, Shah S, Kaur M, et al. (2014). Induction of regulator of G‐protein signaling 2 expression by long‐acting Beta2‐adrenoceptor agonists and glucocorticoids in human airway epithelial cells. J Pharmacol Exp Ther 348: 12–24. [DOI] [PubMed] [Google Scholar]
- Huang DW, Sherman BT, Lempicki RA (2009). Systematic and integrative analysis of large gene lists using DAVID bioinformatics resources. Nat Protoc 4: 44–57. [DOI] [PubMed] [Google Scholar]
- Joshi T, Johnson M, Newton R, Giembycz MA (2015). The long‐acting beta2 ‐adrenoceptor agonist, indacaterol, enhances glucocorticoid receptor‐mediated transcription in human airway epithelial cells in a gene‐ and agonist‐dependent manner. Br J Pharmacol 172: 2634–2653. [DOI] [PMC free article] [PubMed] [Google Scholar]
- Kanehisa M, Goto S, Sato Y, Kawashima M, Furumichi M, Tanabe M (2014). Data, information, knowledge and principle: back to metabolism in KEGG. Nucleic Acids Res 42: D199–D205. [DOI] [PMC free article] [PubMed] [Google Scholar]
- Kaur M, Chivers JE, Giembycz MA, Newton R (2008a). Long‐acting beta2‐adrenoceptor agonists synergistically enhance glucocorticoid‐dependent transcription in human airway epithelial and smooth muscle cells. Mol Pharmacol 73: 203–214. [DOI] [PubMed] [Google Scholar]
- Kaur M, Holden NS, Wilson SM, Sukkar MB, Chung KF, Barnes PJ, et al. (2008b). Effect of beta2‐adrenoceptor agonists and other CAMP‐elevating agents on inflammatory gene expression in human ASM cells: a role for protein kinase A. Am J Physiol Lung Cell Mol Physiol 295: L505–L514. [DOI] [PubMed] [Google Scholar]
- Kelly MM, King EM, Rider CF, Gwozd C, Holden NS, Eddleston J, et al. (2012). Corticosteroid‐induced gene expression in allergen‐challenged asthmatic subjects taking inhaled budesonide. Br J Pharmacol 165: 1737–1747. [DOI] [PMC free article] [PubMed] [Google Scholar]
- King EM, Holden NS, Gong W, Rider CF, Newton R (2009). Inhibition of NF‐kappab‐dependent transcription by MKP‐1: transcriptional repression by glucocorticoids occurring via P38 MAPK. J Biol Chem 284: 26803–26815. [DOI] [PMC free article] [PubMed] [Google Scholar]
- King EM, Chivers JE, Rider CF, Minnich A, Giembycz MA, Newton R (2013). Glucocorticoid repression of inflammatory gene expression shows differential responsiveness by transactivation‐ and transrepression‐dependent mechanisms. PLoS ONE 8: e53936. [DOI] [PMC free article] [PubMed] [Google Scholar]
- Luo W, Brouwer C (2013). Pathview: an R/bioconductor package for pathway‐based data integration and visualization. Bioinformatics 29: 1830–1831. [DOI] [PMC free article] [PubMed] [Google Scholar]
- Luo W, Friedman MS, Shedden K, Hankenson KD, Woolf PJ (2009). GAGE: generally applicable gene set enrichment for pathway analysis. BMC Bioinformatics 10: 161. [DOI] [PMC free article] [PubMed] [Google Scholar]
- Manetsch M, Ramsay EE, King EM, Seidel P, Che W, Ge Q, et al. (2012). Corticosteroids and beta(2)‐agonists upregulate mitogen‐activated protein kinase phosphatase 1: in vitro mechanisms. Br J Pharmacol 166: 2049–2059. [DOI] [PMC free article] [PubMed] [Google Scholar]
- Masoli M, Holt S, Weatherall M, Beasley R (2004). Dose‐response relationship of inhaled budesonide in adult asthma: a meta‐analysis. Eur Respir J 23: 552–558. [DOI] [PubMed] [Google Scholar]
- Miller MR, Hankinson J, Brusasco V, Burgos F, Casaburi R, Coates A, et al. (2005). Standardisation of Spirometry. Eur Respir J 26: 319–338. [DOI] [PubMed] [Google Scholar]
- Miyata M, Lee JY, Susuki‐Miyata S, Wang WY, Xu H, Kai H, et al. (2015). Glucocorticoids suppress inflammation via the upregulation of negative regulator IRAK‐M. Nat Commun 6: 6062. [DOI] [PMC free article] [PubMed] [Google Scholar]
- Newton R (2000). Molecular Mechanisms of Glucocorticoid Action: what Is Important? Thorax 55: 603–613. [DOI] [PMC free article] [PubMed] [Google Scholar]
- Newton R (2014). Anti‐inflammatory glucocorticoids: changing concepts. Eur J Pharmacol 724: 231–236. [DOI] [PubMed] [Google Scholar]
- Newton R, Holden NS (2007). Separating transrepression and transactivation: a distressing divorce for the glucocorticoid receptor? Mol Pharmacol 72: 799–809. [DOI] [PubMed] [Google Scholar]
- Newton R, Leigh R, Giembycz MA (2010). Pharmacological strategies for improving the efficacy and therapeutic ratio of glucocorticoids in inflammatory lung diseases. Pharmacol Ther 125: 286–327. [DOI] [PubMed] [Google Scholar]
- Pawson AJ, Sharman JL, Benson HE, Faccenda E, Alexander SP, Buneman OP, et al. (2014). The IUPHAR/BPS Guide to Pharmacology: an expert‐driven knowledgebase of drug targets and their ligands. Nucleic Acids Res 42: D1098–D1106. [DOI] [PMC free article] [PubMed] [Google Scholar]
- Reddy TE, Pauli F, Sprouse RO, Neff NF, Newberry KM, Garabedian MJ, et al. (2009). Genomic determination of the glucocorticoid response reveals unexpected mechanisms of gene regulation. Genome Res 19: 2163–2171. [DOI] [PMC free article] [PubMed] [Google Scholar]
- Sadler AJ, Rossello FJ, Yu L, Deane JA, Yuan X, Wang D, et al. (2015). BTB‐ZF transcriptional regulator plzf modifies chromatin to restrain inflammatory signaling programs. Proc Natl Acad Sci U S A 112: 1535–1540. [DOI] [PMC free article] [PubMed] [Google Scholar]
- Sasse SK, Mailloux CM, Barczak AJ, Wang Q, Altonsy MO, Jain MK, et al. (2013). The glucocorticoid receptor and KLF15 regulate gene expression dynamics and integrate signals through feed‐forward circuitry. Mol Cell Biol 33: 2104–2115. [DOI] [PMC free article] [PubMed] [Google Scholar]
- Schacke H, Docke WD, Asadullah K (2002). Mechanisms involved in the side effects of glucocorticoids. Pharmacol Ther 96: 23–43. [DOI] [PubMed] [Google Scholar]
- Shah S, King EM, Chandrasekhar A, Newton R (2014). Roles for the mitogen‐activated protein kinase (MAPK) phosphatase, DUSP1, in feedback control of inflammatory gene expression and repression by dexamethasone. J Biol Chem 289: 13667–13679. [DOI] [PMC free article] [PubMed] [Google Scholar]
- Shah S, Mostafa MM, McWhae A, Traves SL, Newton R (2016). Negative feed‐forward control of tumor necrosis factor (TNF) by tristetraprolin (ZFP36) is limited by the mitogen‐activated protein kinase phosphatase, dual‐specificity phosphatase 1 (DUSP1): implications for regulation by glucocorticoids. J Biol Chem 291: 110–125. [DOI] [PMC free article] [PubMed] [Google Scholar]
- Staal B, Williams BO, Beier F, Vande Woude GF, Zhang YW (2014). Cartilage‐specific deletion of mig‐6 results in osteoarthritis‐like disorder with excessive articular chondrocyte proliferation. Proc Natl Acad Sci U S A 111: 2590–2595. [DOI] [PMC free article] [PubMed] [Google Scholar]
- Stellato C (2004). Post‐transcriptional and nongenomic effects of glucocorticoids. Proc Am Thorac Soc 1: 255–263. [DOI] [PubMed] [Google Scholar]
- Surjit M, Ganti KP, Mukherji A, Ye T, Hua G, Metzger D, et al. (2011). Widespread negative response elements mediate direct repression by agonist‐liganded glucocorticoid receptor. Cell 145: 224–241. [DOI] [PubMed] [Google Scholar]
- Uings IJ, Farrow SN (2005). A Pharmacological Approach to Enhancing the Therapeutic Index of Corticosteroids in Airway Inflammatory Disease. Curr Opin Pharmacol 5: 221–226. [DOI] [PubMed] [Google Scholar]
- Wang JC, Derynck MK, Nonaka DF, Khodabakhsh DB, Haqq C, Yamamoto KR (2004). Chromatin Immunoprecipitation (ChIP) Scanning Identifies Primary Glucocorticoid Receptor Target Genes. Proc Natl Acad Sci U S A 101: 15603–15608. [DOI] [PMC free article] [PubMed] [Google Scholar]
- Wierzbicki T, Iqbal SM, Cuvelier SL, Awong G, Tibbles LA, Patel KD (2003). IL‐4 Primes Human Endothelial Cells for Secondary Responses to Histamine. J Leukoc Biol 74: 420–427. [DOI] [PubMed] [Google Scholar]
- Woodruff PG, Boushey HA, Dolganov GM, Barker CS, Yang YH, Donnelly S, et al. (2007). Genome‐wide profiling identifies epithelial cell genes associated with asthma and with treatment response to corticosteroids. Proc Natl Acad Sci U S A 104: 15858–15863. [DOI] [PMC free article] [PubMed] [Google Scholar]
- Xie Y, Jiang H, Nguyen H, Jia S, Berro A, Panettieri RA Jr., et al. (2012). Regulator of G protein signaling 2 is a key modulator of airway hyperresponsiveness. J Allergy Clin Immunol 130: 968–976. [DOI] [PubMed] [Google Scholar]
- Yick CY, Zwinderman AH, Kunst PW, Grunberg K, Mauad T, Fluiter K, et al. (2013). Glucocorticoid‐induced changes in gene expression of airway smooth muscle in patients with asthma. Am J Respir Crit Care Med 187: 1076–1084. [DOI] [PubMed] [Google Scholar]
- Zhang YW, Vande Woude GF (2007). Mig‐6, signal transduction, stress response and cancer. Cell Cycle 6: 507–513. [DOI] [PubMed] [Google Scholar]
- Zhang N, Truong‐Tran QA, Tancowny B, Harris KE, Schleimer RP (2007). Glucocorticoids enhance or spare innate immunity: effects in airway epithelium are mediated by CCAAT/enhancer binding proteins. J Immunol 179: 578–589. [DOI] [PMC free article] [PubMed] [Google Scholar]
- Zhang H, Sweezey NB, Kaplan F (2015). LGL1 modulates proliferation, apoptosis, and migration of human fetal lung fibroblasts. Am J Physiol Lung Cell Mol Physiol 308: L391–L402. [DOI] [PubMed] [Google Scholar]
Associated Data
This section collects any data citations, data availability statements, or supplementary materials included in this article.
Supplementary Materials
Data S1. Results
Table S1. Gene symbols, names, and description of genes analyzed by qPCR
Table S2. Clinical characteristics of study participants
Table S3. Biopsy microarray data: Probe sets showing ≥2‐fold or ≤0.5‐fold change (P ≤ 0.05) following budesonide inhalation
Table S4. Biopsy microarray data – Induced genes: Genes corresponding to probes sets showing ≥1.25‐fold (P ≤ 0.05) with inhaled budesonide are collected into functional groups
Table S5. Probe sets corresponding to the 23 genes validated by qPCR as being significantly induced by inhaled budesonide in the biopsy samples
Table S6. Functional annotation clustering of genes significantly increased by ≥2‐fold (FDR 0.05) by budesonide inhalation in bronchial biopsies
Table S7. Gene ontology (GO) terms used and not used in Fig. 2
Table S8. Functional cluster analysis with the 588 budesonide upregulated (≥1.25, P ≤ 0.05) genes
Table S9. Primary human bronchial epithelial cell microarray data: Probes sets showing ≥2‐fold or ≤0.5‐fold change (P ≤ 0.05) following 6 h of in vitro budesonide treatment
Table S10. Primary human bronchial epithelial cell microarray data: Functional grouping of genes showing ≥2‐ or ≤0.5‐fold change (P ≤ 0.05) following 6 h in vitro budesonide treatment
Figure S1. Study design: overview and procedures conducted at each visit. Following screening, the study participants were each randomized to receive either inhaled placebo followed by inhaled budesonide or inhaled budesonide followed by inhaled placebo.
Figure S2. Heat map of budesonide‐modulated genes showing ≥2‐ or ≤0.5‐fold change with 5% false discovery rate (FDR).
Figure S3. Differential cell counts and gene expression in bronchial brushings.
Figure S4. Comparison of biopsy microarray data with qPCR analysis of budesonide‐induced genes.
Figure S5. Pathway analysis showing selected pathways from the top 10 pathways most significantly associated with the microarray data.
Figure S6. Microarray and gene ontology analysis of primary human bronchial epithelial cells treated with budesonide.