

Abstract
Threose nucleic acid (TNA) is an artificial genetic polymer capable of heredity and evolution that is studied in the context of RNA chemical etiology. Its simplified four-carbon threose backbone replaces the five-carbon ribose in natural nucleic acids. Nonetheless, TNA forms stable antiparallel Watson-Crick homoduplexes and heteroduplexes with complimentary DNA and RNA. TNA base pairs with RNA more favorably than DNA, but the reason is unknown. Here, we employ NMR, ITC, UV and CD studies to probe the structural and dynamic properties of RNA/TNA and DNA/TNA heteroduplexes that give rise to the differential stability. The results indicate that TNA templates the structure of heteroduplexes, forcing an A-like helical geometry. Further NMR measurements of kinetic and thermodynamic parameters for individual base pair opening events reveal unexpected asymmetric breathing fluctuations of the DNA/TNA helix, which are also manifested at the molecular level. These results suggest that DNA is unable to fully adapt to the conformational constraints of the rigid TNA backbone and that nucleic acid breathing dynamics are determined from both backbone and base contributions.
Keywords: conformation analysis, DNA, nucleic acid dynamics, RNA evolution, TNA
Table of Contents
TNA, a potential evolutionary precursor of RNA, forms stable anti-parallel Watson-Crick heteroduplexes with DNA and RNA. The reason for its preference for RNA base pairing is unknown. A comparative conformation and dynamics analysis of RNA/TNA and DNA/TNA chimeras shows that A-like helical geometry of heteroduplexes, enforced by TNA, induces previously uncharacterized increased asymmetric breathing at the 5′/2′ terminus of TNA/DNA and puts DNA at the limits of its conformational adaptability.
Graphical Abstract
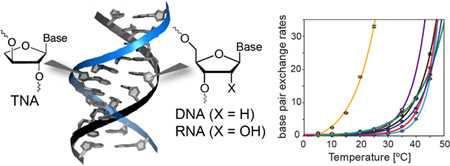
TNA (α-L-(3′-2′)-threofuranosyl nucleic acid) is an alternative genetic polymer in which the natural ribose sugar found in RNA has been replaced with an unnatural four-carbon sugar of α-L-threose (Scheme 1a).[1] Despite a backbone repeat unit that is one atom shorter than that found in DNA and RNA, TNA is capable of adopting stable Watson-Crick duplex structures with itself and with complementary strands of DNA and RNA.[1a, 2] The ability to exchange genetic information with RNA has raised significant interest in TNA as an RNA progenitor during the early stages of life on Earth.[3]
Scheme 1.

Backbone structure and nucleotide sequences of TNA, DNA, and RNA. (a) Constitutional structure of the linear backbone and strand directionality of TNA (left panel), and DNA/RNA (right panel). (b) Palindromic nucleotide sequences used in this study. For the chimeric duplexes, the bottom strand was composed of TNA.
Relative to natural DNA and RNA, TNA has a sugar-phosphate backbone composed of quasi trans-diaxial 3′-2′ phosphodiester linkages, which places the phosphate groups in distinct relative positions.[4] Crystallographic analysis of B- and A-form duplexes with a single TNA nucleotide inserted into an otherwise natural DNA strand yielded only minor effects on the duplex geometries, base-pair stacking interactions, and the sugar puckers of neighboring native nucleotides.[5],[6] In both structures, the threose sugar adopts a C4′-exo-pucker with a trans-diaxial orientation of the 3′- and 2′-substituents. The preference for this sugar conformation, irrespective of the A- or B-form geometry, suggests that TNA has a limited range of sugar conformations that are compatible with Watson-Crick base pairing.
Previous studies have shown that sequence can have dramatic effects on homo- and heteroduplex stability of both natural and artificial genetic polymers.[7] As a result, in this study we focus on a single duplex sequence and examine the structural properties and Watson-Crick base pairing dynamics of a model palindromic decamer sequence (Scheme 1b) constructed as DNA/TNA and RNA/TNA heteroduplexes. The bottom strands of the chimeric duplexes are composed of TNA. The TNA strand was generated by solid-phase synthesis using chemically synthesized TNA phosphoramidites.[8] Equivalent DNA and RNA homoduplexes were prepared and studied as a direct comparison to standard B- and A-form helices, respectively.
1D 1H NMR spectra of the homo- and heteroduplexes indicate that all four helices form standard Watson-Crick interactions as identified from the chemical shift and dispersion of the imino proton resonances (12–14 ppm, Figure S1). At low temperature, each decamer has eight sharp imino proton resonances, representative of stable duplexes with fraying exclusively at the terminal bases. Imino proton NMR spectra of the DNA and RNA helices between 5 and 50 °C (Figure S2) indicate that the DNA structures have lower thermal stability than the RNA structures. Consistent with the NMR data, UV spectroscopy thermal denaturation curves yielded melting temperature (Tm) values that are ~10 °C lower for the DNA/TNA and DNA/DNA duplexes, compared to the RNA/TNA and the RNA/RNA duplexes, respectively (Figure 1a).
Figure 1.

Thermal stability and CD analysis of model duplexes composed of DNA/TNA, DNA/DNA, RNA/TNA, and RNA/RNA. (a) Normalized UV-detected melting curves collected at 260 nm. Tm values for each curve are provided in the lower right corner. (b) CD spectra overlaid for each duplex acquired at pH 7.0 and 25 °C. Data are in units of mean residue molar ellipticity (Δε, deg cm2 dmol-1).
Thermal denaturation studies show that each chimeric duplex is similar in stability to its corresponding homoduplex (Figure 1a). This observation is consistent with previous analyses performed on mixed-sequence TNA/RNA and TNA/DNA hetero- and homoduplexes.[1a] Moreover, the Tm values observed by UV spectroscopy melting are partially reflected by the thermodynamic parameters obtained by isothermal titration calorimetry (ITC, Table 1, and Figure S3). The ITC results indicate that all duplexes have similar association stabilities with an average ΔG of −43 ± 3 kJ/mol. However, the dissociation constants (KD) differ significantly between the duplexes (Table 1). While KD values of the double stranded DNA (15 nM), RNA (12 nM) and RNA/TNA (45 nM) duplexes are all in the low nanomolar range, the KD of the DNA/TNA heteroduplex is clearly higher (135 nM), suggesting that a modest degree of structural incompatibility or increased dynamics exists within DNA/TNA heteroduplex.
Table 1.
Thermodynamic parameters from ITC.
| DNA/DNA | ||||
|---|---|---|---|---|
| KD [nM] | 15.0 ± 3.0 | 134.5 ± 5.4 | 11.7 ± 3.0 | 45.0 ± 4.6 |
| ΔH [kJ mol−1] | −278 ± 11 | −258 ± 16 | −330 ± 6 | −240 ± 5 |
| ΔG [kJ mol−1] | −44.8 ± 0.5 | −39.3 ± 0.1 | −45.4 ± 0.6 | −42.0 ± 0.3 |
| −TΔS [kJ mol−1] | 234 ± 11 | 219 ± 16 | 284 ± 6 | 198 ± 4 |
CD spectra also reveal the existence of conformational differences between the homo- and heteroduplexes (Figure 1b). As expected, the CD spectrum from DNA/DNA is typical of a standard B-form helix, with low mean residue molar ellipticity (Δε) arising from lower chirality of the perpendicularly oriented base pairs, a positive peak at 275 nm and a negative peak at 245 nm. The CD spectrum of RNA/RNA is consistent with an A-form helix with a positive peak at 260 nm and a negative peak near 210 nm. Compared to the natural duplexes, both the DNA/TNA and RNA/TNA heteroduplexes exhibit Δε values comparable to double stranded RNA with maxima near 270 nm, minima at 245 nm, and strong negative bands near 210 nm, consistent with an A-form conformation and suggestive that TNA prefers an RNA-like helical form.
NMR-detected imino protons are very sensitive to nucleic acid secondary structure.[9] To further evaluate the helical nature of TNA heteroduplexes, we recorded 1H-1H NOESY spectra for each construct in aqueous buffer at 15 °C and assigned the imino proton resonances (Figure 2a). As expected, imino protons for terminal base pairs of C1-G20 and C10-G11 were not observed due to their rapid exchange with water. However, all other imino protons were clearly identified. Consistent with their respective helical geometries, standard A-form RNA and B-form DNA duplexes yield imino NOE cross-peaks with high and low peak intensities, respectively. In agreement with the CD analysis, the NMR imino regions of the RNA/TNA, and DNA/TNA duplex spectra are similar to the A-form RNA/RNA duplex (Figure 2a). This result is most easily observed by comparing the G3-T(U)4 and T(U)7-G8 NOESY cross peaks.
Figure 2.

Conformational analysis of TNA heteroduplexes by solution NMR. (a) Imino regions of 1H-1H NOESY spectra of hetero- and homoduplexes measured at 15 °C. Spectra were scaled for comparison. Diagonal peaks are assigned with the diagonal shown as black line. Sequential peaks G3-T(U)4 and T(U)7-G8 used in quantitative analysis are indicated and their Gaussian-fitted direct dimension profiles are shown in the lower right corner of each panel with positions indicated by (1) and (2), respectively. (b) Top: generalized sequence of the studied duplexes with positions of the analyzed sequential bases being boxed. Bottom: estimated sequential 1H-1H distance (R) of G3H1:T(U)4H3 (gray bars) and T(U)7H3:G8H1 in 5′-3′ direction in the studied constructs, as compared to standard values of canonical A- and B-form DNA (‡). The strand identifiers are color coded according to the nucleic acid of origin.
Estimated sequential imino distances for the G3-T(U)4 and T(U)7-G8 bases in a 5′-3′ direction were calculated from NOE cross-peak intensities under the initial rate approximation[10] (see Supporting Information). As expected, the distances are consistent with the DNA/DNA duplex having a B-form helix. The RNA/RNA, RNA/TNA and DNA/TNA duplex distances are consistent with A-like helical geometries (Figure 2a).[9] Taken together, these data indicate that TNA templates heteroduplex structures to form A-like helices.
To better understand the stability and dynamics of the TNA heteroduplexes, we measured the rate of single base pair breathing events by NMR. Breathing motions in nucleic acid polymers are accompanied by the exchange of base imino hydrogens with water protons present in the aqueous surrounding.[11] We measured and analyzed imino proton solvent exchange rate constants (kex) and estimated the individual base pair stability in each of the four duplexes using solvent-exchange-based NMR methods (Figures 3a and S4).[12] The directionality of each duplex was assigned from 1H-1H NOESY anomeric-aromatic proton walks and directional H1′-H6/H8 correlations.[13] Single base pair stability analysis was performed for base pairs C2-G19 through C9-G12. Terminal kex values were lower for RNA self-pairing and cross-pairing with TNA as compared to DNA self-pairing and cross-pairing with TNA (Figure 3a). Fraying of the bases in the RNA duplexes is limited to the terminal base pairs of C1-G20 and C10-G11 and the kex values are uniformly low throughout the sequence with a slight increase in variability for the RNA/TNA duplex. With the exception of the penultimate base pairs, the DNA/DNA homoduplex also exhibits generally low flexibility in the core of the duplex structure with kex rates comparable to those observed for the RNA/RNA duplex. However, the penultimate base pair exchange rates rise symmetrically (~5-fold) over those observed in the core of the helix, consistent with symmetric, elevated motions at the duplex ends.
Figure 3.

Individual base pair stabilities of DNA and RNA homoduplexes and the corresponding TNA heteroduplexes. (a) Solvent exchange rates (kex) of imino protons in individual base pairs of DNA/DNA and DNA/TNA (top) compared to RNA/RNA and RNA/TNA (bottom) at 20 °C, depicted on top of the corresponding sequences. (b) Temperature dependence of imino proton solvent exchange rates (kex) for single base pairs in DNA/TNA. The corresponding fits of temperature-dependent kex data to Equation 6 in the Sup-porting Information are shown as solid lines that are color coded with the DNA/TNA duplex sequence below.
Base pair kinetics in the DNA/TNA heteroduplex revealed a previously uncharacterized asymmetric terminal exchange that is ~20-times faster kex (C2-G19) at the 5′/2′ end of the helix than the rest of the helix, where kex values remained low and comparable to rates observed in the other constructs. Fraying at the 3′/3′ end was again limited solely to the terminal base pair. Differences in the intramolecular dynamics of the DNA/DNA and DNA/TNA were also observed at the duplex level as differences in translational diffusion rates, measured by NMR, with the DNA/TNA diffusing slower (Figure S5). The strong terminal fraying of DNA/DNA and DNA/TNA may explain the observed differences in thermal stability between them and the RNA homoduplex and heteroduplex with TNA. Surprisingly the TNA/DNA duplex forms a dynamic, non-symmetric duplex structure in solution. The experiments were recorded at buffer concentrations that allow multiple closing and opening base-pair events prior to imino proton exchange (EX2 regime). This indicates that the asymmetric distribution of DNA/TNA kex values arise primarily from increased flexibility of the 5′/2′ end of the DNA/TNA heteroduplex. The lack of one carbon per residue in the threose-linked strand presumably causes TNA to exhibit increased backbone rigidity relative to the natural ribose-based backbones. Our data suggests that unlike RNA, DNA may be facing the limits of its structural variability when paired with TNA. This hypothesis is rooted in the phosphate group pitch differences of DNA (~6.8 Å), RNA (~6.0 Å) and TNA (~5.7 Å) caused by the sugar pucker. The high entropic costs for pucker adaptation will increase with oligonucleotide length, potentially explaining the elevated KD of the DNA/TNA duplex formation and limiting the duplex formation to relatively short polymers.
To investigate asymmetric base pair breathing in the DNA/TNA heteroduplex, we measured the individual base pair imino proton exchange rates as a function of temperature (Figure 3b).[14] As expected, kex (C2-G19) increased with temperature until reaching a detection limit (asymptote) at 25 °C. By comparison, exchange rates of other base pairs followed a much slower temperature-dependent exponential curve, reaching their detection limits at ≥40 °C. By fitting the temperature dependent kex (see Supporting Information, Equation 6), we extracted the enthalpy (ΔHDiss) and entropy (ΔSDiss) of single base pair dissociations in the DNA/TNA duplex. The Gibbs free energy of the process (ΔGDiss) was calculated according to the Gibbs-Helmholtz equation (Table 2).
Table 2.
Thermodynamics of DNA/TNA duplex individual base pair openings[a]
| ΔHDiss [kJ mol−1] |
ΔSDiss [J mol−1 K−1] |
ΔGDiss [kJ mol−1] [T = 20°C] |
TΔSDiss [kJ mol−1] [T = 20°C] |
|
|---|---|---|---|---|
| 73 ± 8 | 198 ± 27 | 15 ± 11 | 58 ± 8 | |
| 145 ± 3 | 396 ± 9 | 29 ± 4 | 116 ± 3 | |
| 42 ± 3 | 74 ± 10 | 20 ± 4 | 22 ± 3 | |
| 82 ± 5 | 201 ± 17 | 23 ± 7 | 59 ± 5 | |
| 84 ± 4 | 206 ± 12 | 24 ± 5 | 60 ± 3 | |
| 44 ± 4 | 80 ± 15 | 21 ± 7 | 23 ± 4 | |
| 175 ± 1 | 490 ± 4 | 31 ± 2 | 144 ± 1 | |
| 112 ± 8 | 299 ± 27 | 24 ± 11 | 88 ± 8 |
Data were recorded at 20 °C.
TNA bases are colored blue.
The measured DNA/TNA heteroduplex thermodynamic values for single base-pair breathing events are similar to previously reported values from DNA and RNA duplexes, stem regions of RNA loops[14], and imino exchange rates measured at elevated exchange catalyst concentrations.[15] The magnitude and sign of ΔHDiss suggest that the base pairs of DNA/TNA are enthalpically stabilized. Higher values at the ends for ΔHDiss(GC) than ΔHDiss(AT) in the middle of the sequence likely reflect the formation of all three hydrogen bonds between guanine and cytosine bases. Compared to ΔGDiss reported for central bases in DNA duplexes (24 kJ/mol to 32.6 kJ/mol)[14b, 15a] ΔGDiss for DNA/TNA central pairs were mostly at the lower end of the range. The asymmetry of duplex breathing was reflected with a distribution of ΔGDiss values. Central base pairs for the DNA/TNA helix showed comparable ΔGDiss values; however, the ΔGDiss (C2-G19) is consistent with the dynamic behavior and lower stability of the 5′-DNA/2′-TNA end.
In general, ΔGDiss for each base pair was far less than the absolute value of ΔG for the heteroduplex formation detected by ITC, indicating that DNA/TNA heteroduplex stability is highly cooperative in nature. The distribution of ΔGDiss values suggest that the opening of single DNA/TNA base pairs is primarily uncorrelated at 20 °C. Enthalpy-entropy compensation, i.e. the variations of ΔHDiss and ΔSDiss that offset one another to allow biologically accessible ΔGDiss values, was observed for single base pairs in the DNA/TNA helix, suggesting that similar processes that underlie RNA duplex melting are involved in TNA-DNA heteroduplex stabilization. Historically, this effect was observed macroscopically across related systems [16] and more recently was described at the single base pair level in a double stranded RNA stem.[14a]
In summary, we report an extensive biophysical and thermodynamic characterization of base-pairing interactions between TNA and DNA and RNA. Our results show that despite similar thermal and thermodynamic stabilities TNA strongly favors an A-like helical geometry when base paired with either DNA or RNA. Thermodynamic characterization of single base pair opening events indicates that the enhanced stability of RNA/TNA base pairing over DNA/TNA base pairing is due to asymmetric fraying at the 5′/2′ terminus of the DNA/TNA duplex. This previously uncharacterized effect manifests itself at the macromolecular level through distinct hydrodynamic differences between the DNA/TNA heteroduplex and the DNA homoduplex. We suggest that this phenomenon is likely due to an inability of DNA to fully adapt to the conformational constraints of a rigid TNA backbone. As a result, structural studies of DNA/TNA chimeric duplexes could prove challenging. These data also suggest that in addition to thermodynamic differences in stability between AT- and GC-rich nucleic acid segments, backbone contributions can significantly alter conformational fluctuations in double-stranded nucleic acid breathing.
Supplementary Material
Acknowledgments
This work was supported by the DARPA Fold F(x) Program (N66001-14-2-4054) and National Institutes of Health (GM071461 to ER). We thank Prof. Dr. H. Schwalbe and Dr. H. Steinert for helpful comments on imino proton exchange NMR and Prof. Dr. J. Heemstra for helpful discussions.
Footnotes
Supporting information for this article can be found under http:// .
Contributor Information
Dr. Irina Anosova, School of Molecular Sciences and the Biodesign Institute, Arizona State University Tempe, AZ 85287 (USA)
Dr. Ewa A. Kowal, Department of Biochemistry, Vanderbilt University School of Medicine, Nashville, TN 37232 (USA)
Nicholas J. Sisco, School of Molecular Sciences and the Biodesign Institute, Arizona State University Tempe, AZ 85287 (USA)
Dr. Sujay Sau, Department of Pharmaceutical Sciences, University of California Irvine, Irvine, CA 92697 (USA)
Jen-yu Liao, Department of Pharmaceutical Sciences, University of California Irvine, Irvine, CA 92697 (USA).
Saikat Bala, Department of Pharmaceutical Sciences, University of California Irvine, Irvine, CA 92697 (USA).
Prof. Dr. Eriks Rozners, Department of Chemistry Binghamton University, State University of New York, Binghamton, NY 13902 (USA)
Prof. Dr. Martin Egli, Department of Biochemistry, Vanderbilt University School of Medicine, Nashville, TN 37232 (USA)
Prof. Dr. John C. Chaput, Department of Pharmaceutical Sciences, University of California Irvine, Irvine, CA 92697 (USA)
Prof. Dr. Wade D. Van Horn, School of Molecular Sciences and the Biodesign Institute, Arizona State University Tempe, AZ 85287 (USA)
References
- 1.a) Schoning K, Scholz P, Guntha S, Wu X, Krishnamurthy R, Eschenmoser A. Science. 2000;290:1347–1351. doi: 10.1126/science.290.5495.1347. [DOI] [PubMed] [Google Scholar]; b) Anosova I, Kowal EA, Dunn MR, Chaput JC, Van Horn WD, Egli M. Nucleic Acids Res. 2016;44:1007–1021. doi: 10.1093/nar/gkv1472. [DOI] [PMC free article] [PubMed] [Google Scholar]
- 2.Yang YW, Zhang S, McCullum EO, Chaput JC. J. Mol. Evol. 2007;65:289–295. doi: 10.1007/s00239-007-9017-9. [DOI] [PubMed] [Google Scholar]
- 3.Orgel L. Science. 2000;290:1306–1307. doi: 10.1126/science.290.5495.1306. [DOI] [PubMed] [Google Scholar]
- 4.a) Ebert MO, Mang C, Krishnamurthy R, Eschenmoser A, Jaun B. J. Am. Chem. Soc. 2008;130:15105–15115. doi: 10.1021/ja8041959. [DOI] [PubMed] [Google Scholar]; b) Ebert MO, Jaun B. Chem. Biodivers. 2010;7:2103–2128. doi: 10.1002/cbdv.201000096. [DOI] [PubMed] [Google Scholar]
- 5.Wilds CJ, Wawrzak Z, Krishnamurthy R, Eschenmoser A, Egli M. J. Am. Chem. Soc. 2002;124:13716–13721. doi: 10.1021/ja0207807. [DOI] [PubMed] [Google Scholar]
- 6.Pallan PS, Wilds CJ, Wawrzak Z, Krishnamurthy R, Eschenmoser A, Egli M. Angew. Chem. Int. Ed. Engl. 2003;42:5893–5895. doi: 10.1002/anie.200352553. [DOI] [PubMed] [Google Scholar]
- 7.Schöning K-U, Scholz P, Wu X, Guntha S, Delgado G, Krishnamurthy R, Eschenmoser A. Helv. Chim. Acta. 2002;85:4111–4153. [Google Scholar]
- 8.Sau SP, Fahmi NE, Liao JY, Bala S, Chaput JC. J. Org. Chem. 2016 doi: 10.1021/acs.joc.5b02768. [DOI] [PubMed] [Google Scholar]
- 9.Wuethrich K. NMR of Proteins and Nucleic Acids. United States of America, Canada: John Wiley & Sons, Inc; 1986. [Google Scholar]
- 10.Cavanagh J, Fairbrother WJ, Plamer AG, III, Rance M, Skelton N. Protein NMR Spectroscopy. Principles and Practice. Amsterdam, Boston, Heidelberg, London, New York, Oxford, Paris, San Diego, San Francisco, Singapore, Sydney, Tokyo: Elsevier, Academic Press; 2007. [Google Scholar]
- 11.Gueron M, Leroy JL. Methods Enzymol. 1995;261:383–413. doi: 10.1016/s0076-6879(95)61018-9. [DOI] [PubMed] [Google Scholar]
- 12.Szulik MW, Voehler M, Stone MP. Curr. Protoc. Nucleic Acid Chem. 2014;59:7, 20, 21–27, 20, 18. doi: 10.1002/0471142700.nc0720s59. [DOI] [PMC free article] [PubMed] [Google Scholar]
- 13.a) Boelens R, Scheek RM, Dijkstra K, Kaptein R. J. Magn. Reson. 1985;62:378–386. [Google Scholar]; b) Furtig B, Richter C, Wohnert J, Schwalbe H. ChemBioChem. 2003;4:936–962. doi: 10.1002/cbic.200300700. [DOI] [PubMed] [Google Scholar]
- 14.a) Rinnenthal J, Klinkert B, Narberhaus F, Schwalbe H. Nucleic Acids Res. 2010;38:3834–3847. doi: 10.1093/nar/gkq124. [DOI] [PMC free article] [PubMed] [Google Scholar]; b) Steinert HS, Rinnenthal J, Schwalbe H. Biophys. J. 2012;102:2564–2574. doi: 10.1016/j.bpj.2012.03.074. [DOI] [PMC free article] [PubMed] [Google Scholar]; c) Wagner D, Rinnenthal J, Narberhaus F, Schwalbe H. Nucleic Acids Res. 2015;43:5572–5585. doi: 10.1093/nar/gkv414. [DOI] [PMC free article] [PubMed] [Google Scholar]
- 15.a) Chen C, Russu IM. Biophys. J. 2004;87:2545–2551. doi: 10.1529/biophysj.104.045179. [DOI] [PMC free article] [PubMed] [Google Scholar]; b) Huang Y, Weng X, Russu IM. Biochemistry. 2011;50:1857–1863. doi: 10.1021/bi1014997. [DOI] [PubMed] [Google Scholar]; c) Folta-Stogniew E, Russu IM. Biochemistry. 1994;33:11016–11024. doi: 10.1021/bi00202a022. [DOI] [PubMed] [Google Scholar]; d) Moe JG, Russu IM. Biochemistry. 1992;31:8421–8428. doi: 10.1021/bi00151a005. [DOI] [PubMed] [Google Scholar]
- 16.a Lis H, Sharon N. Chem. Rev. 1998;98:637–674. doi: 10.1021/cr940413g. [DOI] [PubMed] [Google Scholar]; b Liu L, Yang C, Guo QX. Biophys. Chem. 2000;84:239–251. doi: 10.1016/s0301-4622(00)00130-7. [DOI] [PubMed] [Google Scholar]
Associated Data
This section collects any data citations, data availability statements, or supplementary materials included in this article.