Abstract
Casitas b-lineage lymphoma (c-Cbl) is an E3 ubiquitin ligase that has an important role in regulating the degradation of cell surface receptors. In the present study we have examined the role of c-Cbl in whole-body energy homeostasis. c-Cbl–/– mice exhibited a profound increase in whole-body energy expenditure as determined by increased core temperature and whole-body oxygen consumption. As a consequence, these mice displayed a decrease in adiposity, primarily due to a reduction in cell size despite an increase in food intake. These changes were accompanied by a significant increase in activity (2- to 3-fold). In addition, c-Cbl–/– mice displayed a marked improvement in whole-body insulin action, primarily due to changes in muscle metabolism. We observed increased protein levels of the insulin receptor (4-fold) and uncoupling protein-3 (2-fold) in skeletal muscle and a significant increase in the phosphorylation of AMP-activated protein kinase and acetyl-CoA carboxylase. These findings suggest that c-Cbl plays an integral role in whole-body fuel homeostasis by regulating whole-body energy expenditure and insulin action.
Introduction
The proto-oncogene Casitas b-lineage lymphoma (c-Cbl) is an adaptor protein with an intrinsic E3 ubiquitin ligase activity that plays a role in regulating receptor tyrosine kinase signaling (1). Recently, c-Cbl has been suggested to play a novel role in insulin action in adipocytes independent of the PI3K/Akt pathway (2). In 3T3-L1 adipocytes, c-Cbl forms a complex with 2 adaptor proteins, APS and CAP. Upon insulin stimulation, this complex binds to the insulin receptor (IR) via an interaction between an SH2 domain in APS and the tyrosyl-phosphorylated receptor tail (3). c-Cbl then undergoes insulin-dependent tyrosine phosphorylation, resulting in the recruitment of the c-Cbl/CAP complex to lipid rafts via an interaction between CAP and the lipid raft protein flotillin (4). Within the lipid raft, tyrosyl-phosphorylated c-Cbl recruits the CrkII/C3G heterodimer via an interaction between an SH2 domain in CrkII and a tyrosine phosphorylation site in c-Cbl (5). Recruitment of C3G, a guanine nucleotide exchange factor for small–molecular weight GTPases, into lipid rafts brings it into contact with TC10, a GTPase thought to play a role in insulin-regulated glucose transport (5).
This positive regulatory role of c-Cbl in insulin action in 3T3-L1 adipocytes (2) appears contrary to the well-established negative regulatory role of c-Cbl in intracellular signal transduction initiated by receptor tyrosine kinases (1). c-Cbl mediates this negative effect by catalyzing the ubiquitination of tyrosine kinase receptors, which targets them for lysosomal degradation. Inhibition of this process results in enhanced signal transduction. This emphasizes the importance of c-Cbl as a negative regulator of signaling (1). The role of c-Cbl in insulin action has primarily been studied in 3T3-L1 adipocytes. However, the role of this protein in other insulin-sensitive cells or in whole-body insulin action in animals is not, at present, clear. In order to further evaluate the role of c-Cbl in insulin action, we have conducted metabolic profiling of c-Cbl–/– mice. Surprisingly, we found that c-Cbl–deficient mice exhibit improved insulin action. More importantly, c-Cbl–/– mice display a profound metabolic phenotype that exhibits reduced adiposity despite hyperphagia. They are also more thermogenic and have a higher resting metabolic rate, which implicates c-Cbl as a major regulator of whole-body energy expenditure.
Results
c-Cbl–deficient mice exhibit reduced adipose mass despite hyperphagia.
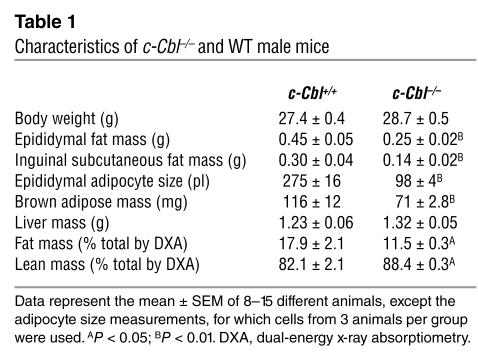
The body weight of c-Cbl–/– mice was not significantly different from that of WT controls for either male or female mice (Figure 1A). Despite the maintenance of normal body weight, male and female c-Cbl–/– mice displayed a significant increase in food intake (Figure 1B). Interestingly, this increase in caloric intake did not lead to increased adiposity. On the contrary, there was a 40–50% decrease in the size of all adipose tissue depots including epididymal, inguinal, and interscapular brown fat (Figure 1, C–E; Table 1). Analysis of body composition by dual-energy x-ray absorptiometry confirmed the reduced fat mass of c-Cbl–/– mice and a concomitant increase in percentage lean body mass (Table 1). This reduction in adipose tissue mass was primarily due to a 64% reduction in adipocyte volume in c-Cbl–/– mice compared with WT animals (Table 1). In WT animals 42% of adipocytes had a diameter greater than 80 μm, while in c-Cbl–/– mice 93% of cells had a diameter less than 80 μm (Figure 1F). A similar phenotype regarding adiposity and adipocyte cell size was observed in female animals. However, because the phenotype observed in c-Cbl–/– mice was more pronounced in male animals, the majority of experiments described below were performed only in males.
Figure 1.
c-Cbl–deficient mice show reduced fat mass despite hyperphagia. (A and B) Body weight evolution between 4 and 16 weeks of age in WT (+/+) and c-Cbl–deficient (–/–) mice (A), and daily food intake in 12- to 16-week-old WT and c-Cbl–deficient mice (B). Data represent the mean ± SEM of 5–20 animals per group. *P < 0.05. (C–E) Representative epididymal (C) and subcutaneous inguinal (D) white fat pads and interscapular brown adipose tissue (E) from age- and weight-matched WT and c-Cbl–deficient mice. Scale bars: 1 cm. (F) Representative adipocyte size distribution from age- and weight-matched WT and c-Cbl–deficient mice.
Table 1.
Characteristics of c-Cbl–/– and WT male mice
c-Cbl–deficient mice exhibit enhanced whole-body insulin action.
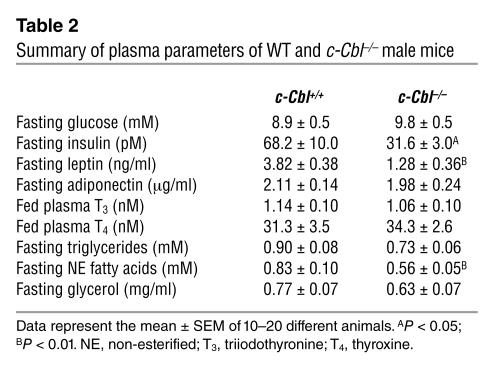
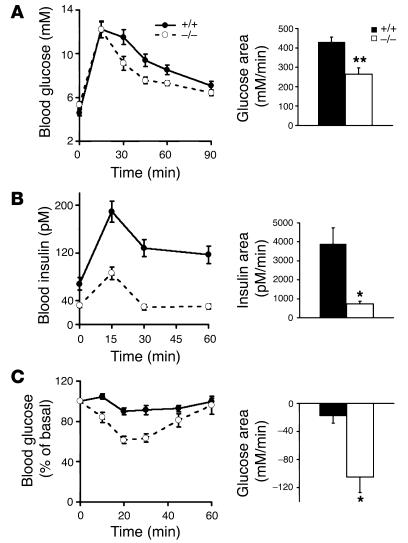
Overnight-fasted c-Cbl–/– mice had plasma glucose levels similar to those in WT mice, despite a significant reduction in circulating insulin levels (Table 2). To examine the role of c-Cbl in glucose homeostasis, we next performed glucose tolerance tests to provide an assessment of whole-body insulin action. Rather than a reduction in insulin action, as might have been predicted based on the proposed positive role of c-Cbl in insulin-regulated glucose transport in 3T3-L1 adipocytes (6), c-Cbl–/– mice displayed improved glucose tolerance compared with WT animals (Figure 2A). Moreover, this effect was observed in the face of markedly reduced insulin levels throughout the glucose tolerance test in c-Cbl–/– mice (Figure 2B). The increased blood glucose clearance in the presence of lower circulating insulin levels indicates that peripheral insulin action is enhanced in c-Cbl–/– animals. To examine insulin action independently of pancreatic function, we performed insulin tolerance tests on WT and c-Cbl–/– animals. As shown in Figure 2C, after administration of a low dose of insulin (0.5 U/kg), c-Cbl–/– animals exhibited a greater decline in blood glucose levels compared with WT mice.
Table 2.
Summary of plasma parameters of WT and c-Cbl–/– male mice
Figure 2.
Glucose metabolism in overnight-fasted WT and c-Cbl–deficient mice in vivo. (A) Glucose tolerance test (2 g/kg) in 16- to 18-week-old mice. (B) Circulating insulin levels during the glucose tolerance test. (C) Percentage change in blood glucose during an insulin tolerance test (0.5 U/kg). Histograms on the right show the area under the curve. Data represent the mean ± SEM of 10–12 animals per group. *P < 0.01; **P < 0.001.
c-Cbl–deficient mice exhibit increased glucose uptake in muscle.
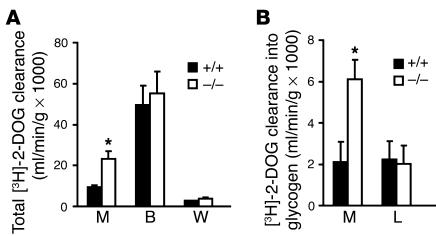
To determine the contribution of different tissues to the improved glucose tolerance observed in c-Cbl–/– mice, we examined the clearance of [3H]-2-deoxyglucose ([3H]-2-DOG) coadministered with the glucose load during the glucose tolerance test. As shown in Figure 3A, total [3H]-2-DOG clearance during the glucose tolerance test was 2-fold higher in skeletal muscle of c-Cbl–/– mice compared with WT animals. There was no significant difference in [3H]-2-DOG uptake in white or brown adipose tissue between c-Cbl–/– and WT animals during the same experiments. We also examined the clearance of [3H]-2-DOG into glycogen in muscle and liver. In muscle from c-Cbl–/– mice, [3H]-2-DOG clearance into glycogen was increased compared with that in muscle from WT animals. This is consistent with the total [3H]-2-DOG clearance data (Figure 3B). However, there was no significant difference in [3H]-2-DOG clearance into glycogen in liver in the c-Cbl–/– mice compared with controls.
Figure 3.
Clearance of the glucose analogue [3H]-2-DOG into glucose-6-phospate (A) in muscle (M), brown adipose tissue (B), and white adipose tissue (W), and into glycogen (B) in muscle (M) and liver (L), during a glucose tolerance test. WT mice are represented by the black bars and c-Cbl–/– mice by the white bars. Data represent the mean ± SEM of 5 animals per group. *P < 0.05.
To ascertain whether these differences in in vivo insulin action were due to acute effects of altered circulating factors in the c-Cbl–deficient animals, we examined the effects of insulin on [3H]-2-DOG uptake in muscle and fat explants incubated ex vivo. Consistent with the in vivo data (Figures 2 and 3), we observed a significant (30%) increase in insulin-stimulated [3H]-2-DOG uptake in both soleus and extensor digitorum longus (EDL) muscle from c-Cbl–/– mice (Figure 4, A and B). We also observed a significant (65%) increase in basal [3H]-2-DOG uptake in soleus but not in EDL muscle from c-Cbl–/– mice. There was no significant difference in either basal or insulin-stimulated [3H]-2-DOG uptake in fat explants from c-Cbl–/– mice compared with WT animals (Figure 4C).
Figure 4.
[3H]-2-DOG uptake in isolated soleus (A) and EDL (B) muscles incubated without (Basal) or with 1.8 nM (Submax) or 60 nM (Max) insulin for 30 minutes at 30–C. (C) [3H]-2-DOG uptake in epididymal fat explants incubated without (Basal) or with 0.05 nM (Submax) or 1 nM (Max) insulin for 15 minutes at 37–C. WT mice are represented by the black bars and c-Cbl–/– mice by the white bars. Data represent the mean ± SEM of 5–12 isolated tissues per group. *P < 0.05, **P < 0.01.
c-Cbl–deficient mice exhibit higher IR levels in muscle but not in liver.
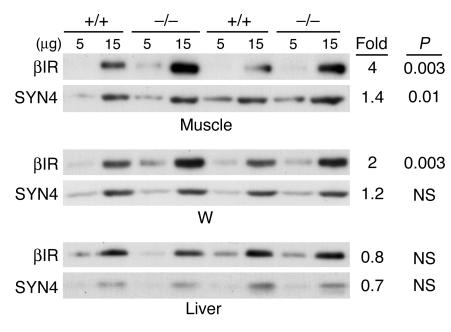
c-Cbl has been shown to regulate the stability of a number of tyrosine kinase receptors (1). Therefore, one possible explanation for the increased muscle insulin sensitivity is that in the absence of c-Cbl the total number of IRs may be increased. To test this, we examined whether the total protein levels of the IR and other proteins involved in insulin action were changed in muscle tissue from c-Cbl–/– mice. As shown in Figure 5, the IR protein levels were increased 4-fold in muscle from c-Cbl–/– mice compared with WT animals. The levels of insulin receptor substrate-1 were marginally increased in muscle from c-Cbl–deficient animals, whereas GLUT4 levels were not significantly different (data not shown). In adipose tissue we observed only a 2-fold increase in IR protein levels in c-Cbl–/– mice, whereas in liver the IR level was not significantly altered. As a control, we immunoblotted all samples with an antibody specific for syntaxin4 in all 3 tissues from WT and c-Cbl–/– mice.
Figure 5.
IR protein levels in insulin-sensitive tissues. Aliquots (5 and 15 μg total protein) of quadriceps (muscle), epididymal white adipose tissue, and liver homogenates from WT and c-Cbl–deficient mice were resolved by SDS-PAGE and immunoblotted with antibodies specific for the β subunit of the IR (βIR) and syntaxin4 (SYN4). The fold increase in protein levels observed in c-Cbl–/– mice compared with WT animals, as well as the result of the statistical analysis of the data, is shown at the right of each lane. These values represent the average of 6–12 animals in each group.
c-Cbl–deficient mice display hypoleptinemia but no change in circulating adiponectin levels.
We next assessed circulating levels of adipokines known to regulate muscle metabolism. We did not observe any change in fasting adiponectin levels; however, there was a significant decrease (66%) in circulating leptin levels in the c-Cbl–/– animals compared with controls (Table 2). To examine the role of hypoleptinemia in the hyperphagia observed in c-Cbl–/– mice, we measured mRNA levels of relevant neuropeptides in the hypothalamus. Consistent with the well-established inverse relationship between leptin and appetite (7), we found that the mRNA levels of the orexigenic factor neuropeptide Y in the arcuate nucleus of c-Cbl–/– mice was increased (55%, P < 0.05, n = 5) compared with those in WT animals. We also observed a significant decrease (approximately 30%, P < 0.05, n = 5) in the expression of the anorexigenic factor cocaine- and amphetamine-regulated transcript in c-Cbl–/– mice compared with controls. We did not observe any significant change in mRNA levels of corticotropin-releasing hormone and thyrotropin-releasing hormone in neurons of the paraventricular nucleus (data not shown). These changes suggest that the hyperphagia observed in c-Cbl–/– mice may be secondary to the lower leptin levels and decreased adiposity observed in c-Cbl–/– mice.
c-Cbl–deficient mice exhibit higher whole-body energy expenditure.
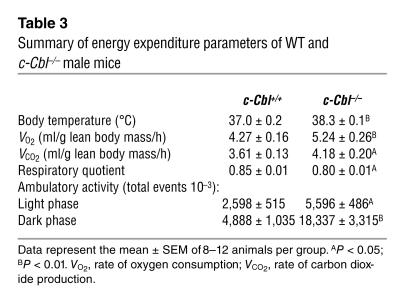
While increased muscle IR levels and reduced circulating leptin levels may contribute to increased whole-body insulin action and hyperphagia, respectively, it is unlikely that either of these changes causes reduced adiposity in the c-Cbl–/– mice. The reduction in adiposity combined with hyperphagia suggests that there must be a concomitant increase in whole-body energy expenditure in the c-Cbl–/– mice. To explore this hypothesis, we examined body temperature and resting metabolic rate, 2 indices of energy expenditure, in WT and c-Cbl–deficient mice. Rectal temperature was elevated by 1°C in the c-Cbl–/– mice (Table 3). This difference in body temperature was observed independently of the time of day and of whether the animals were fed or fasted overnight (data not shown). Such an effect could be due to changes in thyroid hormone levels, a major regulator of thermogenesis (8). However, we did not observe any significant difference in the circulating levels of triiodothyronine (T3) or thyroxine (T4) between c-Cbl–/– and WT mice in either the fed (Table 2) or the fasted state (data not shown), which suggests that increased thermogenesis in these animals is unlikely due to changes in the thyroid axis. To further confirm the increased energy expenditure in c-Cbl–/– mice, we examined the metabolic rate of these animals by indirect calorimetry using a custom-built system specifically designed to measure oxygen consumption and carbon dioxide production in small animals (9). Whole-body oxygen consumption was increased by 22% in c-Cbl–deficient mice compared with WT animals after correction for the difference in lean mass between the 2 groups (Table 3). The respiratory quotient was significantly reduced in c-Cbl–/– mice (Table 3), which suggests that the increased energy expenditure was supported by increased fatty acid oxidation. Consistent with this, we observed significantly lower plasma FFA levels in c-Cbl–/– mice compared with control animals (Table 2). In addition, triglyceride levels in the liver of c-Cbl–/– mice were significantly lower (5.3 ± 0.28 μmol/g tissue, n = 10, P < 0.01) than those in control animals (9.65 ± 1.31 μmol/g tissue, n = 10), whereas triglyceride levels in the quadriceps muscle from WT and Cbl–/– mice were not statistically different (8.5 ± 0.8 μmol/g tissue, n = 9, versus 6.7 ± 0.6 μmol/g tissue, n = 7, respectively). A significant increase in ambulatory activity was also observed in Cbl–/– mice, which would also contribute to increased energy expenditure (Table 3). This increased activity was particularly evident in the dark phase (approximately 4-fold higher than in WT mice) and could indicate increased food-seeking behavior consistent with the hyperphagia observed in c-Cbl–/– mice.
Table 3.
Summary of energy expenditure parameters of WT and c-Cbl–/– male mice
We also performed analyses of c-Cbl+/– animals. These animals displayed a phenotype intermediate between that of WT and c-Cbl–deficient mice. c-Cbl+/– animals showed a modest improvement in glucose tolerance and a slightly higher body temperature compared with WT mice, but these differences did not reach statistical significance (data not shown). There was a significant (30%, P < 0.05) reduction in epididymal white adipose mass in c-Cbl+/– mice compared with WT controls.
c-Cbl–deficient mice have changes in muscle mitochondria.
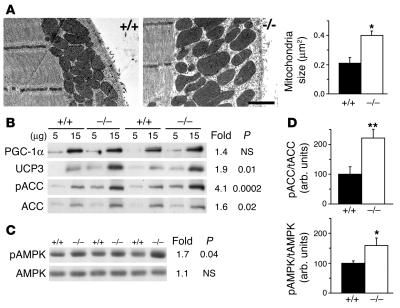
The above studies indicate that loss of c-Cbl expression results in enhanced insulin action and increased whole-body energy expenditure. Two major tissues that have been found to contribute to energy expenditure in rodents are brown adipose tissue and skeletal muscle (10). Our studies have found no evidence to support a role for brown adipose tissue in contributing to this phenotype, as brown adipose depots were reduced in size in c-Cbl–/– animals (Table 1 and Figure 1) and we did not observe any significant change in [3H]-2-DOG uptake in brown fat in the c-Cbl–/– mice in vivo. To explore a possible mechanism for the increased whole-body energy expenditure, we examined a variety of parameters known to be involved in energy metabolism in skeletal muscle in the c-Cbl–deficient mice. Changes in mitochondrial size and function in muscle have previously been associated with changes in insulin action and energy expenditure (11–13). Therefore, we undertook a detailed analysis of this organelle using electron microscopy and found that there was a 2-fold increase in the average size of subsarcolemmal mitochondria in c-Cbl–/– mice compared with WT animals (Figure 6A). However, we did not observe any significant change in the mitochondrial area in the subsarcolemmal region (61% ± 4% and 66% ± 3% in WT versus c-Cbl–/– mice, respectively), nor did we observe any change in cristae density (24.0 ± 0.6 and 23.6 ± 0.5 cristae/μm in WT versus c-Cbl–/– mice, respectively, n > 30). Recent studies have implicated the nuclear hormone receptor PPARγ coactivator-α (PGC1α) in muscle mitochondrial biogenesis and FFA metabolism (14, 15), but we were unable to detect any significant change in the level of the PGC1α protein in muscle from c-Cbl–/– mice (Figure 6B). However, the level of acetyl-CoA carboxylase (ACC), a rate-limiting enzyme for mitochondrial FFA oxidation, was increased 1.6-fold, and that of uncoupling protein-3 (UCP3), a muscle mitochondrial uncoupling protein, was increased 1.9-fold, in muscle from c-Cbl–/– mice compared with controls.
Figure 6.
Representative electron micrographs of soleus muscle from WT and c-Cbl–deficient mice (A), showing the subsarcolemmal mitochondria population. Scale bar: 1 μm. The histogram shows the average mitochondrial size from more than 100 mitochondria from matching sections of muscles from WT (black bars) and c-Cbl–deficient (white bars) mice. (B and C) Muscle homogenates were immunoblotted with either antibodies specific for UCP3, pSer79-ACC, ACC, and PGC1α (5 and 15 μg total protein) (B) or antibodies specific for AMPK and pThr172-AMPK (60 μg total protein) (C). The fold increase in protein levels observed in c-Cbl–/– mice compared with WT animals, as well as the result of the statistical analysis of the data, is shown at the right of each lane. Data represent the mean ± SEM of 6 (C) or 12 (B) animals in each group. (D) Histograms show ACC phosphorylation as a ratio of total ACC (top) and AMPK phosphorylation as a ratio of total AMPK (bottom) in quadriceps from WT and c-Cbl–/– mice. *P < 0.05, **P < 0.01.
The increase in total ACC levels that we observed was unexpected, as previous studies have shown that a similar phenotype to that described in c-Cbl–/– mice exists in animals with a global deletion of ACC2 (16). However, the activity of ACC is acutely regulated by phosphorylation, and indeed it has been shown that there is a precise inverse correlation between phosphorylation of ACC and its enzymatic activity (17). Phosphorylation of ACC inhibits its enzymatic activity, thus reducing intracellular malonyl-CoA levels and promoting mitochondrial FFA oxidation (18). Intriguingly, despite the moderate increase in the total level of ACC, we observed a 4-fold increase in ACC phosphorylation in muscle from the c-Cbl–/– mice (Figure 6, B and D). To explore the mechanism for increased ACC phosphorylation in muscle from c-Cbl–/– mice, we next examined the expression and phosphorylation state of the upstream ACC regulator AMP-activated protein kinase (AMPK). Consistent with an increase in AMPK activity and increased ACC phosphorylation, we observed a significant 70% increase in AMPK phosphorylation in muscle from c-Cbl–/– mice with no significant change in total expression (Figure 6, C and D). These results suggest that c-Cbl may be an important upstream regulator of AMPK activity in muscle, and that this effect may be a major contributor to enhanced energy expenditure in these animals.
Discussion
These studies implicate a new role for the E3 ubiquitin ligase c-Cbl in the regulation of whole-body energy expenditure and insulin action. We have found that deletion of c-Cbl in mice results in a 50% reduction in all major adipose tissue beds (and whole-body fat content) combined with a 30% increase in appetite. This phenotype can be explained at least in part by increased whole-body energy expenditure, improved insulin action, hypoleptinemia, and increased activity. The increased energy expenditure may be related to changes in AMPK activity in skeletal muscle leading to increased mitochondrial FFA oxidation (12, 13).
Increased muscle energy expenditure is likely a central feature of the phenotype displayed by the c-Cbl–/– mouse. We present evidence to suggest that the c-Cbl–/– mouse has increased FFA oxidation, as indicated by the reduction in respiratory quotient. A major contributor to this phenotype is likely to be increased AMPK activity and inhibition of ACC, a rate-limiting enzyme for FFA entry into mitochondria. In support of this model, the phenotype of the c-Cbl–/– mice is very similar to that observed in ACC2 knockout mice (16). While it is difficult to pinpoint the precise sequence of events that leads to this phenotype using a global-gene-deletion approach, we believe that the most plausible model is that loss of c-Cbl in muscle somehow augments AMPK activity, triggering increased fuel oxidation, particularly FFAs, which in turn leads to reduced fat mass. Reduced fat mass causes hypoleptinemia, which acts as the major catalyst for the observed orexigenic changes that ultimately contribute to hyperphagia. Increased ambulatory activity is likely a consequence of the hyperphagia, particularly since we observed the major difference in activity during the feeding period (Table 3). It is intriguing that the central changes leading to increased feeding are unable to compensate entirely for the increased energy expenditure, which suggests that the set point for body weight regulation in these animals has been shifted.
What could be contributing to increased muscle AMPK activity in the c-Cbl–/– animals? Adipokines, such as leptin and adiponectin, are thought to play an important role in the regulation of AMPK activity in skeletal muscle (19, 20). It is conceivable, therefore, that c-Cbl regulates the differentiation of a subset of adipocytes that hypersecrete AMPK stimulatory factors. However, this scenario is unlikely to contribute to the phenotype of c-Cbl–/– mice, for several reasons. First, we did not observe any significant change in circulating adiponectin levels in c-Cbl–/– mice (Table 2). Second, leptin levels were actually reduced in these animals (Table 2). Third, we did not observe any significant change in ACC phosphorylation in liver of c-Cbl–/– mice (data not shown), which is not consistent with a major role for a broad-acting circulating factor. However, we cannot exclude the possibility that c-Cbl somehow regulates the release of a factor that controls AMPK activity principally in muscle. A second mechanism that has been shown to play a key role in regulating AMPK activity in muscle is exercise. AMPK facilitates the metabolic response to exercise by triggering processes such as increased glucose transport and fatty acid oxidation (21). Therefore, another possibility is that the increased locomotor activity displayed by c-Cbl–/– mice could provide the driving force for increased muscle AMPK activity. Very little is currently known about the central regulation of activity and its link to feeding behavior, but this is likely to be a very fruitful and exciting area of future investigation.
Increased AMPK activity could also account for other phenotypic changes observed in the c-Cbl–/– mice. AMPK activity has been shown to play an important role in regulating mitochondrial biogenesis in muscle (22, 23). Muscle from the c-Cbl–/– mice displayed mitochondrial hypertrophy. However, it is not clear whether the increased muscle mitochondrial size in the c-Cbl–/– mice reflects changes in mitochondrial biogenesis, changes in mitochondrial fusion, or both. Consistent with increased mitochondrial biogenesis, UCP3 levels in muscle from c-Cbl–/– mice were significantly increased. However, a role for c-Cbl in the regulation of mitochondrial fusion also seems plausible, because we did not observe a significant change in mitochondrial area in the subsarcolemmal region in muscle from c-Cbl–/– mice, and perturbations in mitochondrial fusion have been associated with modifications in both glucose and mitochondrial metabolism (24).
One of the more surprising findings in c-Cbl–/– mice was the increase in whole-body insulin sensitivity. Previous reports (3–6) have suggested that c-Cbl is an integral component of a signaling pathway that regulates insulin-stimulated glucose transport in 3T3-L1 adipocytes. However, a recent study reported that RNA interference–mediated (RNAi-mediated) suppression of c-Cbl in 3T3-L1 adipocytes had no effect on insulin-stimulated glucose transport (25). In the present study we could find no evidence to suggest that lack of c-Cbl contributes to a defect in insulin action. We were unable to find any significant change in insulin-stimulated glucose uptake in adipose tissue in the c-Cbl–/– mice. We also found that glucose tolerance and insulin sensitivity were enhanced in c-Cbl–/– mice, and we observed a substantial increase in insulin-stimulated muscle glucose uptake both in vivo and ex vivo. This is consistent with the important role for insulin action in skeletal muscle in whole-body energy homeostasis as described in other studies looking at muscle-specific deletion of genes that regulate insulin action (26, 27). Improved insulin action likely results from increased energy expenditure, possibly because of reduced fat mass and lower FFA availability in the circulation, and/or the increased activation of AMPK. AMPK has also been implicated as an important regulator of muscle glucose transport during exercise (21). Consistent with such a mechanism, we observed an insulin-independent increase in [3H]-2-DOG uptake in soleus muscle from c-Cbl–/– mice (Figure 4). The increased level of the IR may also contribute to enhanced insulin sensitivity in muscle from the c-Cbl–/– mice. We observed increased IR levels in muscle from c-Cbl–/– mice but not in liver (Figure 5), which suggests that this effect is unlikely to be mediated by a generic mechanism like ubiquitin-targeted degradation. Whereas c-Cbl has clearly been shown to regulate ubiquitination of several tyrosine kinase receptors (1), ubiquitination of the IR is controversial (28, 29). Although it has been suggested that the adaptor protein APS may be required to facilitate IR ubiquitination (28), it is notable that APS–/– mice do not exhibit alterations in IR levels in either skeletal muscle or adipose tissue (30).
In this study we provide evidence to implicate an important role for c-Cbl in pathways regulating whole-body insulin action and energy expenditure. In view of the plethora of biological processes regulated by c-Cbl and the complexity of whole-body fuel homeostasis, we have not yet pinpointed the precise locus of these effects. However, our data suggest that AMPK activation and increased mitochondrial oxidation in skeletal muscle are major factors in the phenotype observed in c-Cbl–deficient animals. This, together with other recent work in this area (12, 13), points to muscle mitochondrial function as a key therapeutic target for the treatment of type 2 diabetes and obesity. Based on our data, we suggest that c-Cbl normally acts as a suppressor of the energy homeostat that regulates lean body mass, in which case one might envisage that overexpression of c-Cbl may lead to increased body weight and insulin resistance. Mapping the molecular role of c-Cbl in energy homeostasis is a high priority and might open new avenues to favorably control body weight in humans even in the face of increased food consumption.
Methods
Animals.
c-Cbl–/– mice were generated as described previously (31). Experiments were performed on mice maintained on the hybrid 129/SvJ C57BL/6 background. The animals were bred and housed in cages and kept on a 12-hour light/dark cycle with free access to food and water. Food intake and body weight were monitored on a weekly basis. All the experiments were carried out with the approval of the Garvan Institute/St. Vincent’s Hospital Animal Experimentation Ethics Committee, following guidelines issued by the National Health and Medical Research Council.
Metabolic assays.
Glucose (2 g/kg glucose i.p.) and insulin (0.5 U/kg insulin i.p.) tolerance tests were performed in overnight-fasted 16- to 18-week-old mice. Blood samples were obtained from the tail tip at the times indicated. Glucose levels were measured using a glucometer (ACCU-CHEK II; Roche Diagnostics Corp.). Insulin concentrations were measured using an ultrasensitive ELISA kit (Mercodia AB). Clearance of the glucose analogue [3H]-2-DOG (2 g/kg glucose i.p., 10 μCi/animal [3H]-2-DOG) into glucose-6-phospate and glycogen in indicated tissues was measured as described previously (32). Other plasma measurements were performed on blood collected from the chest cavity into tubes containing EDTA and centrifuged at 14,000 g for 10 minutes to obtain the plasma. Concentrations of leptin, adiponectin (Linco Research Inc.) and thyroid hormones (total T3 and T4; ICN Pharmaceuticals Inc.) were assayed by RIA. Plasma triglycerides, glycerol, and non-esterified fatty acids were assayed using colorimetric kits (Roche Diagnostics Corp., Sigma-Aldrich and Wako Pure Chemical Industries Ltd., respectively).
Ex vivo glucose uptake.
Glucose uptake in isolated muscles from WT and c-Cbl–/– mice was assayed in sealed conical flasks containing pre-gassed (95% O2/5% CO2) Krebs-Henseleit bicarbonate buffer, pH 7.4, supplemented with 2 mM sodium pyruvate, 8 mM mannitol, and 0.1% wt/vol BSA at 30°C. Muscles were allowed to recover for 10 minutes and incubated without or with insulin for 30 minutes. Glucose uptake was assayed for 16 minutes using [3H]-2-DOG (1 mM 0.128 μCi/ml) as described previously (33). Glucose transport assays on fat explants were performed as described previously (32).
Adipocyte size determination.
Isolated adipocytes were obtained from excised epididymal fat pads by the collagenase method (34). Cells were then fixed with 2% OsO4 in PBS overnight at 37°C. Adipocyte diameter from 100–200 cells was determined using Photoshop software (Adobe Systems Inc.) from images of adipocyte suspensions obtained by light microscopy.
Ambulatory activity.
Spontaneous ambulatory activity of individually housed mice was evaluated over a 24-hour period using acrylic glass chambers (31 cm × 18 cm × 18 cm) and an Opto-Varimex-3 sensor system (Columbus Instruments). Consecutive photobeam breaks occurring in adjacent photobeams were scored as an ambulatory movement. Cumulative ambulatory activity counts were recorded every 20 minutes throughout the light/dark cycles. During the study, mice had ad libitum access to food and water.
Resting metabolic rate.
A custom-built open-circuit respirometer was used to measure rates of oxygen consumption (VO2) and carbon dioxide production (VCO2) in mice at a controlled temperature of 25°C (9). Briefly, air was drawn through the chamber (500 ml total volume) at 400 ml/min. Expired air was dried and then passed through a Qubit S152 infrared CO2 analyzer (Qubit Systems Inc.) and a Servomex 0A 184 paramagnetic O2 analyzer (Servomex Group Ltd.). Baseline values of background O2 and CO2 were established for at least 15 minutes before and after each assessment. All measurements were performed during the light phase between 10 am and 4 pm and control and c-Cbl–/– mice were assessed alternately. All animals were assessed for at least 2 hours under constant observation after a 30-minute acclimation period in the chamber. In view of the small chamber volume, all animals remained sedentary during the recording period. Resting VO2 and VCO2 were determined using a custom Visual Basic program (9). Body temperature was measured using a rectal probe (BAT-10 Digital Thermometer; Physiotemp Instruments Inc.).
Determination of body composition.
Fat and lean body mass was measured using dual-energy x-ray absorptiometry (Lunar PIXImus2 mouse densitometer; GE Healthcare) in accordance with the manufacturer’s instructions.
In situ hybridization.
Coronal slices (20 μm) of fresh-frozen brains were cut and thaw-mounted on charged slides. For in situ hybridization, DNA oligonucleotides complementary to mouse neuropeptide Y mRNA (5′-GAG GGT CAG TCC ACA CAG CCC CAT TCG CTT GTT ACC TAG CAT-3′), mouse cocaine- and amphetamine-regulated transcript mRNA (5′-TCC TTC TCG TGG GAC GCA TCA TCC ACG GCA GAG TAG ATG TCC AGG-3′), mouse corticotropin-releasing hormone mRNA (5′-CCG ATA ATC TCC ATC AGT TTC CTG TTG CTG TGA GCT TGC TGA GCT-3′), and mouse thyrotropin-releasing hormone mRNA (5′-AAC CTT ACT CCT CCA GAG GTT CCC TGA CCC AGG CTT CCA GTT GTG-3′) were labeled with [35S]-thio-dATP (Amersham Biosciences Ltd. or NEN Life Science Products) using terminal deoxynucleotidyl transferase (Roche Diagnostics Corp. or Amersham Biosciences Ltd.). Matching sections from the same portion of the hypothalamus of knockout and control mice were assayed together, following the method of Young (35) with variations (36, 37). mRNA levels were evaluated by measurement of silver grain densities over individual neurons from photoemulsion-dipped sections.
Tissue processing and immunoblotting.
Tissues were rapidly removed from fed WT and c-Cbl–/– mice, frozen in liquid nitrogen, powdered, resuspended in RIPA buffer (PBS, pH 7.5; 1% NP-40; 0.5% sodium deoxycholate; 0.1% SDS) supplemented with protease and phosphatase inhibitors (10 μg/ml phenylmethylsulfonyl fluoride, 10 μg/ml aprotinin, 10 μg/ml leupeptin, 1 mM Na3VO4, 10 mM NaF, 10 mM sodium pyrophosphate), and solubilized for 2 hours at 4°C. Aliquots of tissue homogenates were resolved by SDS-PAGE and immunoblotted with antibodies against GLUT4 (38); the β subunit of the IR, and insulin receptor substrate-1 (Santa Cruz Biotechnology Inc.); syntaxin4 (39); UCP3 (Affinity Bioreagents Inc.); AMPKα, pThr172-AMPK, and pSer79-ACC (Cell Signaling Technology Inc.); ACC (Upstate Biotechnology Inc.); PGC1α (Chemicon International Inc.); and PDGFRβ (Genzyme Corp.). Quantitation of immunolabeled bands was performed using a VersaDoc Imaging System (BioRad Laboratories).
Electron microscopy.
Muscles were removed immediately after euthanasia and cut into slices while immersed in modified Karnovsky’s fixative (2.5% glutaraldehyde/4% paraformaldehyde in 1 M cacodylate buffer, pH 7.4). Samples were further fixed overnight in the same fixative and postfixed with 2% osmium tetroxide, dehydrated through an ascending series of ethanol, and embedded in Spurr’s epoxy resin. Ultrathin sections were cut with a Reichert-Jung ultramicrotome, double-contrasted with uranyl acetate and lead citrate, and viewed and photographed with a Philips CM120 BioTwin transmission electron microscope. Mitochondrial size and cristae density of subsarcolemmal mitochondria from matching sections of muscles from both WT and c-Cbl–/– mice were determined as in ref. 11 using Axiovision software (Carl Zeiss International).
Statistical analysis.
Data are presented as mean ± SEM, and statistical analysis was performed using an unpaired Student’s t test. Differences at P < 0.05 were considered to be statistically significant.
Acknowledgments
This work was supported by the National Health and Medical Research Council of Australia. J.C. Molero was supported by a postdoctoral Formación de Profesorado Universitario fellowship from the Ministry of Science and Culture, Spain. We thank Edna Hardeman and Majid Ghoddusi for performing the electron microscopy studies; David Little, Paul Baldock, and Michelle McDonald for their assistance during dual-energy x-ray absorptiometry analyses; Adrian Cooper for performing the ambulatory activity studies; and the Biological Testing Facility of the Garvan Institute for animal breeding. We also thank members of the James laboratory for useful discussions, as well as Don Chisholm, Shane Grey, and Amanda Sainsbury-Salis for invaluable input.
Footnotes
Nonstandard abbreviations used: ACC, acetyl-CoA carboxylase; AMPK, AMP-activated protein kinase; [3H]-2-DOG, [3H]-2-deoxyglucose; EDL, extensor digitorum longus; IR, insulin receptor; PGC1α, PPARγ coactivator-α; UCP3, uncoupling protein-3.
Conflict of interest: The authors have declared that no conflict of interest exists.
References
- 1.Thien CB, Langdon WY. Cbl: many adaptations to regulate protein tyrosine kinases. Nat. Rev. Mol. Cell Biol. 2001;2:294–307. doi: 10.1038/35067100. [DOI] [PubMed] [Google Scholar]
- 2.Saltiel AR, Pessin JE. Insulin signaling in microdomains of the plasma membrane. Traffic. 2003;4:711–716. doi: 10.1034/j.1600-0854.2003.00119.x. [DOI] [PubMed] [Google Scholar]
- 3.Liu J, Kimura A, Baumann CA, Saltiel AR. APS facilitates c-Cbl tyrosine phosphorylation and GLUT4 translocation in response to insulin in 3T3-L1 adipocytes. Mol. Cell. Biol. 2002;22:3599–3609. doi: 10.1128/MCB.22.11.3599-3609.2002. [DOI] [PMC free article] [PubMed] [Google Scholar]
- 4.Baumann CA, et al. CAP defines a second signalling pathway required for insulin-stimulated glucose transport. Nature. 2000;407:202–207. doi: 10.1038/35025089. [DOI] [PubMed] [Google Scholar]
- 5.Chiang SH, et al. Insulin-stimulated GLUT4 translocation requires the CAP-dependent activation of TC10. Nature. 2001;410:944–948. doi: 10.1038/35073608. [DOI] [PubMed] [Google Scholar]
- 6.Liu J, DeYoung SM, Hwang JB, O’Leary EE, Saltiel AR. The roles of Cbl-b and c-Cbl in insulin-stimulated glucose transport. J. Biol. Chem. 2003;278:36754–36762. doi: 10.1074/jbc.M300664200. [DOI] [PubMed] [Google Scholar]
- 7.Hillebrand JJ, de Wied D, Adan RA. Neuropeptides, food intake and body weight regulation: a hypothalamic focus. Peptides. 2002;23:2283–2306. doi: 10.1016/s0196-9781(02)00269-3. [DOI] [PubMed] [Google Scholar]
- 8.Silva JE. The multiple contributions of thyroid hormone to heat production. J. Clin. Invest. 2001;108:35–37. doi:10.1172/JCI200113397. doi: 10.1172/JCI13397. [DOI] [PMC free article] [PubMed] [Google Scholar]
- 9.Withers PC, Thompson GG, Seymour RS. Metabolic physiology of the north-western marsupial mole, Notoryctes caurinus (Marsupialia: Notoryctidae) Aust. J. Zool. 2000;48:241–258. [Google Scholar]
- 10.Lowell BB, Spiegelman BM. Towards a molecular understanding of adaptive thermogenesis. Nature. 2000;404:652–660. doi: 10.1038/35007527. [DOI] [PubMed] [Google Scholar]
- 11.Schwerzmann K, Hoppeler H, Kayar SR, Weibel ER. Oxidative capacity of muscle and mitochondria: correlation of physiological, biochemical, and morphometric characteristics. Proc. Natl. Acad. Sci. U. S. A. 1989;86:1583–1587. doi: 10.1073/pnas.86.5.1583. [DOI] [PMC free article] [PubMed] [Google Scholar]
- 12.Petersen KF, et al. Mitochondrial dysfunction in the elderly: possible role in insulin resistance. Science. 2003;300:1140–1142. doi: 10.1126/science.1082889. [DOI] [PMC free article] [PubMed] [Google Scholar]
- 13.Petersen KF, Dufour S, Befroy D, Garcia R, Shulman GI. Impaired mitochondrial activity in the insulin-resistant offspring of patients with type 2 diabetes. N. Engl. J. Med. 2004;350:664–671. doi: 10.1056/NEJMoa031314. [DOI] [PMC free article] [PubMed] [Google Scholar]
- 14.Wu Z, et al. Mechanisms controlling mitochondrial biogenesis and respiration through the thermogenic coactivator PGC-1. Cell. 1999;98:115–124. doi: 10.1016/S0092-8674(00)80611-X. [DOI] [PubMed] [Google Scholar]
- 15.Lehman JJ, et al. Peroxisome proliferator–activated receptor γ coactivator-1 promotes cardiac mitochondrial biogenesis. J. Clin. Invest. 2000;106:847–856. doi: 10.1172/JCI10268. [DOI] [PMC free article] [PubMed] [Google Scholar]
- 16.Abu-Elheiga L, Matzuk MM, Abo-Hashema KA, Wakil SJ. Continuous fatty acid oxidation and reduced fat storage in mice lacking acetyl-CoA carboxylase 2. Science. 2001;291:2613–2616. doi: 10.1126/science.1056843. [DOI] [PubMed] [Google Scholar]
- 17.Park SH, et al. Phosphorylation-activity relationships of AMPK and acetyl-CoA carboxylase in muscle. J. Appl. Physiol. 2002;92:2475–2482. doi: 10.1152/japplphysiol.00071.2002. [DOI] [PubMed] [Google Scholar]
- 18.Ruderman NB, Saha AK, Vavvas D, Witters LA. Malonyl-CoA, fuel sensing, and insulin resistance. Am. J. Physiol. 1999;276:E1–E18. doi: 10.1152/ajpendo.1999.276.1.E1. [DOI] [PubMed] [Google Scholar]
- 19.Minokoshi Y, et al. Leptin stimulates fatty-acid oxidation by activating AMP-activated protein kinase. Nature. 2002;415:339–343. doi: 10.1038/415339a. [DOI] [PubMed] [Google Scholar]
- 20.Yamauchi T, et al. Adiponectin stimulates glucose utilization and fatty-acid oxidation by activating AMP-activated protein kinase. Nat. Med. 2002;8:1288–1295. doi: 10.1038/nm788. [DOI] [PubMed] [Google Scholar]
- 21.Musi N, Yu H, Goodyear LJ. AMP-activated protein kinase regulation and action in skeletal muscle during exercise. Biochem. Soc. Trans. 2003;31:191–195. doi: 10.1042/bst0310191. [DOI] [PubMed] [Google Scholar]
- 22.Bergeron R, et al. Chronic activation of AMP kinase results in NRF-1 activation and mitochondrial biogenesis. Am. J. Physiol. Endocrinol. Metab. 2001;281:E1340–E1346. doi: 10.1152/ajpendo.2001.281.6.E1340. [DOI] [PubMed] [Google Scholar]
- 23.Zong H, et al. AMP kinase is required for mitochondrial biogenesis in skeletal muscle in response to chronic energy deprivation. Proc. Natl. Acad. Sci. U. S. A. 2002;99:15983–15987. doi: 10.1073/pnas.252625599. [DOI] [PMC free article] [PubMed] [Google Scholar]
- 24.Bach D, et al. Mitofusin-2 determines mitochondrial network architecture and mitochondrial metabolism. A novel regulatory mechanism altered in obesity. J. Biol. Chem. 2003;278:17190–17197. doi: 10.1074/jbc.M212754200. [DOI] [PubMed] [Google Scholar]
- 25.Mitra P, Zheng X, Czech MP. RNAi-based analysis of CAP, Cbl and CrkII function in the regulation of GLUT4 by insulin. J. Biol. Chem. 2004;279:37431–37435. doi: 10.1074/jbc.C400180200. [DOI] [PubMed] [Google Scholar]
- 26.Zisman A, et al. Targeted disruption of the glucose transporter 4 selectively in muscle causes insulin resistance and glucose intolerance. Nat. Med. 2000;6:924–928. doi: 10.1038/78693. [DOI] [PubMed] [Google Scholar]
- 27.Bruning JC, et al. A muscle-specific insulin receptor knockout exhibits features of the metabolic syndrome of NIDDM without altering glucose tolerance. Mol. Cell. 1998;2:559–569. doi: 10.1016/s1097-2765(00)80155-0. [DOI] [PubMed] [Google Scholar]
- 28.Ahmed Z, Smith BJ, Pillay TS. The APS adapter protein couples the insulin receptor to the phosphorylation of c-Cbl and facilitates ligand-stimulated ubiquitination of the insulin receptor. FEBS Lett. 2000;475:31–34. doi: 10.1016/s0014-5793(00)01621-5. [DOI] [PubMed] [Google Scholar]
- 29.Mori S, Claesson-Welsh L, Okuyama Y, Saito Y. Ligand-induced polyubiquitination of receptor tyrosine kinases. Biochem. Biophys. Res. Commun. 1995;213:32–39. doi: 10.1006/bbrc.1995.2094. [DOI] [PubMed] [Google Scholar]
- 30.Minami A, et al. Increased insulin sensitivity and hypoinsulinemia in APS knockout mice. Diabetes. 2003;52:2657–2665. doi: 10.2337/diabetes.52.11.2657. [DOI] [PubMed] [Google Scholar]
- 31.Murphy MA, et al. Tissue hyperplasia and enhanced T-cell signalling via ZAP-70 in c-Cbl-deficient mice. Mol. Cell. Biol. 1998;18:4872–4882. doi: 10.1128/mcb.18.8.4872. [DOI] [PMC free article] [PubMed] [Google Scholar]
- 32.Cooney GJ, et al. Improved glucose homeostasis and enhanced insulin signalling in Grb14-deficient mice. EMBO J. 2004;23:582–593. doi: 10.1038/sj.emboj.7600082. [DOI] [PMC free article] [PubMed] [Google Scholar]
- 33.Viollet B, et al. The AMP-activated protein kinase α2 catalytic subunit controls whole-body insulin sensitivity. J. Clin. Invest. 2003;111:91–98. doi:10.1172/JCI200316567. doi: 10.1172/JCI16567. [DOI] [PMC free article] [PubMed] [Google Scholar]
- 34.Rodbell M. Metabolism of isolated fat cells. I. Effects of hormones on glucose metabolism and lipolysis. J. Biol. Chem. 1964;239:375–380. [PubMed] [Google Scholar]
- 35.Young WS., 3rd In situ hybridization histochemical detection of neuropeptide mRNA using DNA and RNA probes. Methods Enzymol. 1989;168:702–710. doi: 10.1016/0076-6879(89)68051-2. [DOI] [PubMed] [Google Scholar]
- 36.Tsunashima K, Schwarzer C, Kirchmair E, Sieghart W, Sperk G. GABA(A) receptor subunits in the rat hippocampus III: altered messenger RNA expression in kainic acid-induced epilepsy. Neuroscience. 1997;80:1019–1032. doi: 10.1016/s0306-4522(97)00144-9. [DOI] [PubMed] [Google Scholar]
- 37.Schalling M, et al. Neuropeptide tyrosine in the rat adrenal gland: immunohistochemical and in situ hybridization studies. Neuroscience. 1988;24:337–349. doi: 10.1016/0306-4522(88)90335-1. [DOI] [PubMed] [Google Scholar]
- 38.Robinson LJ, Pang S, Harris DS, Heuser J, James DE. Translocation of the glucose transporter (GLUT4) to the cell surface in permeabilized 3T3-L1 adipocytes: effects of ATP insulin, and GTP gamma S and localization of GLUT4 to clathrin lattices. J. Cell Biol. 1992;117:1181–1196. doi: 10.1083/jcb.117.6.1181. [DOI] [PMC free article] [PubMed] [Google Scholar]
- 39.Tellam JT, et al. Characterization of Munc-18c and syntaxin-4 in 3T3-L1 adipocytes. Putative role in insulin-dependent movement of GLUT-4. J. Biol. Chem. 1997;272:6179–6186. doi: 10.1074/jbc.272.10.6179. [DOI] [PubMed] [Google Scholar]


