

Abstract
Hypoxia promotes not only the invasiveness of tumor cells, but also chemoresistance in cancer. Tumor associated macrophages (TAMs) residing at the site of hypoxic region of tumors have been known to cooperate with tumor cells, and promote proliferation and chemoresistance. Therefore, there is an urgent need for new strategies to alleviate tumor hypoxia and enhance chemotherapy response in solid tumors. Herein, we have taken advantage of high accumulation of TAMs in hypoxic regions of tumor and high reactivity of manganese dioxide nanoparticles (MnO2 NPs) toward hydrogen peroxide (H2O2) for the simultaneous production of O2 and regulation of pH to effectively alleviate tumor hypoxia by targeted delivery of MnO2 NPs to the hypoxic area. Furthermore, we also utilized the ability of hyaluronic acid (HA) modification in reprogramming anti-inflammatory, pro-tumoral M2 TAMs to pro-inflammatory, antitumor M1 macrophages to further enhance the ability of MnO2 NPs to lessen tumor hypoxia and modulate chemoresistance. The HA-coated, mannanconjugated MnO2 particle (Man-HA-MnO2) treatment significantly increased tumor oxygenation and down-regulated hypoxia-inducible factor-1 α (HIF-1α) and vascular endothelial growth factor (VEGF) in the tumor. Combination treatment of the tumors with Man-HA-MnO2 NPs and doxorubicin significantly increased apparent diffusion coefficient (ADC) values of breast tumor, inhibited tumor growth and tumor cell proliferation as compared with chemotherapy alone. In addition, the reaction of Man-HA-MnO2 NPs toward endogenous H2O2 highly enhanced T1- and T2-MRI performance for tumor imaging and detection.
Keywords: hypoxia, tumor associated macrophages (TAMs), chemotherapy response, manganese dioxide (MnO2), hyaluronic acid (HA), mannose receptor
Hypoxia, defined as a decrease of tissue oxygen level, is a characteristic feature of locally advanced solid tumors, resulting from an imbalance between the intake and consumption of oxygen caused by abnormal vessels in the tumor and the rapid proliferation of cancer cells.1 Hypoxia represents a key microenvironmental stressor governing multiple phenomena associated with tumor progression such as proliferation, angiogenesis and metastasis.2 Hypoxia not only promotes the invasiveness of malignant cells, but also negatively impacts on the efficacy of radio- and chemotherapy,3 and the survival rate of patients with severely hypoxic tumors is lower than patients with less hypoxic tumors.4 Therapeutic resistance caused by hypoxia is partly because some drugs and radiation require oxygen to be maximally cytotoxic. The decreased drug bioavailability because of abnormal vascularization in hypoxic region of tumors also contributes to chemoresistance. Various strategies have been proposed to alleviate tumor hypoxia to surmount hypoxia-associated therapeutic resistance, including hyperbaric oxygen therapy,5 combination of oxygen-rich gas and vasodilating agents,6 and reducing the rate of oxygen consumption.7 Unfortunately, the utility of these methods in clinical settings is limited because of safety concerns, limited O2 loading capacity, and inefficient drug delivery to the hypoxic region. Therefore, there is an urgent need for new strategies to alleviate tumor hypoxia in order to enhance chemotherapy response in solid tumors.
Hypoxic regions of solid tumors are often characterized by high accumulation of macrophages.8 Tumor hypoxia is instrumental in macrophage recruitment and polarization.9 The infiltrated macrophages initially have an M1-polarized phenotype. However, continued presence in tumor microenvironment polarizes them to M2-skewed tumor-associated macrophages (TAMs).10 The classic pro-inflammatory M1 phenotype exerts antiproliferative and cytotoxic activities, resulting partly from their ability to secrete reactive nitrogen and oxygen species (e.g., hydrogen peroxide, NO, peroxynitrite, and superoxide) and proinflammatory cytokines (e.g., TNF, IL-1, and IL-6).11 In contrast, the M2 “repair” designation broadly refers to macrophages that function in constructive processes like wound healing and tissue repair, and those that turn off damaging immune system activation by producing anti-inflammatory cytokines like IL-10.11,12 TAMs are known to respond rapidly to hypoxia with altered gene expression, such as up-regulation of hypoxia-inducible factors (HIFs), vascular endothelial growth factor (VEGF) and matrix metalloproteinase (MMP)-7. The educated TAMs by hypoxia contribute to tumor progression via several mechanisms, including induction of angiogenesis, remodeling of the extracellular matrix, stimulation of cancer cell proliferation and metastasis, and the inhibition of adaptive immunity.9,13 Furthermore, recent evidence shows that TAMs may also be associated with chemoresistance of cancer.14,15 The strong tumor hypoxia and a high density of hypoxic TAMs have been shown to correlate with a decreased survival rate. Given their propensity for hypoxic areas, it has been suggested that macrophages could be used as delivery vehicles to hypoxia.16 In addition, re-educating TAMs is proposed to be an efficient strategy to inhibit tumor progression and metastasis in breast cancer,3,17 which would regulate hypoxia and modulate tumor microenvironment. Here, we took advantages of high accumulation of TAMs in the hypoxic region of tumor and high reactivity of manganese dioxide nanoparticles (MnO2 NPs) toward hydrogen peroxide (H2O2)18,19 for the simultaneous production of O2 and regulation of pH to effectively lessen tumor hypoxia by targeted delivery of MnO2 NPs to hypoxia. Furthermore, we also utilized the ability of hyaluronic acid (HA) modification in reprogramming anti-inflammatory, pro-tumoral M2 TAMs to pro-inflammatory, antitumor M1 macrophages20,21 to further enhance the ability of Man-HA-MnO2 NPs to alleviate tumor hypoxia and modulate chemoresistance (Scheme 1).The high level of H2O2 secreted by TAMs activated by HA-modified MnO2 NPs allowed sufficient reaction with Man-HA-MnO2 NPs to release large amount of O2. In addition, the released Mn2+ ions from the reaction of Man-HA-MnO2 NPs toward H2O2 highly enhanced T1- and T2-MRI performance for tumor imaging and detection.
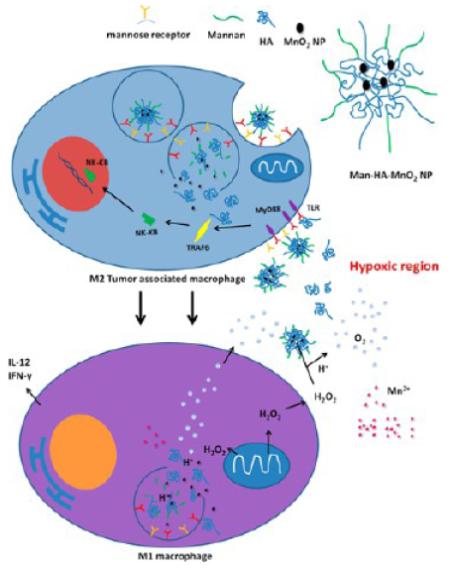
Scheme 1.

Multifunctionality of Man-HA-MnO2 NPsa
aMnO2 particles (~15 nm) are entrapped in hyaluronic acid (HA) with mannan molecules attached. When Man-HA-MnO2 NPs are recognized and uptaken by mannose receptor of TAMs, hyaluronic acid (HA) reprograms anti-inflammatory, pro-tumoral M2 TAMs to pro-inflammatory, antitumor M1 macrophages, which might be via a TLR2-MyD88-IRAK1-TRAF6-PKCζ-NK-κB-dependent pathway. The reprogrammed M1 macrophages secrete high level of IL-12, IFN-γ and H2O2. The high reactivity of MnO2 NPs toward H2O2 allows for the simultaneous production of O2 and Mn2+ ions and regulation of pH of tumor hypoxia. Once MnO2 NPs are reduced into Mn2+ ions, they exhibit strong enhancement in both T1- and T2-weighted MRI.
Manganese(II) salts have been demonstrated as alternative contrast agents (CAs) for T1-weighted MRI as a potential substitute for clinically used gadolinium (Gd)-based CAs due to their improved biocompatibility over Gd-based agents, such as MnCl2,22 manganese chelates23,24 and MnO nanoparticles.25 Although MnO2 nanoparticles have considerably lower T1-MRI performance than commercial Gd-based CAs, MnO2 has the ability to react quickly with H2O2 under acidic condition and simultaneously produce O2 and Mn2+ ions that significantly enhance T1-MRI performances for tumor imaging and detection.26 In addition, manganese is an essential element for physiological metabolism and in vivo biological systems can efficiently control its homeostasis. Thus, suitably surface modified MnO2 NPs would be a promising T1-weighted MRI CA for tumor imaging and tumor hypoxia detection.
RESULTS AND DISCUSSION
Characteristics of Man-HA-MnO2 NPs
The synthesis of MnO2 nanoparticles was conducted according to a reported procedure with some modifications.19 Typically, MnO2 nanoparticles were prepared by reducing manganese permanganate (KMnO4) to MnO2 with cationic polyelectrolyte poly-(allylamine hydrochloride) (PAH) (Figure 1A). The poly-electrolyte-coated MnO2 colloidal nanoparticles are stable and dispersed well in distilled deionized (DDI) water with an average nanoparticle (NP) size of 15 nm (Figure 1B) and positive charge (zeta potential, + 28.7 mV) (Figure 1C), while in saline and cell medium, they are unstable (Figure 1D), causing cell toxicity. It is reported that hyaluronic acid (HA) has immunotoxicological effect on macrophages, which can activate macrophages and increase the production of endogenous reactive oxygen species (ROS).20,21 Herein, we question whether HA has the ability to shape the inflammatory behavior of TAMs and contribute to macrophage polarization. Furthermore, to improve the biocompatibility of MnO2 NPs, we conjugated HA to polyelectrolyte-coated MnO2 NPs and obtained HA-MnO2 NPs (Figure S1A). The HA-MnO2 nanoparticles were around 180 nm in size, negatively charged (−36.5 mV), and stable in cell medium and saline (Figure 1), while maintaining the reactivity of MnO2 toward H2O2 to produce O2. TAMs with M2 phenotype are characterized by high expression of mannose receptors.27 For targeted delivery of HA-MnO2 NPs to TAMs, we coated HA-MnO2 NPs with mannan that targets to mannose receptor on the surface of TAMs. Mannan modification masked the negative charges on the HA-MnO2 NPs and increased their size as well (Figure 1, Figure S1B). The total ligand-to-carrier weight ratio was optimized by measuring the change in zeta potential (Figure S1C). The optimum ratio was obtained at 2:5. Mean particle size and zeta potential of MnO2 nanoparticles, HA-MnO2 nanoparticles and mannan-modified HA-MnO2 nanoparticles (Man-HA-MnO2 NPs) were summarized in Table 1. Cytotoxicity of Man-HA-MnO2 NPs and MnO2 NPs was assessed by a MTT assay, and the results showed that after 4 h of incubation, over 90% of cells remained alive in the presence of 10 mM Mn equivalent of Man-HA-MnO2 NPs, whereas only 40% cells survived at the same Mn concentration of MnO2 NPs without HA coating (Figure S1D).
Figure 1.

Characterization of Man-HA-MnO2 NPs: (A) UV–vis absorption spectra of KMnO4 solution, MnO2 NPs, HA-MnO2 NPs and Man-HA-MnO2 NPs. After the reaction with PAH, the KMnO4 peaks (315, 525, and 545 nm) disappeared, and a new peak at 300 nm appeared, indicating the formation of MnO2 NPs. (B) Zeta potentials of MnO2 NPs, HA-MnO2 NPs and Man-HA-MnO2 NPs. (C) Size distribution of different NPs. (D) Picture of MnO2 NPs and Man-HA-MnO2 NPs in various aqueous media: DDI water, saline (pH = 7.4), and DMEM cell medium containing 10% fetal bovine serum. MnO2 NPs undergo aggregation in saline and cell culture medium, Man-HA-MnO2 NPs are stable in these media.
Table 1.
Particle Size and Zeta Potential of MnO2 NPs, HA-MnO2 NPs, and Man-HA-MnO2 NPs (Mean ± SD, n = 3)
| sample | mean particle size (nm) | zeta potential (mV) |
|---|---|---|
| MnO2 NPs | 15 ± 3.2 | +28.7 ± 1.32 |
| HA-MnO2 NPs | 180 ± 5.6 | −36.5 ± 4.22 |
| Man-HA-MnO2 NPs | 203 ± 4.6 | −11.5 ± 2.23 |
To investigate whether conjugation of mannan on the surface of NPs enhances the binding to M2 macrophages, the association of Man-HA-MnO2 NPs and HA-MnO2 NPs with M2 macrophages was compared by confocal microscopy. M2 macrophages were generated by pretreating RAW264.7 cells with IL-4 for 24 h. After incubation of M2 macrophages with Man-HA-MnO2 NPs or HA-MnO2 NPs at 4 °C for 1 h, a significantly higher level of association of fluorescently labeled Man-HA-MnO2 NPs with M2 macrophages in culture was observed, as compared with macrophages incubated with untargeted control HA-MnO2 NPs (Figure S2A). The association of nanoparticles was further quantified by measuring the percentage of positive cells and fluorescence intensity using flow cytometry. As shown in Figure S2B and C, after 1 h incubation, 5-fold more positive cells in the Man-HA-MnO2 NP group were found than those in the HA-MnO2 NP group. The mean fluorescence intensity of macrophages with Man-HA-MnO2 NPs was 180 au, while that for HA-MnO2 NPs was only 11 au (p = 0.002, Figure S2C). These results demonstrate the specificity of Man-HA-MnO2 NPs toward M2 macrophages in vitro.
As shown in Scheme 1, the reaction between MnO2 and H2O2 leads to the decomposition of H2O2, the consumption of H+ ions, and simultaneous production of O2 and Mn2+ ions. The high reactivity of MnO2 toward H2O2 and its ability in fully recovering the oxygen therein render MnO2 attractive in applications as catalysts and batteries.18 To investigate whether HA conjugation and mannan modification would affect the reactivity of MnO2 toward H2O2, we incubated Man-HA-MnO2 NPs with H2O2 in phosphate buffer at pH 6.5, and measured H2O2 level, change of pH, and the production of Mn2+ continuously. We observed that 300 μM H2O2 was able to be completely quenched by 50 μM of Man-HA-MnO2 NPs at pH 6.5 in 60 min (Figure S3A), accompanied by an increase in the pH of phosphate buffer from 6.5 to 7.8 (Figure S3B). MnO2 has considerably low T1- and T2-MRI performances. Once reduced into Mn2+ ions, they exhibit much stronger enhancement in both T1- and T2-weighted MRI than MnO2.28 Therefore, the Mn2+ ion generating properties of the NPs can be investigated by measuring the changes of T1 and T2 signals. The continuous enhancement in T1 and T2 signals was obviously a result of Mn2+ ion generation from the reaction of Man-HA-MnO2 NPs with H2O2 (Figure S3C,D). These data suggest that H2O2 can easily diffuse across the polyelectrolyte-HA complex and have access to the reactive sites of MnO2. Furthermore, the rapid reaction was not affected by HA conjugation and mannan modification as H2O2 was quenched by Man-HA-MnO2 NPs and MnO2 NPs at the same rate, and the consumption of H+ ions and production of Mn2+ ions upon the reaction of Man-HA-MnO2 NPs toward H2O2 were similar to that of MnO2 at the same concentration.
To evaluate the effectiveness of Man-HA-MnO2 NPs as a H2O2-active MRI contrast agent, longitudinal and transverse relaxation rates of Man-HA-MnO2 NPs after being reduced by H2O2 were examined. Longitudinal relaxivity r1 and transverse relaxivity r2, obtained by measuring the relaxation rate as a function of Mn concentration showed marked enhancement, when Man-HA-MnO2 NPs were reduced to Mn2+ by H2O2. After H2O2 reduction, the r1 and r2 values of Man-HA-MnO2 NPs were as high as 7.71 and 45.06 mM−1 s−1 at 25 °C and 9.4 T field strength, respectively, which were 64- and 109-fold higher than those before H2O2 reduction (r1 = 0.12 mM−1 s−1, r2 = 0.41 mM−1 s−1, Figure S4). The r1 value is comparable to that of commercial Gd-DPTA (r1 = 5.6 mM−1 s−1 at 25 °C, 9.4 T). The low r1 value of initial Man-HA-MnO2 NP is due to the high valence (IV) of manganese and shielding from the aqueous environment.29,30 Once Man-HA-MnO2 NPs are reduced, released Mn2+ ions easily access to surrounding water molecules and significantly enhance water proton relaxation. Furthermore, each ion can serve as an MRI contrast agent and , thus, dramatically enhances transverse and longitudinal relaxation times of the protons.
In Vitro Reaction of Man-HA-MnO2 NPs toward H2O2
MnO2 has shown high reactivity and specificity toward H2O2 to produce O2 and Mn2+ by consuming H+ ions. The production of O2 and increase in the local pH by reaction of MnO2 toward H2O2 can be particularly useful for improving oxygen level and regulation of local pH in tumor tissue, which would provide opportunity to attenuate tumor hypoxia and modulate solid tumor microenvironment. It is known that HA has immunotoxicological effects on macrophages, which can activate macrophages and increase endogenous H2O2 production.21 We hypothesized that the Man-HA-MnO2 NPs could be taken up by M2 macrophages and lead to significantly elevated production of H2O2. We also questioned whether NPs could react quickly with H2O2 produced in situ. To test the hypothesis and address the question, we first examined the cellular uptake of the NPs by incubating M2 macrophages with fluorescently labeled Man-HA-MnO2 NPs at 37 °C, and observed significant cellular uptake of the NPs after incubation for 1 h (Figure S5A). We then incubated M2 macrophages (generated from RAW264.7 cells) with Man-HA-MnO2 NPs at pH 6.5, and measured H2O2 level, changes of pH, and the production of Mn2+ continuously. After an initial decrease in H2O2 level in the first 20 min, a continuous increase in H2O2 level in 60 min was observed and accompanied by an increase in the pH of cell culture medium from pH 6.5 to 7.8 and continuous enhancements in T1- and T2-weighted MRI contrast signals, indicating that endogenous H2O2 released by macrophages in vitro is sufficient to react with NPs. In addition, to investigate the effect of Man-HA-MnO2 NPs on H2O2 production by M2 macrophages, we determined H2O2 levels of the medium after incubating M2 macrophages with Man-HA-MnO2 NPs at different concentrations (0.5, 2.5, and 5 μM). We observed elevated level of H2O2 with increased amount of Man-HA-MnO2 NPs after 1 h incubation (Figure S5C), indicating that Man-HA-MnO2 NPs have the ability to increase endogenous H2O2 production.
Biodistribution and Tumor Accumulation of Man-HA-MnO2 NPs
Noninvasive near-infrared fluorescence (NIRF) optical imaging was utilized to monitor the in vivo biodistribution and tumor accumulation of Man-HA-MnO2 NPs. We injected 4T1 tumor-bearing mice with near-infrared dye Cy5.5-labeled Man-HA-MnO2 NPs via tail vein. The in vivo NIRF optical images demonstrated steady increase of tumor uptake of Man-HA-MnO2 NPs after intravenous (iv) injection, which peaked at 6 h and then plateaued over time (Figure 2A,B). At 24 h postinjection, tumors and major organs were excised for ex vivo NIRF imaging to determine the tissue distribution of Man-HA-MnO2 NPs. As shown in Figure 2C,D, Man-HA-MnO2 NPs demonstrated good tumor accumulation and relatively low liver uptake. To confirm tumor accumulation of Man-HA-MnO2 NPs, we also investigated the biodistribution of free Cy5.5 dye and observed an obvious distinction of tumor accumulation between Man-HA-MnO2 NPs and the free dye. Free Cy5.5 dye showed an initial maximal tumor fluorescence followed by rapid clearance with time (Figure 2A,B). Biodistribution of free Cy5.5 at 24 h postinjection (pi) showed high kidney accumulation and low tumor retention (Figure 2C,D), indicating that free Cy5.5 was mainly eliminated from the renal route. These data demonstrated that the Cy5.5 label was not removed from NPs prematurely and the high fluorescence intensity in the tumor was resulted from high accumulation of Man-HA-MnO2 NP, not free Cy5.5. The biodistribution of Man-HA-MnO2 NPs was confirmed by ICP-MS for quantification of Mn2+ (Figure S6).
Figure 2.

Biodistribution of Man-HA-MnO2 NPs: (A) Representative optical images of 4T1 tumor-bearing mice iv injected with Cy5.5-labeled Man-HA-MnO2 NPs or free Cy5.5 at different time points. (B) A steady increase of tumor uptake of Man-HA-MnO2 NPs after iv injection, which peaked at 6 h and then plateaued over time. Free Cy5.5 dye showed an initial maximum of tumor fluorescence followed by rapid clearance with time. (C and D) Biodistribution of Man-HA-MnO2 NPs and free Cy5.5 at 24 h pi (n = 3/group). Error bars are standard error of the mean. Man-HA-MnO2 NPs demonstrated good tumor accumulation and relatively low liver uptake, whereas free Cy5.5 showed high kidney accumulation and low tumor retention. (E) Representative immunofluorescence images of tumor sections after Man-HA-MnO2 NP administration. Man-HA-MnO2 NPs (orange) were taken up by TAMs (green) which were identified by the staining of CD206 M2 macrophage marker. Magnification 100× (top); scale bar 100 μm. Magnification 600× (bottom); scale bar 20 μm.
In addition, to determine whether Man-HA-MnO2 NPs can be uptaken by TAMs in the tumor, 4T1 tumor mice were iv injected with Cy5.5 dye labeled Man-HA-MnO2 NPs. Tumors were collected and subjected to immunostaining with CD206 M2 macrophage marker at 24 h after injection. The microscopic analysis of tumor sections indicated that Man-HA-MnO2 NPs were taken up by TAMs which were identified by the staining of CD206 M2 macrophage marker (Figure 2E). The data demonstrated that Man-HA-MnO2 NPs could be successfully delivered to TAMs in vivo, which would allow the reaction of Man-HA-MnO2 NPs toward endogenous H2O2, leading to O2 release in the hypoxic tumor region.
Man-HA-MnO2 NPs Prime Tumor Associated Macrophages toward M1-like Macrophages
It is known that HA has immunotoxicological effect toward macrophages, which can activate macrophages and increase endogenous H2O2 production.20,21 Interestingly, we observed that Man-HA-MnO2 NPs can also significantly increase H2O2 production. We further questioned whether Man-HA-MnO2 NPs have immunological effect on macrophage polarization. We pretreated RAW264.7 cells with IL-4 for 24 h to generate M2 macrophages,31 then incubated them with Man-HA-MnO2 NPs (5 μM Mn and 15 μM HA), MnO2 NPs (5 μM Mn), HA (15 μM) or mannan (3 μM) for 1 h, followed by incubation with the antibodies against different cell markers: iNOS was chosen as a typical marker for M1 phenotype, while CD206 was for M2. Flow cytometry analysis was performed to quantify the expression M1/M2 ratio. We observed that expression of iNOS was significantly increased on macrophages treated with Man-HA-MnO2 NPs and HA but not MnO2 NPs at the same Mn concentration, while their expression of CD206 was decreased, suggesting that Man-HA-MnO2 NPs induced the polarization of M2 macrophages to M1 (Figure 3A). Mannan alone showed no effect on macrophage polarization. Moreover, this M1 polarization was further confirmed by the cytokine secretion experiment. After incubation with Man-HA-MnO2 NPs or HA, macrophages secreted higher level of IL-12, a typical M1-type cytokine, and lower level of IL-10, a typical M2-type cytokine, than the untreated ones (Figures 3C and S7). The TAMs were collected and the effect of Man-HA-MnO2 NPs on macrophage polarization was confirmed (Figure S8).
Figure 3.

Man-HA-MnO2 NPs prime M2 macrophages toward M1 macrophages: (A and B) Flow cytometric analysis of expression of iNOS (M1 macrophage marker) and CD206 (M2 macrophage marker) after administration of Man-HA-MnO2 NPs (5 μM Mn, 15 μM HA), MnO2 NPs (5 μM Mn), HA (15 μM) or mannan (3 μM). Man-HA-MnO2 NPs increased expression of iNOS and decreased expression of CD206. IL-4 switched RAW 264.7 cells to M2 phenotype. (C) Man-HA-MnO2 NPs altered the cytokine secretion of M2 macrophage measured by ELISA (n = 3/group). Error bars are standard error of the mean. *p < 0.05 as compared to saline control.
Upon activation, M1 macrophages produce high level of H2O2. To investigate the effect of Man-HA-MnO2 NPs on H2O2 production, we incubated M2 macrophages generated from RAW264.7 cells with Man-HA-MnO2 NPs or MnO2 NPs at different concentrations (0.5, 2.5, and 5 μM Mn) for 1 h, and then determined H2O2 level in the medium. After 1 h incubation, the level of H2O2 was significantly increased with increasing amount of Man-HA-MnO2 NPs, while MnO2 NPs alone showed no effect on H2O2 production. The H2O2 production in a Man-HA-MnO2 NP dose dependent manner further confirmed that M1 polarization was induced by Man-HA-MnO2 NPs (Figure S5C).
To further evaluate the effect of Man-HA-MnO2 NPs on polarization of TAMs in vivo, 4T1 tumor mice were iv injected with 13.2 mg/kg Man-HA-MnO2 NPs. Tumors were collected and subjected to immunostaining with CD206 and IL-10 M2 macrophage markers and iNOS and IL-12 M1 macrophage markers at 48 h after injection. Similar to the in vitro results, the percentage of M2 macrophages in tumors decreased, while that of M1 macrophages increased. TAMs are known to be prominent in hypoxic regions proximal to sites of necrosis and poor vascularization. TAM accumulation also often occurs in margination zones that surround islands of burgeoning tumor cells and in association with the tumor vasculature. While M1 macrophages are known to preferentially concentrate in margination zones surrounding tumor islands. We observed that the distribution of M2 macrophages was decreased in the hypoxic region, while M1 macrophages increased after Man-HA-MnO2 NP administration (Figure 4A). To quantify this observed phenomenon, a multimarker flow cytometry protocol was performed to determine macrophage population in the tumors. The ratio of M2 macrophages to M1 macrophages (M2/M1) was calculated. A decrease in M2/M1 ratio was observed after Man-HA-MnO2 NP administration (Figure 4B). These data indicate that Man-HA-MnO2 NPs can successfully skew TAMs away from the M2 phenotype to a tumor-inhibiting M1 phenotype. In addition, the level of H2O2 in the tumors after Man-HA-MnO2 NP treatment was significantly increased in a NP dose dependent manner, further suggesting that Man-HA-MnO2 NPs can induce TAMs to M1 polarization (Figure S6). The high level of H2O2 secreted by Man-HA-MnO2 NPs activated TAMs would provide large amount of O2 release by reaction with Man-HA-MnO2 NPs in the hypoxic region of the tumor.
Figure 4.

Man-HA-MnO2 NPs skew TAMs M2 phenotype toward M1 phenotype: (A) Representative immunofluorescence images of tumor sections stained with M1 and M2 macrophage marker (green) after Man-HA-MnO2 NP administration. The orange dots are Man-HA-MnO2 NPs. Magnification 100 ×; scale bar 100 μm. (B) Flow cytometric analysis of phenotype of macrophages in tumors after administration of Man-HA-MnO2 NPs (n = 5/group). Error bars are standard error of the mean. *p < 0.05 compared to untreated control.
The high molecular weight hyaluronan (HA), a ubiquitously distributed extracellular matrix component, plays a critical role in ensuring tissue integrity and water balance. However, upon tissue injury, breakdown products of the extracellular matrix (lower molecular weight fragments) in turn activate an innate immune response. A large body of literature pointed out that low molecular weight HA (LMW HA) may function as an alarm signal to the immune system, particularly for monocytes/macrophages,20,21,32,33 and that LMW HA may activate the innate immune response via a TLR2-MyD88-IRAK1-TRAF6-PKCζ-NK-κB or TLR4-TRIF-TBK1-IRF3-dependent pathway.32,33 Furthermore, HA-based nanoparticles were found to exert immunotoxicological effects on macrophages. In the present study, we investigated the immunological effect of HA on macrophage polarization and observed that expression of iNOS was significantly up-regulated, while the expression of CD206 was reduced after HA treatment (Figure 3A). Furthermore, after incubation with HA, macrophages secreted higher level of IL-12 and lower level of IL-10 than the untreated ones (Figures 3C and S7), indicating that HA has the ability to prime M2 macrophages toward M1 phenotype. The immunological effect of HA on macrophage polarization may account for the ability of our Man-HA-MnO2 NPs in changing TAM polarization from the M2 phenotype to a tumor-inhibiting M1 phenotype, since the same effect was not found after giving MnO2 NPs. In addition, we observed that the effect of HA on macrophage polarization was not as strong as Man-HA-MnO2 NPs at the same HA concentration. Higher uptake of Man-HA-MnO2 NPs by macrophages may explain the stronger immunological effect of Man-HA-MnO2 NPs than HA, since macrophages prefer to recognize and take up bigger particles.
Effect of Man-HA-MnO2 NPs on MR Signal
The MnO2 NPs have lower T1 and T2 signals than free Mn2+ ions at the same manganese concentration because of the high valence (IV) of manganese.29,30 In addition, Mn atoms in MnO2 nanoparticles are coordinated in octahedral geometry to six oxygen atoms and shielded from aqueous environment, making no contribution to the protons’ longitudinal or transverse relaxation.28 Once MnO2 NPs are reduced, Mn2+ ions are easily accessible to surrounding water molecules and significantly enhance water proton relaxation. Besides being an MRI contrast agent, the production of Mn2+ ions would be a suitable indicator for the reaction of MnO2 NPs toward H2O2, which was accompanied by O2 release. The in vivo NIRF optical images have demonstrated steady increase of tumor uptake of Man-HA-MnO2 NPs until reaching a plateau at 6 h after iv injection. Therefore, to investigate the reaction of Man-HA-MnO2 NPs toward H2O2 in vivo and evaluate whether Man-HA-MnO2 NPs is suitable for tumor imaging, 4T1 tumor mice were treated with Man-HA-MnO2 NPs at different doses (3.3, 13.2, and 26.4 mg/kg) and subjected to MRI before and 6 h postinjection. We observed significant enhancement of T1 and T2 signals of tumors and dramatic changes in T1 and T2 values of tumors at 6 h after injection (Figure 5). Furthermore, the enhancement of T1- and T2-weighted MRI contrast signals of tumors was in a NP dose dependent manner. A linear association between the NP dose and the change in the T1 and T2 relaxation rate (ΔT1 and ΔT2) of tumor was observed, indicating that Man-HA-MnO2 NPs can act as a H2O2-active MRI contrast agent. These data also demonstrate that Man-HA-MnO2 NPs could react quickly with endogenous H2O2 and produce Mn2+ in the tumor. Besides large amount of Mn2+ generation, the dramatic enhancement of T1- and T2-weighted MRI contrast would be attributed to the significantly high level of H2O2 released by skewed M1 macrophages, which was much higher than that of untreated tumors and led to quick reaction with Man-HA-MnO2.
Figure 5.

Effect of Man-HA-MnO2 NPs on T1- and T2-weighted MR signals, and T1 and T2 relaxation of tumors: (A) Representative T1- and T2-weighted MR images and T1 and T2 maps of tumors before and 6 h after iv injection of Man-HA-MnO2 NPs. (B) The significant enhancements of T1- and T2-weighted MRI contrast signals of tumors and dramatic changes in T1 and T2 values of tumors in a NP dose-dependent manner at 6 h after injection of Man-HA-MnO2 NPs (n = 5/group). Error bars are standard error of the mean. *p < 0.05, **p < 0.005 of T1- and T2-weighted MR images and T1 and T2 values as compared to the saline group. (C) A linear association between the NP dose and the change in the T1 and T2 relaxation rate (ΔT1 and ΔT2) of tumor.
The feasibility of the Man-HA-MnO2 NPs for cellular MRI was also evaluated by examining M2 macrophages incubated with Man-HA-MnO2 NPs at different concentrations for 1 h. The reaction of Man-HA-MnO2 NPs toward H2O2 was determined by ultraviolet–visible (UV–vis) absorption before and after 1 h incubation. MnO2 absorbs at 360 nm, while Mn2+ ions has no absorption in the UV–vis region. After 1 h incubation, Man-HA-MnO2 NPs were completely consumed by H2O2 released from macrophages, and enhanced T1 and T2 contrasts were observed (Figure S9).
Typically, MRI contrast agents are “always on” and not capable of highlighting biological events of interest because of a relatively low target-to-background contrast. However, the relaxivity of activatable MRI contrast agents varies in response to the change in the surrounding physiological microenvironment, potentially allowing MRI to sense biochemical activities. Activatable MRI contrast agents are typically designed using complexes to shield the paramagnetic ions from water molecules. The contrast enhancement after stimulation is of critical importance in evaluating the efficiency of an activatable MRI contrast agent. However, because of poor shielding efficiency, most activatable probes usually exhibit only modest contrast enhancement under stimuli and,34,35 thus, fail to be applied in the clinic. In the present study, Man-HA-MnO2 NP as a H2O2-active MRI contrast agent showed 64- and 109-fold enhancement in r1 and r2 relaxivities, respectively (Figure S4). Such an ultrasensitive T1 and T2 MRI performance makes Man-HA-MnO2 NPs suitable as a contrast agent for MRI in vivo.
Man-HA-MnO2 NPs Alleviate Tumor Hypoxia
The effect of Man-HA-MnO2 NPs on tumor oxygenation was assessed using blood oxygen level-dependent (BOLD) MRI. BOLD MRI has been extensively used in studying brain function.36,37 It is now increasingly applied to noninvasively assess blood oxygenation and vascular function in tumors.38–40 The underlying rationale is that the paramagnetic deoxyhemoglobin creates microscopic field gradients, which enhance the transverse relaxation rate, R2*, of water protons in blood and in the tissue adjacent to blood vessels. Decrease in deoxyhemoglobin concentration leads to a decreased R2*, and thus, an increased signal intensity (SI) in T2*-weighted MRI. We performed BOLD MRI on 4T1 tumor mice before, 3 and 7 days after iv injection of 13.2 mg/kg Man-HA-MnO2 NPs or saline and observed a significant increase in T2* values of tumors treated with Man-HA-MnO2 NPs up to 29.8% and 58.6% on day 3 and day 7, respectively (Figure 6), indicating increased O2 concentration in the tumor blood. Furthermore, the significant increase in T2* value of tumor was not only in the peripheral region, but also in the tumor core in which hypoxic region is located. On the contrary, the T2* values of tumors treated with saline were decreased on day 3 and day 7. The advantage of using Man-HA-MnO2 NPs is the ability to increase O2 concentration in the tumor area by targeted delivery of Man-HA-MnO2 NPs to TAMs which are highly accumulated in tumor hypoxic region.
Figure 6.

Effect of Man-HA-MnO2 NPs on tumor oxygen on day 3 and day 7 after iv injection of Man-HA-MnO2 NPs: A significant increase in T2* values of tumors treated with Man-HA-MnO2 NPs at 3 and 7 days after iv injection of Man-HA-MnO2 NPs (n = 5/group). Error bars are standard error of the mean. **p < 0.005 as compared to pretreatment.
The increased O2 concentration in the tumor blood could be attributed to the reaction of Man-HA-MnO2 NPs toward H2O2 released by TAMs under acidic condition, which resulted in the O2 release. In addition, the effect of Man-HA-MnO2 NPs on macrophage polarization may also modulate tumor microenvironment. The improvement of the blood O2 concentration in tumors by Man-HA-MnO2 NPs would be a promising strategy to improve tumor physiology and alleviate tumor hypoxia. Furthermore, by combining such strategy with conventional anticancer treatments it may be possible to bring cancer growth, invasion, and metastasis to a halt.
We investigated the effect of Man-HA-MnO2 NPs on tumor hypoxia in vivo 4 days post-NP-injection by immunofluorescence staining to determine tissue hypoxia using a Pimonidazole marker41 and the expression of HIF-1α and VEGF using antibodies. The tumor showed 50.3% less tissue hypoxia, 49.3% decrease in the expression of HIF-1α, and 31.8% decrease in the expression of VEGF 4 days after treatment with 13.2 mg/kg Man-HA-MnO2 NPs compared to those in saline treatment group (Figure 7), indicating the ability of Man-HA-MnO2 NPs to reduce tumor hypoxia. HIF-1α produced by tumor cells plays a pivotal role in adaptive response to hypoxia by modulating various cellular functions like proliferation, apoptosis, angiogenesis and anaerobic glycolysis.42,43 Upon activation, HIF-1α binds to the hypoxia responsive element, thereby promoting transcription of various genes including VEGF. The expression of VEGF further induces angiogenesis and plays a key role in promoting malignant tumor growth.44 Thus, downregulation of HIF-1α and VEGF expression by alleviating tumor hypoxia would inhibit tumor progression.
Figure 7.

Effect of Man-HA-MnO2 NPs on tumor hypoxia, HIF-1α and VEGF: Representative immunofluorescense images of tumors treated with Man-HA-MnO2 NPs + Dox, Man-HA-MnO2 NPs, Dox or saline on day 4. Tumor hypoxia was determined by Pimonidazole binding of HIF-1α and VEGF antibody staining. Magnification 600×; scale bar 20 μm. Error bars represent standard errors of the mean. *p < 0.05, **p < 0.005 as compared to saline control.
To account for significant reduction of tumor hypoxia, several factors were considered as the following: (1) Man-HA-MnO2 NPs could be successfully delivered to tumor hypoxia by TAM accumulation, which would allow the reaction of Man-HA-MnO2 NPs toward H2O2 in the hypoxic region of the tumor and large amount of O2 release; (2) Man-HA-MnO2 NPs can successfully skew TAMs away from the M2 phenotype to a tumor-inhibiting M1 phenotype, which would provide an opportunity to alleviate tumor hypoxia and downregulate HIF-1α and VEGF expression, since TAMs are known to accumulate in large numbers in the hypoxic regions of solid tumors and cooperate with tumor cells to up-regulate HIF-1α, VEGF and MMP-7 expression, promoting tumor proliferation. (3) The improved tumor O2 level by reaction of Man-HA-MnO2 NPs with H2O2 would efficiently manipulate the tumor microenvironment.
Man-HA-MnO2 NPs Enhance Chemotherapy Response
Several studies have shown that tumor cells in hypoxic region are more resistant to chemotherapy than those with normal levels of oxygen. To evaluate whether hypoxia reduction by Man-HA-MnO2 NPs can enhance tumor chemotherapy, we conducted preliminary studies in 4T1 breast tumor model using diffusion-weighted MRI (DW-MRI). DWI is a well-studied MR imaging technique for quantifying the increase in water diffusion caused by cell necrosis or apoptosis in tumors within 2–4 days, prior to visible changes in tumor morphology or size.45 With the use of DW-MRI, diffusion of water within tissue can be noninvasively quantified as an apparent diffusion coefficient (ADC). Shift of ADC histogram to a higher ADC value can be an early and quantifiable indicator of therapeutic efficacy.46 We treated mice bearing 4T1 tumors with 13.2 mg/kg Man-HA-MnO2 NPs or saline 6 h prior to doxorubicin (Dox) administration. DW-MRI was performed before, day 2 and day 4 post-treatment. The significant increase in ADC values was observed in mice treated with combined Man-HA-MnO2 NPs and Dox up to 35.6% and 42% at day 2 and day 4, respectively, compared to the control group. We also observed a significant tumor growth delay in the combined Man-HA-MnO2 NP and Dox treatment group compared to the control group. The average tumor volume after the combination therapy averaged 78 mm3, while the Dox alone group reached an average tumor volume of 143 mm3 at day 9. Interestingly, an increase in ADC value was also observed in the Man-HA-MnO2 NPs alone group compared to the saline group (Figure 8A). The antitumor effect of Man-HA-MnO2 NPs may be caused by TAM phenotype switching and the manipulation of the tumor microenvironment by Man-HA-MnO2 NPs, since the cytotoxicity of M1 macrophages contributes to tumor killing by releasing NO, H2O2, peroxynitrite and superoxide. To confirm the effect of Man-HA-MnO2 NPs on enhancement of chemotherapy response, tumor cell proliferation was determined by immunofluorescence staining with proliferating cell nuclear antigen (PCNA) antibody. A significant decrease in PCNA expression was observed in the combination of Man-HA-MnO2 NPs with Dox and Man-HA-MnO2 NPs alone treatment up to 67.2% and 28.4%, respectively, compared to that of saline control. Dox also had effect on tumor cell proliferation but was not as strong as the combined Man-HA-MnO2 NPs and Dox treatment (Figure 7). A MTT assay was employed to determine the ability of Man-HA-MnO2 NPs to enhance chemotherapy response in vitro. 4T1 tumor cells were cocultured with RAW 264.7 macrophages for 24 h, then treated with different concentrations of Dox (0–0.6 μg/mL) or the combination of 5 μM Man-HA-MnO2 NPs and Dox for 24 h. The combination therapy had a higher tumor inhibition effect than Dox alone, and the IC50 values were 0.11 and 0.31 μg/mL, respectively (P = 0.02). There was a significant reduction in cell viability in the group treated with combination of Man-HA-MnO2 NPs and Dox when the Dox concentrations were as low as 0.3–1 μg/mL (Figure S10).
Figure 8.

Effect on apparent diffusion coefficient (ADC) of tumors and tumor cell proliferation after treatment with Dox and Man-HA-MnO2 NPs: (A) Changes of apparent diffusion coefficient (ADC) of tumors on day 2 and day 4 after treatment with Dox and Man-HA-MnO2 NPs. (B) The significant increase in ADC values after treatment with the combination of Man-HA-MnO2 NPs with Dox at day 2 and day 4. (C) Effect of Man-HA-MnO2 NPs and Dox on tumor cell proliferation determined by immunofluorescence staining with PCNA antibody. Magnification 600×; scale bar 20 μm. Error bars are standard error of the mean. *p < 0.05, **p < 0.005 of ADC values as compared to pretreatment.
The reduction of tumor hypoxia by Man-HA-MnO2 NPs could contribute to the enhancement of chemotherapy response, as we observed 64.5% less tissue hypoxia, 62.7% decrease in the expression of HIF-1α, and 39.7% decrease in the expression of VEGF 4 days after treatment with the combination of Man-HA-MnO2 NPs and Dox compared to those in the saline control group (Figure 7). Skewing TAM polarization away from the M2 phenotype to a tumor-inhibiting M1 phenotype by Man-HA-MnO2 NPs may also be a factor contributing to the enhancement of chemotherapy response. Since evidence has been provided that TAMs may be also associated with chemoresistance of cancer,14,15 Man-HA-MnO2 NPs would be a promising adjuvant to cancer chemotherapeutics by improving tumor physiology and alleviating tumor hypoxia. The dose of Man-HA-MnO2 NPs used in our study was relatively high, for translation of this strategy into clinic, further modifications to optimize the performance of such nanoparticle platform are warranted in the future studies.
CONCLUSION
Targeted delivery of HA modified MnO2 nanoparticles (Man-HA-MnO2 NPs) to TAMs can successfully alleviate tumor hypoxia and enhance chemotherapy response by tilting TAM polarization from the M2 phenotype to a tumor-inhibiting M1 phenotype and improving tumor oxygen level by reacting with endogenous H2O2 under hypoxic conditions. In addition, the released Mn2+ ions have the ability to highly enhance T1 MRI performance for tumor imaging and detection.
METHODS
Nanoparticle Synthesis
MnO2 NPs were prepared by directly mixing the aqueous solutions of KMnO4 and poly(allylamine hydrochloride) (PAH, 15 kDa). Briefly, 18 mL of KMnO4 solution (3.5 mg mL−1) was mixed with 2 mL of PAH solution (37.4 mg mL−1), and the mixture was left for 15 min at room temperature until all permanganate was converted to MnO2. NP formation was confirmed by recording UV–vis absorption spectrum. NPs were washed three times with doubly distilled (DDI) water using ultracentrifugation (50 k rpm for 1 h). This step led to small (~15 nm) MnO2 NPs stabilized with PAH. The MnO2 NPs were conjugated to the HA backbone by a condensation reaction. Briefly, 100 mg HA (40 kDa molecular weight) was dissolved in distilled water (20 mL). Then, the HA was activated under stirring for 30 min in the presence of 1-ethyl-3-(3-(dimethylamino)propyl)-carbodiimide (EDC, 0.64 mmol) and N-hydroxysuccinimide (NHS, 0.64 mmol). Then, the MnO2 NPs were added dropwise at various HA/MnO2 NP weight ratios (w/w) and reacted with activated carboxylic ester of HA under stirring at 35 °C for 3 h. The HA-MnO2 NPs were purified three times with DDI water using centrifugation (12 k rpm for 30 min). Mannan-PE was synthesized in accordance with the method described.47 Surface modification of HA-MnO2 NPs with mannan-PE ligands was accomplished according to the procedure developed by Yu et al.47 The total ligand-to-carrier weight ratio was optimized by measuring the change in zeta potential. The optimum ratio occurred when increasing the ligand-to-carrier weight ratio led to no significant change in zeta potential.
Cell Association and Cellular Uptake of NPs
M1 and M2 macrophages were generated by pretreating RAW264.7 cells with 1 μg/mL LPS or 25 ng/mL IL-4 (eBioscience) for 24 h, respectively. M2 macrophages (105 cells/mL) were incubated for 1 h with fluorescent dye Cy5.5 labeled Man-HA-MnO2 NPs or HA-MnO2 NPs (4 μM Mn) at 4 or 37 °C before microscopy and flow cytometry analysis. Confocal microscope (Olympus, USA) and flow cytometer (Beckman Coulter, USA) were used to image and quantify positive cells following incubation with fluorescent dye labeled NPs. Cell nuclei were stained blue with DAPI (Invitrogen Molecular Probes, USA).
Quenching of H2O2 by NPs
For the quenching experiment, Man-HA-MnO2 NPs or MnO2 NPs (50 μM Mn) was placed in phosphate buffer at pH 6.5, and H2O2 (300 μM) was added to initiate the reaction. For in vitro reactivity of Man-HA-MnO2 NPs toward H2O2, RAW264.7 cells were pretreated with 25 ng/mL IL-4 to generate M2 macrophages, then incubated with 5 μM Man-HA-MnO2 NPs or HA-MnO2 NPs at pH 6.8. The residual amount of H2O2 was determined over time using a PeroXOquant assay kit (Pierce, USA), and change of pH was measured with a pH meter (PHS, China). T1- and T2-weighted MRI contrast signals were determined by MRI.
MRI
MRI experiments were performed on a Bruker Biospin 9.4T animal MRI scanner (Bruker, Germany) equipped with a horizontal bore (diameter, 30 cm; gradient strength, 734 mT/m). For accurate tumor imaging, T2-weighted images were obtained using a spin echo multiple slice sequence with a repetition time (TR) of 2500 ms and an effective echo time (TE) of 33 ms.
The T1 relaxation time was estimated using a spin echo multiple slice sequence at variable TR values; eight TR values of 327.1–5500 ms were used and TE was 11 ms. The T2 relaxation time was measured using a multislice multiecho technique with a TR of 2500 ms and 16 TE of 11–176 ms. The T2* relaxation time was measured using a multigradient echo technique with a TR of 1500 ms, 12 TE values of 3.8–45 ms, and a flip angle of 30°.
DW-MRI was used with the following parameters: TR = 2700 ms; TE = 27 ms; matrix = 256 × 256; multislice spin–echo sequence with field of view of 30 × 30 mm at b = 0 and 800 s/mm2. The gradients were applied in three orthogonal directions.
Optical Imaging
A Xenogen IVIS Spectrum Imaging System (Caliper Life Sciences Inc., USA) was used to image tumor bearing animals over time following iv treatment with near-infrared labeled 13.2 mg/kg Man-HA-MnO2 NPs. At each time point, a bright field image was acquired and fluorescence of labeled Man-HA-MnO2 NPs was imaged at 680 nm excitation and 745 nm emission. At 24 h postinjection, tumors and major organs were excised for ex vivo NIRF imaging to determine the tissue distribution of Man-HA-MnO2 NPs. All main organs were cut with similar thickness and imaged at 680 nm excitation and 745 nm emission. The average fluorescence intensity of organs was from a region of interest (ROI) placed over the area of the organs on the image.
Immunohistochemistry
At predetermined time points, animals were sacrificed and tumor tissues were harvested, embedded in OCT medium, and snap frozen. Six-micrometer sections were cut and fixed in 10% paraformaldehyde solution, followed by immunostaining with the primary antibody. Primary antibody was detected by sequential incubation with secondary antibody (goat anti-rabbit immunoglobulin G conjugated to FITC or Cy5, Life Technologies, New York, NY, USA). Slides were scanned with Confocal microscope (Olympus, USA) and images were analyzed with ImageJ 7.0 software.
To evaluate tumor hypoxia, the hypoxia marker Pimonidazole hydrochloride (Hypoxyprobe-1 plus kit, Hypoxyprobe, Inc., USA) was used for ex vivo tissue staining of hypoxia following the protocol provided with the kit. Rabbit polyclonoal HIF-1α antibody (dilution 1:100, Novus Biologicals, catalog number NB100-134) and rabbit anti-VEGF antibody (dilution 1:100, Thermo Scientific, catalog number ab-222-P) as the primary antibody were used for the staining of HIF-1α and VEGF, respectively. To evaluate the effect of Man-HA-MnO2 NPs on the polarization of TAMs, rabbit polyclonal CD206 antibody (dilution 1:200, abcam, catalog number ab64693) and rabbit polyclonal iNOS antibody (dilution 1:200, abcam, catalog number ab3523) as the primary antibody were used to determine the distribution of M2 and M1 macrophages, respectively. To confirm the effect of Man-HA-MnO2 NPs on enhancement of chemotherapy response, tumor cell proliferation was determined by immunofluorescence staining with rabbit polyclonal PCNA antibody (1:200, abcam, catalog number ab18197).
Flow Cytometry
Tumors were mechanically disrupted, and incubated in 1% collagenase type IV diluted in RPMI 1640 medium with 1% BSA for 1 h at 37 °C. Collagenase activity was stopped by adding an equal volume of Dulbecco Modified Eagle’s medium (DMEM) supplemented with 10% fetal bovine serum (FBS) followed by centrifugation at 300 g for 10 min. Cell pellets were filtered through 100 μm nylon mesh cell strainer. Cultured cells were collected following the standard procedure. Samples from tumors and cells were incubated with rabbit polyclonal CD206 antibody (dilution 1:200, abcam, catalog number ab64693) and rabbit polyclonal iNOS antibody (dilution 1:200, abcam, catalog number ab3523) to label M2 and M1 macrophages. Primary antibody was detected by sequential incubation with secondary antibody (goat anti-rabbit immunoglobulin G conjugated to FITC or Cy5 (Life Technologies, New York, NY, USA). Isotype controls were employed to establish background fluorescence. Data were acquired on a Beckman Coulter Gallios (Beckman Coulter, USA) and analyzed by FlowJo software (Tree Star, San Carlos, CA, USA)
Quantification of IL-10 and IL-12 Levels
To determine the IL-10 and IL-12 levels in cells, the cells were lysed in 1 mL of RIPA buffer as a lysis buffer, maintained at 4 °C for 3 h, and centrifuged at 14 000 rpm and 4 °C for 15 min. The total protein concentration in the supernatant was determined by the BCA protein assay. The IL-10 and IL-12 concentration in the supernatant was analyzed with mouse IL-10 and IL-12 ELISA kits (Thermo Scientific).
Quantification of Mn Accumulated in the Tissue
The mice were sacrificed and most of the blood was flushed out. The dissected organ samples were dried and weighed. The Mn content was determined by ICP-MS. The organ samples were dissolved in 5 mL of freshly prepared aqua regia with heating until the solution became transparent. After evaporation, 1 mL of 50% HCl and 1 mL of 50% HNO3 were added and diluted to a final volume of 10 mL with water. The samples were analyzed by ICP-MS (Thermo Fischer Scientific iCAP-QC).
Chemotherapy
4T1 murine breast cancer model was established by subcutaneous injection of 106 cells/mL 4T1 cells into the flank of Balb/c female mice. Mice were divided into four groups (n = 6/group): (1) saline, (2) Dox (5 mg/kg), (3) Man-HA-MnO2 NP (13.2 mg/kg), (4) Man-HA-MnO2 NP (13.2 mg/kg) + Dox (5 mg/kg). Treatments were initiated when the tumors reached an approximate volume of 118 mm3. The mice were iv pretreated with 13.2 mg/kg Man-HA-MnO2 NP 6 h before 5 mg/kg Dox administration. DW-MRI was performed on day 0, 2, and 4 after treatment. The tumor size was measured as a function of time with vernier calipers in two dimensions and tumor volumes were calculated by the formula V = [(length) × (width)2]/2. At the end of experiment, the animals were sacrificed and the tumor masses were excised. Tumor tissue was subjected to histological analysis to determine tumor cell proliferation. The experimental design was approved by the Xiamen University Committee on the Use and Care of Animals.
A MTT assay was employed to determine the ability of Man-HA-MnO2 NPs to enhance chemotherapy response in vitro. 4T1 tumor cells were cocultured with RAW 264.7 macrophages (3:1) for 24 h, then treated with different concentrations of Dox (0–0.6 μg/mL) or the combination of 5 μM Man-HA-MnO2 NPs and Dox for 24 h.
Statistical Analysis
Data are presented as mean ± standard error of the mean for results obtained from three independent trials unless otherwise indicated. Student’s t test or analysis of variance (ANOVA) (OriginPro8) was utilized to determine statistical significance between two or more groups, respectively. P-values < 0.05 were considered statistically significant.
Supplementary Material
ACKNOWLEDGMENTS
This research was supported by the National Science Foundation of China (81501533), National Key Basic Research Program of China (2014CB744503), and the Intramural Research Program, National Institute of Biomedical Imaging and Bioengineering, National Institutes of Health.
Footnotes
The Supporting Information is available free of charge on the ACS Publications website at DOI: 10.1021/acsnano.5b06779.
Characterization of Man-HA-MnO2 NPs, cell binding and uptake of Man-HA-MnO2 NPs, reaction of Man-HA-MnO2 NPs toward H2O2, the T1- and T2-weighted MR signal, and r1 and r2 relaxivity vs Mn concentration for Man-HA-MnO2 NP solution, Man-HA-MnO2 NP solution treated with H2O2, and M2 macrophages incubated with Man-HA-MnO2 NPs, and effect on tumor growth and cell viability after treatment with Dox and Man-HA-MnO2 NPs (PDF)
Notes
The authors declare no competing financial interest.
REFERENCES
- (1).Gatenby RA, Gillies RJ. A Microenvironmental Model of Carcinogenesis. Nat. Rev. Cancer. 2008;8:56–61. doi: 10.1038/nrc2255. [DOI] [PubMed] [Google Scholar]
- (2).Bertout JA, Patel SA, Simon MC. The Impact of O2 Availability on Human Cancer. Nat. Rev. Cancer. 2008;8:967–975. doi: 10.1038/nrc2540. [DOI] [PMC free article] [PubMed] [Google Scholar]
- (3).Eubank TD, Roberts RD, Khan M, Curry JM, Nuovo GJ, Kuppusamy P, Marsh CB. Granulocyte Macrophage Colony-Stimulating Factor Inhibits Breast Cancer Growth and Metastasis by Invoking an Anti-Angiogenic Program in Tumor-Educated Macrophages. Cancer Res. 2009;69:2133–2140. doi: 10.1158/0008-5472.CAN-08-1405. [DOI] [PMC free article] [PubMed] [Google Scholar]
- (4).Mehlen P, Puisieux A. Metastasis: A Question of Life or Death. Nat. Rev. Cancer. 2006;6:449–458. doi: 10.1038/nrc1886. [DOI] [PubMed] [Google Scholar]
- (5).Wu W, Yang Q, Li T, Zhang P, Zhou R, Yang C. Hemoglobin-Based Oxygen Carriers Combined with Anticancer Drugs May Enhance Sensitivity of Radiotherapy and Chemotherapy to Solid Tumors. Artif. Cells Blood Substit. Immobil. Biotechnol. 2009;37:163–165. doi: 10.1080/10731190903043218. [DOI] [PubMed] [Google Scholar]
- (6).Janssens GO, Rademakers SE, Terhaard CH, Doornaert PA, Bijl HP, van den Ende P, Chin A, Marres HA, de Bree R, van der Kogel AJ, et al. Accelerated Radiotherapy with Carbogen and Nicotinamide for Laryngeal Cancer: Results of a Phase III Randomized Trial. J. Clin. Oncol. 2012;30:1777–1783. doi: 10.1200/JCO.2011.35.9315. [DOI] [PubMed] [Google Scholar]
- (7).Zannella VE, Dal Pra A, Muaddi H, McKee TD, Stapleton S, Sykes J, Glicksman R, Chaib S, Zamiara P, Milosevic M, et al. Reprogramming Metabolism with Metformin Improves Tumor Oxygenation and Radiotherapy Response. Clin. Cancer Res. 2013;19:6741–6750. doi: 10.1158/1078-0432.CCR-13-1787. [DOI] [PubMed] [Google Scholar]
- (8).Murdoch C, Giannoudis A, Lewis CE. Mechanisms Regulating the Recruitment of Macrophages into Hypoxic Areas of Tumors and other Ischemic Tissues. Blood. 2004;104:2224–2234. doi: 10.1182/blood-2004-03-1109. [DOI] [PubMed] [Google Scholar]
- (9).Casazza A, Laoui D, Wenes M, Rizzolio S, Bassani N, Mambretti M, Deschoemaeker S, Van Ginderachter JA, Tamagnone L, Mazzone M. Impeding Macrophage Entry into Hypoxic Tumor Areas by Sema3A/Nrp1 Signaling Blockade Inhibits Angiogenesis and Restores Antitumor Immunity. Cancer Cell. 2013;24:695–709. doi: 10.1016/j.ccr.2013.11.007. [DOI] [PubMed] [Google Scholar]
- (10).Martinez FO, Sica A, Mantovani A, Locati M. Macrophage Activation and Polarization. Front. Biosci., Landmark Ed. 2008;13:453–461. doi: 10.2741/2692. [DOI] [PubMed] [Google Scholar]
- (11).Hao NB, Lu MH, Fan YH, Cao YL, Zhang ZR, Yang SM. Macrophages in Tumor Microenvironments and the Progression of Tumors. Clin. Dev. Immunol. 2012;2012:948098. doi: 10.1155/2012/948098. [DOI] [PMC free article] [PubMed] [Google Scholar]
- (12).Solinas G, Germano G, Mantovani A, Allavena P. Tumor-Associated Macrophages (TAM) as Major Players of the Cancer-Related Inflammation. J. Leukocyte Biol. 2009;86:1065–1073. doi: 10.1189/jlb.0609385. [DOI] [PubMed] [Google Scholar]
- (13).Laoui D, Van Overmeire E, Di Conza G, Aldeni C, Keirsse J, Morias Y, Movahedi K, Houbracken I, Schouppe E, Elkrim Y, et al. Tumor Hypoxia does not Drive Differentiation of Tumor-Associated Macrophages but rather Fine-Tunes the M2-Like Macrophage Population. Cancer Res. 2014;74:24–30. doi: 10.1158/0008-5472.CAN-13-1196. [DOI] [PubMed] [Google Scholar]
- (14).Yang C, He L, He P, Liu Y, Wang W, He Y, Du Y, Gao F. Increased Drug Resistance in Breast Cancer by Tumor-Associated Macrophages through IL-10/STAT3/Bcl-2 Signaling Pathway. Med. Oncol. 2015;32:352. doi: 10.1007/s12032-014-0352-6. [DOI] [PubMed] [Google Scholar]
- (15).Jinushi M, Chiba S, Yoshiyama H, Masutomi K, Kinoshita I, Dosaka-Akita H, Yagita H, Takaoka A, Tahara H. Tumor-Associated Macrophages Regulate Tumorigenicity and Anticancer Drug Responses of Cancer Stem/Initiating Cells. Proc. Natl. Acad. Sci. U. S. A. 2011;108:12425–12430. doi: 10.1073/pnas.1106645108. [DOI] [PMC free article] [PubMed] [Google Scholar]
- (16).Griffiths L, Binley K, Iqball S, Kan O, Maxwell P, Ratcliffe P, Lewis C, Harris A, Kingsman S, Naylor S. The Macrophage - A Novel System to Deliver Gene Therapy to Pathological Hypoxia. Gene Ther. 2000;7:255–262. doi: 10.1038/sj.gt.3301058. [DOI] [PubMed] [Google Scholar]
- (17).Shiri S, Alizadeh AM, Baradaran B, Farhanghi B, Shanehbandi D, Khodayari S, Khodayari H, Tavassoli A. Dendrosomal Curcumin Suppresses Metastatic Breast Cancer in Mice by Changing M1/M2Macrophage Balance in the Tumor Microenvironment. Asian Pac. J. Cancer Prev. 2015;16:3917–3922. doi: 10.7314/apjcp.2015.16.9.3917. [DOI] [PubMed] [Google Scholar]
- (18).Luo XL, Xu JJ, Zhao W, Chen HY. A Novel Glucose ENFET Based on the Special Reactivity of MnO2 Nanoparticles. Biosens. Bioelectron. 2004;19:1295–1300. doi: 10.1016/j.bios.2003.11.019. [DOI] [PubMed] [Google Scholar]
- (19).Prasad P, Gordijo CR, Abbasi AZ, Maeda A, Ip A, Rauth AM, DaCosta RS, Wu XY. Multifunctional Albumin-MnO2 Nanoparticles Modulate Solid Tumor Microenvironment by Attenuating Hypoxia, Acidosis, Vascular Endothelial Growth Factor and Enhance Radiation Response. ACS Nano. 2014;8:3202–3212. doi: 10.1021/nn405773r. [DOI] [PubMed] [Google Scholar]
- (20).Rayahin JE, Buhrman JS, Zhang Y, Koh TJ, Gemeinhart RA. High and Low Molecular Weight Hyaluronic Acid Differentially Influence Macrophage Activation. ACS Biomater. Sci. Eng. 2015;1:481–493. doi: 10.1021/acsbiomaterials.5b00181. [DOI] [PMC free article] [PubMed] [Google Scholar]
- (21).Lyle DB, Breger JC, Baeva LF, Shallcross JC, Durfor CN, Wang NS, Langone JJ. Low Molecular Weight Hyaluronic Acid Effects on Murine Macrophage Nitric Oxide Production. J. Biomed. Mater. Res., Part A. 2010;94:893–904. doi: 10.1002/jbm.a.32760. [DOI] [PubMed] [Google Scholar]
- (22).Aoki I, Takahashi Y, Chuang KH, Silva AC, Igarashi T, Tanaka C, Childs RW, Koretsky AP. Cell Labeling for Magnetic Resonance Imaging with the T1 Agent Manganese Chloride. NMR Biomed. 2006;19:50–59. doi: 10.1002/nbm.1000. [DOI] [PubMed] [Google Scholar]
- (23).Loving GS, Mukherjee S, Caravan P. Redox-Activated Manganese-Based MR Contrast Agent. J. Am. Chem. Soc. 2013;135:4620–4623. doi: 10.1021/ja312610j. [DOI] [PMC free article] [PubMed] [Google Scholar]
- (24).Troughton JS, Greenfield MT, Greenwood JM, Dumas S, Wiethoff AJ, Wang J, Spiller M, McMurry TJ, Caravan P. Synthesis and Evaluation of a High Relaxivity Manganese(II)-Based MRI Contrast Agent. Inorg. Chem. 2004;43:6313–6323. doi: 10.1021/ic049559g. [DOI] [PubMed] [Google Scholar]
- (25).Na HB, Lee JH, An K, Park YI, Park M, Lee IS, Nam DH, Kim ST, Kim SH, Kim SW, et al. Development of a T1 Contrast Agent for Magnetic Resonance Imaging Using MnO Nanoparticles. Angew. Chem., Int. Ed. 2007;46:5397–5401. doi: 10.1002/anie.200604775. [DOI] [PubMed] [Google Scholar]
- (26).Viger ML, Sankaranarayanan J, de Gracia Lux C, Chan M, Almutairi A. Collective Activation of MRI Agents via Encapsulation and Disease-Triggered Release. J. Am. Chem. Soc. 2013;135:7847–7850. doi: 10.1021/ja403167p. [DOI] [PMC free article] [PubMed] [Google Scholar]
- (27).Movahedi K, Schoonooghe S, Laoui D, Houbracken I, Waelput W, Breckpot K, Bouwens L, Lahoutte T, De Baetselier P, Raes G, et al. Nanobody-Based Targeting of the Macrophage Mannose Receptor for Effective In Vivo Imaging of Tumor-Associated Macrophages. Cancer Res. 2012;72:4165–4177. doi: 10.1158/0008-5472.CAN-11-2994. [DOI] [PubMed] [Google Scholar]
- (28).Zhao Z, Fan H, Zhou G, Bai H, Liang H, Wang R, Zhang X, Tan W. Activatable Fluorescence/MRI Bimodal Platform for Tumor Cell Imaging via MnO2 Nanosheet-Aptamer Nanoprobe. J. Am. Chem. Soc. 2014;136:11220–11223. doi: 10.1021/ja5029364. [DOI] [PubMed] [Google Scholar]
- (29).Pan D, Schmieder AH, Wickline SA, Lanza GM. Manganese-Based MRI Contrast Agents: Past, Present and Future. Tetrahedron. 2011;67:8431–8444. doi: 10.1016/j.tet.2011.07.076. [DOI] [PMC free article] [PubMed] [Google Scholar]
- (30).Pan D, Caruthers SD, Senpan A, Schmieder AH, Wickline SA, Lanza GM. Revisiting an Old Friend: Manganese-Based MRI Contrast Agents. Wiley Interdiscip. Rev. Nanomed. Nanobiotechnol. 2011;3:162–173. doi: 10.1002/wnan.116. [DOI] [PMC free article] [PubMed] [Google Scholar]
- (31).Martinez FO, Gordon S, Locati M, Mantovani A. Transcriptional Profiling of the Human Monocyte-to-Macrophage Differentiation and Polarization: New Molecules and Patterns of Gene Expression. J. Immunol. 2006;177:7303–7311. doi: 10.4049/jimmunol.177.10.7303. [DOI] [PubMed] [Google Scholar]
- (32).Scheibner KA, Lutz MA, Boodoo S, Fenton MJ, Powell JD, Horton MR. Hyaluronan Fragments Act as an Endogenous Danger Signal by Engaging TLR2. J. Immunol. 2006;177:1272–1281. doi: 10.4049/jimmunol.177.2.1272. [DOI] [PubMed] [Google Scholar]
- (33).Black KE, Collins SL, Hagan RS, Hamblin MJ, Chan-Li Y, Hallowell RW, Powell JD, Horton MR. Hyaluronan Fragments Induce IFN-β via a Novel TLR4-TRIF-TBK1-IRF3-dependent pathway. J. Inflammation (London, U. K.) 2013;10:23. doi: 10.1186/1476-9255-10-23. [DOI] [PMC free article] [PubMed] [Google Scholar]
- (34).Tu C, Nagao R, Louie AY. Multimodal Magnetic-Resonance/Optical-Imaging Contrast Agent Sensitive to NADH. Angew. Chem., Int. Ed. 2009;48:6547–6551. doi: 10.1002/anie.200900984. [DOI] [PMC free article] [PubMed] [Google Scholar]
- (35).Gianolio E, Maciocco L, Imperio D, Giovenzana GB, Simonelli F, Abbas K, Bisi G, Aime S. Dual MRI-SPECT Agent for pH-Mapping. Chem. Commun. (Cambridge, U. K.) 2011;47:1539–1541. doi: 10.1039/c0cc03554h. [DOI] [PubMed] [Google Scholar]
- (36).Hall CN, Reynell C, Gesslein B, Hamilton NB, Mishra A, Sutherland BA, O’Farrell FM, Buchan AM, Lauritzen M, Attwell D. Capillary Pericytes Regulate Cerebral Blood Flow in Health and Disease. Nature. 2014;508:55–60. doi: 10.1038/nature13165. [DOI] [PMC free article] [PubMed] [Google Scholar]
- (37).Kami A, Meyer G, Jezzard P, Adams MM, Turner R, Ungerleider LG. Functional MRI Evidence for Adult Motor Cortex Plasticity During Motor Skill Learning. Nature. 1995;377:155–158. doi: 10.1038/377155a0. [DOI] [PubMed] [Google Scholar]
- (38).Zhao D, Pacheco-Torres J, Hallac RR, White D, Peschke P, Cerdan S, Mason RP. Dynamic Oxygen Challenge Evaluated by NMR T1 and T2* - Insights into Tumor Oxygenation. NMR Biomed. 2015;28:937–947. doi: 10.1002/nbm.3325. [DOI] [PMC free article] [PubMed] [Google Scholar]
- (39).Kim CK, Park SY, Park BK, Park W, Huh SJ. Blood Oxygenation Level-Dependent MR Imaging as a Predictor of Therapeutic Response to Concurrent Chemoradiotherapy in Cervical Cancer: A Preliminary Experience. Eur. Radiol. 2014;24:1514–1520. doi: 10.1007/s00330-014-3167-0. [DOI] [PubMed] [Google Scholar]
- (40).Jiang L, Weatherall PT, McColl RW, Tripathy D, Mason RP. Blood Oxygenation Level-Dependent (BOLD) Contrast Magnetic Resonance Imaging (MRI) for Prediction of Breast Cancer Chemotherapy Response: A Pilot Study. J. Magn. Reson. Imaging. 2013;37:1083–1092. doi: 10.1002/jmri.23891. [DOI] [PubMed] [Google Scholar]
- (41).Rademakers SE, Lok J, van der Kogel AJ, Bussink J, Kaanders JH. Metabolic Markers in Relation to Hypoxia; Staining Patterns and Colocalization of Pimonidazole, HIF-1alpha, CAIX, LDH-5, GLUT-1, MCT1 and MCT4. BMC Cancer. 2011;11:167. doi: 10.1186/1471-2407-11-167. [DOI] [PMC free article] [PubMed] [Google Scholar]
- (42).Denko NC. Hypoxia, HIF1 and Glucose Metabolism in the Solid Tumour. Nat. Rev. Cancer. 2008;8:705–713. doi: 10.1038/nrc2468. [DOI] [PubMed] [Google Scholar]
- (43).Semenza GL. Targeting HIF-1 for Cancer Therapy. Nat. Rev. Cancer. 2003;3:721–32. doi: 10.1038/nrc1187. [DOI] [PubMed] [Google Scholar]
- (44).Carmeliet P, Jain RK. Angiogenesis in Cancer and Other Diseases. Nature. 2000;407:249–257. doi: 10.1038/35025220. [DOI] [PubMed] [Google Scholar]
- (45).Moffat BA, Hall DE, Stojanovska J, McConville PJ, Moody JB, Chenevert TL, Rehemtulla A, Ross BD. Diffusion Imaging for Evaluation of Tumor Therapies in Preclinical Animal Models. MAGMA. 2004;17:249–259. doi: 10.1007/s10334-004-0079-z. [DOI] [PubMed] [Google Scholar]
- (46).Jordan BF, Runquist M, Raghunand N, Baker A, Williams R, Kirkpatrick L, Powis G, Gillies RJ. Dynamic Contrast-Enhanced and Diffusion MRI Show Rapid and Dramatic Changes in Tumor Microenvironment in Response to Inhibition of HIF-1alpha Using PX-478. Neoplasia. 2005;7:475–485. doi: 10.1593/neo.04628. [DOI] [PMC free article] [PubMed] [Google Scholar]
- (47).Yu W, Liu C, Liu Y, Zhang N, Xu W. Mannan-Modified Solid Lipid Nanoparticles for Targeted Gene Delivery to Alveolar Macrophages. Pharm. Res. 2010;27:1584–1596. doi: 10.1007/s11095-010-0149-z. [DOI] [PubMed] [Google Scholar]
Associated Data
This section collects any data citations, data availability statements, or supplementary materials included in this article.