Abstract
It is essential to control the size and morphology of nanoparticles strictly in nanomedicine. Protein cages offer significant potential for templated synthesis of inorganic nanoparticles. In this study, we successfully synthesized ultrasmall copper sulfide (CuS) nanoparticles inside the cavity of ferritin (Fn) nanocages by a biomimetic synthesis method. The uniform CuS–Fn nanocages (CuS–Fn NCs) showed strong near-infrared absorbance and high photothermal conversion efficiency. In quantitative ratiometric photoacoustic imaging (PAI), the CuS–Fn NCs exhibited superior photoacoustic tomography improvements for real-time in vivo PAI of entire tumors. With the incorporation of radionuclide 64Cu, 64CuS–Fn NCs also served as an excellent PET imaging agent with higher tumor accumulation compared to free copper. Following the guidance of PAI and PET, CuS–Fn NCs were applied in photothermal therapy to achieve superior cancer therapeutic efficiency with good biocompatibility both in vitro and in vivo. The results demonstrate that the bioinspired multifunctional CuS–Fn NCs have potential as clinically translatable cancer theranostics and could provide a noninvasive, highly sensitive, and quantitative in vivo guiding method for cancer photothermal therapies in experimental and clinical settings.
Keywords: iomimetic synthesis, ferritin, CuS, photoacoustic imaging, PET, photothermal therapy
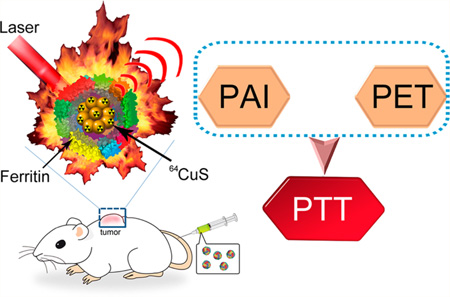
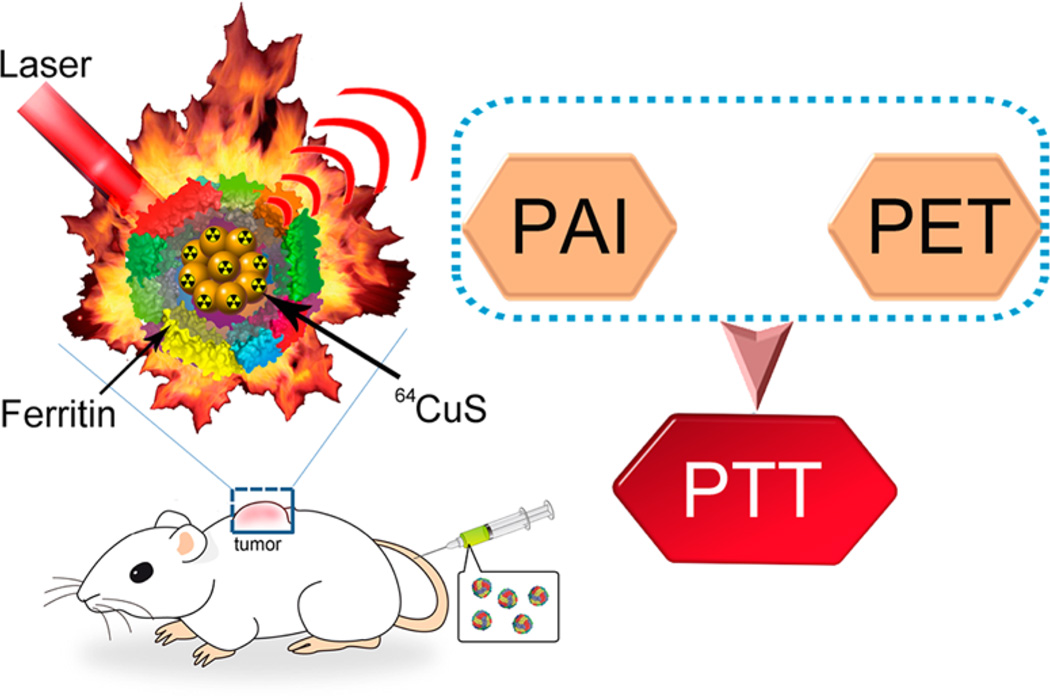
Graphical abstract
Copper sulfide nanoparticles (CuS NPs) belong to the semiconductor family and are mainly explored in energy,1 catalysis-related applications,2 and most importantly in molecular imaging and tumor theranostics.3 Compared with gold,4 carbon,5,6 and dyes,7 the advantages of using CuS in the field of theranostics are the low cost and intrinsic NIR absorption of CuS derived from energy band transitions instead of surface plasmon resonance. Generally, it is crucial to properly manage the size and morphology of NPs, which play important roles in the electronic, optical, and magnetic properties. In the past few years, a wide variety of CuS NPs have been synthesized, including nanoplates,8 hollow nanospheres,9,10 and nanotubes.11–13 However, the current synthesis methods of CuS NPs mainly include hydrothermal methods,14 microwave irradiation,15 and sonochemical synthesis,16 and all these methods require relatively high temperature or harsh environments. Meanwhile, especially for biomedical applications, CuS NPs were always needed further surface modification for achieving water-soluble and better biocompatibility. Therefore, it is commendable to establish a straightforward and green synthetic process for synthesizing clinically translatable CuS NPs.
Inspired by biomineralization, many NPs have been successfully prepared by biomimetic synthesis methods using natural biopolymers as templates because natural biopolymers cause much less concerns than synthetic polymers in clinical translation. Protein, as a classical biopolymer, has been widely used in the field of biomimetic synthesis.17–20 Ferritin (Fn) is a hollow, nearly spherical 24 subunits protein with diameter about 12 nm and a hollow cavity of 8 nm.21 It belongs to a group of proteins with different patterns that can be found in most living creatures. Fn has an important biological function: removing toxic/excess free iron ions from solution and depositing/storing them within the interior cavity in a ferrihydrite form.22–24 With its instinct feature, each Fn nanocage can store up to 4500 iron ions, and these ions can be easily removed by reducing agents and Fe(II) chelation. Additionally, the protein cage is very stable, even when heating to 85 °C and it tolerates harsh chemicals such as urea and guanidinium chloride.25 Besides iron, it can also bind different metal ions, such as Cu2+, Co2+, Ni2+, etc.26–29 Pead et al.30 investigated the binding abilities of different metal ions by Fn and demonstrated that many can bind efficiently with Fn. Among the tested ions, copper has the highest binding ability with Fn in acid solutions. The hollow cavity of ferritin or apoferritin is a perfect nanoreactor with a fixed volume for biomimetic synthesis.
We report a facile, green, and size-controlled synthesis of CuS NCs using Fn as a biotemplate for clinically translatable cancer theranostics. The synthesized CuS NCs have good biocompatibility, distinct near-infrared (NIR) absorbance, strong photoacoustic contrast, and high photothermal conversion efficiency. The uniform CuS–Fn NCs were successfully used for PET and PAI guided photothermal therapy (PTT) with long-term treatment safety (Scheme 1). This study gives new insights for the biomimetic synthesis of nanotheranostics and extends these biocompatible NPs for translation to clinical applications.
Scheme 1.
Copper Sulfide–Ferritin Nanocages (CuS–Fn NCs) as Clinically Translatable Cancer Theranostics for Positron Emission Tomography (PET) and Photoacoustic Dual-Modal Imaging (PET/PAI) Guided Photothermal Therapy (PTT)
RESULTS AND DISCUSSION
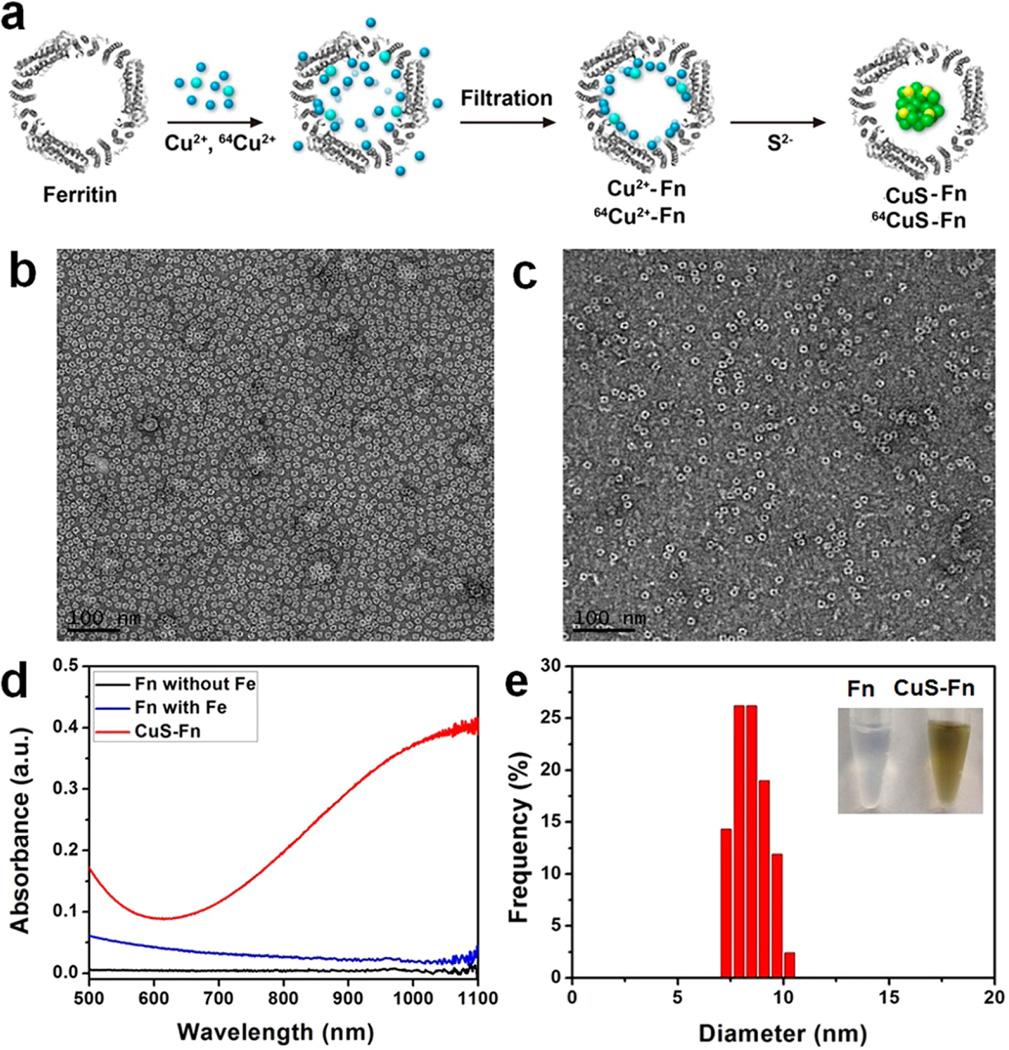
The biomimetic synthesis process of CuS–Fn was shown in Figure 1a. Escherichia coli (E. coli) derived Fn was purified using HPLC with a size exclusion column. As seen in the Coomassie Blue-stained SDS–PAGE image of Fn (Figure S1), Fn shows high purity with a molecular weight of about 21 kDa (Figure S2). TEM image shown in Figure 1b presents an explicit spherical nanocage with diameter around 12 nm. With the formation of CuS NPs inside Fn nanocages, the core of Fn turns black due to the high electron quantity of CuS NPs (Figure 1c and Figure S3). As shown in Figure S4, we can clearly see the CuS–Fn NCs as bright dots under HAADF-STEM imaging. The line-scan element mapping result indicates that the CuS–Fn NCs are composed of Cu and S elements, which suggests the successful synthesis of CuS inside Fn nanocages. This result is in agreement with the element mapping spectrum of the CuS–Fn NCs by using Energy-dispersive X-ray spectroscopy (EDS) analysis. The UV–vis-NIR absorbance spectrum of Fn without Fe, Fn with Fe, and CuS–Fn NCs is shown in Figure 1d. The CuS–Fn NCs exhibit a strong absorbance in the range of 700–1100 nm, while Fn without Fe and Fn with Fe show virtually no absorption in NIR region. The size of the CuS core was about 8 nm based on measurements of over 100 particles. This value is in agreement with the size of the Fn cavity (Figure 1e). The biomimetic synthesis process of CuS is also followed with the color change from transparent to dark green. Compared with traditional hydrophilic ultrasmall CuS nanoparticles, there are several advantages of CuS–Fn NCs. First, the biomimetic synthesis progress of CuS–Fn NCs does not need high temperature or harsh chemical reactions due to the high affinity between ferritin and copper ions. Second, with the homogeneous distribution of ferritin, one can precisely control the size and morphology of CuS within the hollow cavity of Fn NCs. Third, the protein shell provides a natural surface modification of CuS nanoparticles with high water dispersibility and good biocompatibility. Last but not least, ferritin itself showed superior tumor uptake.31
Figure 1.
Characterization of CuS–Fn NCs. (a) The synthetic procedure of CuS–Fn NCs. (b) Representative TEM image of iron free Fn stained with 1% uranyl acetate. (c) TEM image of CuS–Fn NCs stained with 1% uranyl acetate. A clear dark CuS core can be seen inside the Fn cage. (d) UV–vis absorbance spectrum of Fn without iron, Fn and CuS–Fn NCs. (e) The size distribution of CuS core. Inset: The photograph of Fn and CuS–Fn NPs solutions.
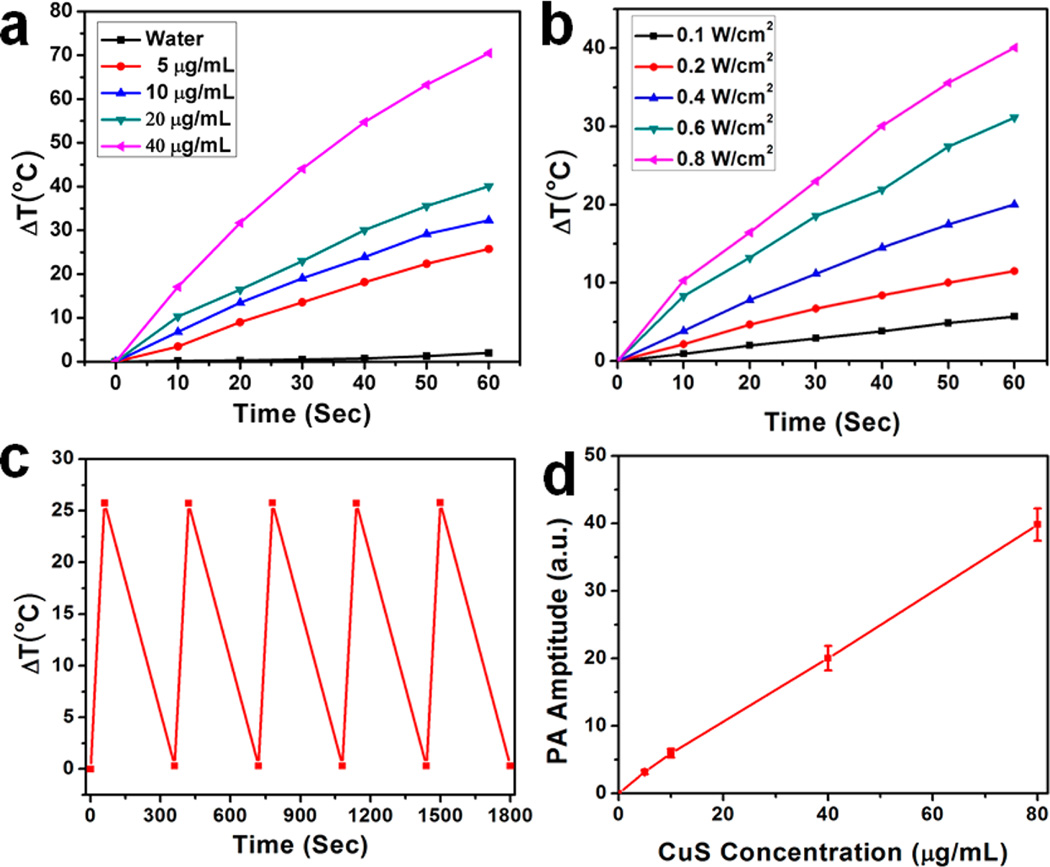
We next investigated the light-induced heat generation ability of CuS–Fn NCs in solution by measuring the temperature increase upon laser exposure. At the same time, the temperature was monitored and mapped with a thermal camera and analyzed with an IR thermal imaging system. Different concentrations of CuS–Fn NCs were exposed to an 808 nm laser at density of 0.8 W/cm2 for 1 min. Concentration-dependent CuS–Fn NCs solution and pure water temperature increases are shown in Figure 2a. The temperature of CuS–Fn NCs (40 µg/mL) increased about 70 °C within 1 min. Afterward, we also observed a laser-power-dependent temperature increase with CuS–Fn NCs at 20 µg/mL (Figure 2b). The η value of the CuS–Fn NCs was determined to be ~47% based on the energy balance on the system (Figure S5).
Figure 2.
Photothermal and photoacoustic studies of CuS–Fn NCs. (a) Temperature rise after 60 s laser irradiation of different concentrations of CuS–Fn NCs and pure water. (b) Temperature rise after 60 s laser irradiation for CuS–Fn NCs solutions (20 µg/mL) of different laser powers. (c) Photothermal stability study of CuS–Fn NCs solution. (d) Photoacoustic signal amplification for CuS–Fn NCs of different concentrations.
The photothermal stability of CuS–Fn NCs was also observed in five cycles of laser irradiation (Figure 2c). The CuS–Fn NCs show a stable photoheat conversion property. We also investigated the photoacoustic property of CuS–Fn NCs (Figure S6). Generally, nanoparticles with a photothermal effect have great potential as probes for PAI.32 As expected, a linear PA signal amplification was observed with increased CuS–Fn NCs concentration (Figure 2d).
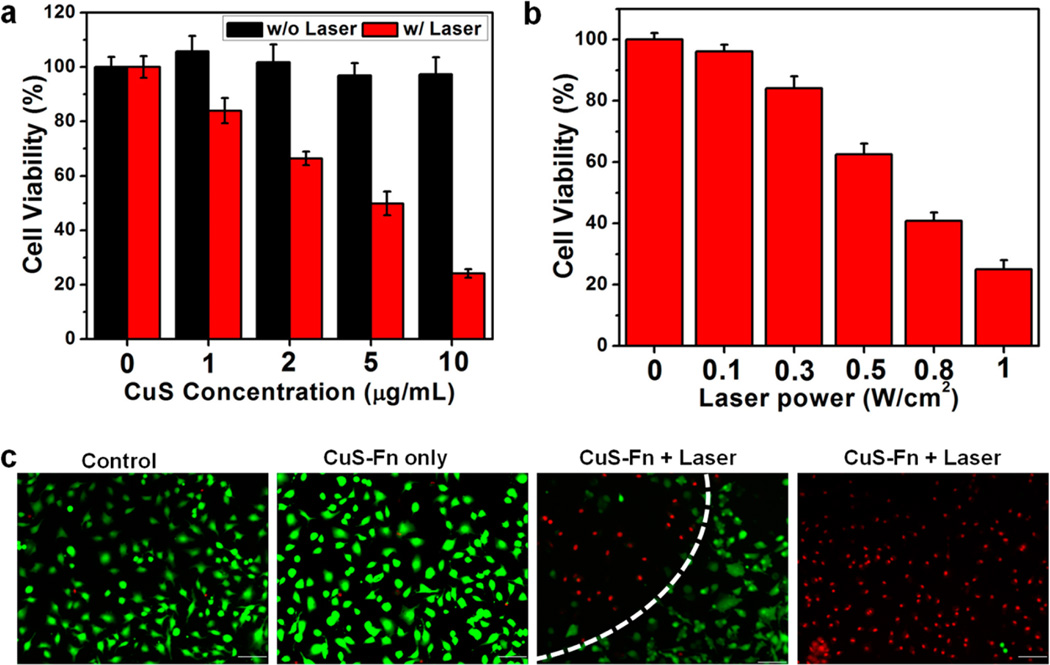
Encouraged by the high photothermal efficiency of CuS-Fn NCs, we next studied the PTT efficacy and cytotoxicity of CuS–Fn NCs in vitro, using the CuS nanoparticles as the positive control (Figures S7–S9). Human glioblastoma U87MG cells were incubated with different concentrations of CuS–Fn NCs solution. No cytotoxicity was observed in the 1– 10 µg/mL concentration range. As expected, cell viability decreased significantly with 808 nm laser irradiation due to the high photothermal efficiency of CuS–Fn NCs (Figure 3a). With fixed particle concentration, increased laser irradiation power also resulted in higher cytotoxicity (Figure 3b). Co-staining with Calcein AM and propidium iodide (PI) was used to differentiate live or dead cells with CuS–Fn NCs treatment upon laser irradiation (Figure 3c). In both the control and CuS–Fn NCs only groups, no obvious cell death could be found, and almost all the cells were kept alive. For the group subjected to CuS–Fn NCs plus laser irradiation, there was significant cell death within the laser spot, while cells beyond the region of the laser edge remained alive, nearly all the cells in the laser irradiated region were dead (Figure 3c).
Figure 3.
In vitro cell experiments. (a) Relative viability of cells incubated with gradient CuS–Fn NCs concentrations with or without irradiation by 808 nm laser. (b) Relative viability of U87MG cells incubated with 10 µg/mL CuS–Fn NCs after irradiation by 808 nm laser. (c) Fluorescence images of calcein AM/PI stained U87 MG cells after 4 h incubation with fresh medium, CuS–Fn NCs, and CuS–Fn NCs exposed to 808 nm laser. A clear laser spot can be seen in the irradiated CuS–Fn NCs group. Scale bar 100 µm.
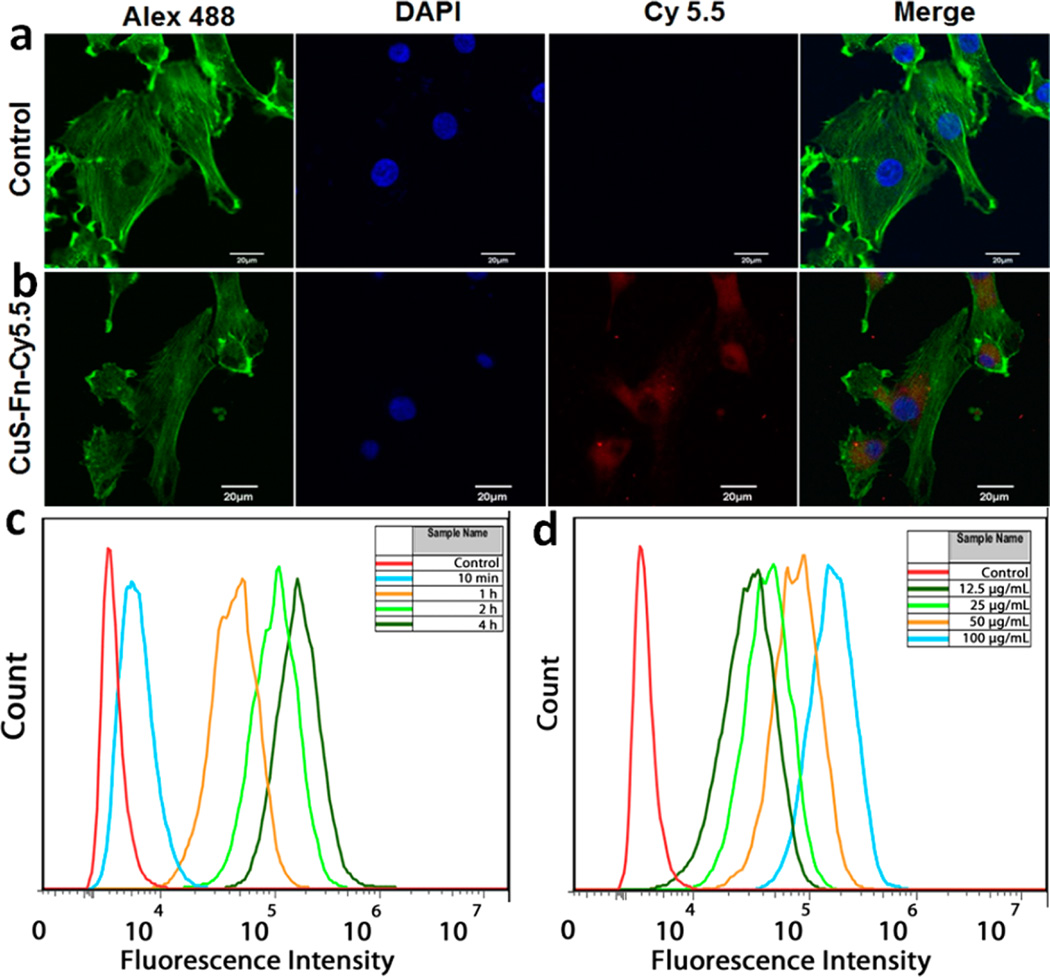
To evaluate the cell uptake of CuS–Fn NCs, we labeled CuS–Fn with Cy 5.5 dye (CuS–Fn/dye = 1:5). After PD-10 column purification, the dye-labeled NPs were incubated with different cell lines: U87MG, A549, PC3, HepG2 (Figure S10). After 4 h incubation, U87MG cells were fixed and treated with Alexa 488 conjugated phalloidin to label actin and with DAPI to label nuclei. As shown in Figure 4a,b, the confocal fluorescence images showed a clear CuS–Fn NCs uptake with strong red fluorescence of Cy 5.5 in the CuS–Fn NCs treated group only (see multislice confocal image in Figure S11). Flow cytometry was also used in the cell uptake evaluation. A total of 5 µg/mL of CuS–Fn-Cy 5.5 was incubated with U87 MG cells for different times (10 min, and 1, 2, and 4 h), and cells were digested with 0.25% trypsin and rinsed twice with PBS after incubation. Figure 4c shows that longer incubation time results in high cell uptake, even with 10 min of incubation, and it also showed some uptake compared with control cells. Different CuS–Fn NCs concentrations (12.5, 25, 50, and 100 µg/mL) incubated with U87 MG cells for 2 h also showed a concentration-dependent increase in fluorescence intensity (Figure 4d).
Figure 4.
Cell uptake assays of CuS–Fn NCs. Confocal fluorescence images of U87 MG cells incubated with (a) or without (b) NIR dye Cy 5.5 labeled CuS–Fn. Cell actin and nuclei were stained with Alexa 488 conjugated phalloidin and DAPI, respectively. (c) Flow cytometry data of U87 MG cells treated with Cy 5.5 labeled CuS–Fn of different incubation time and incubation concentration (d). Scale bar 20 µm.
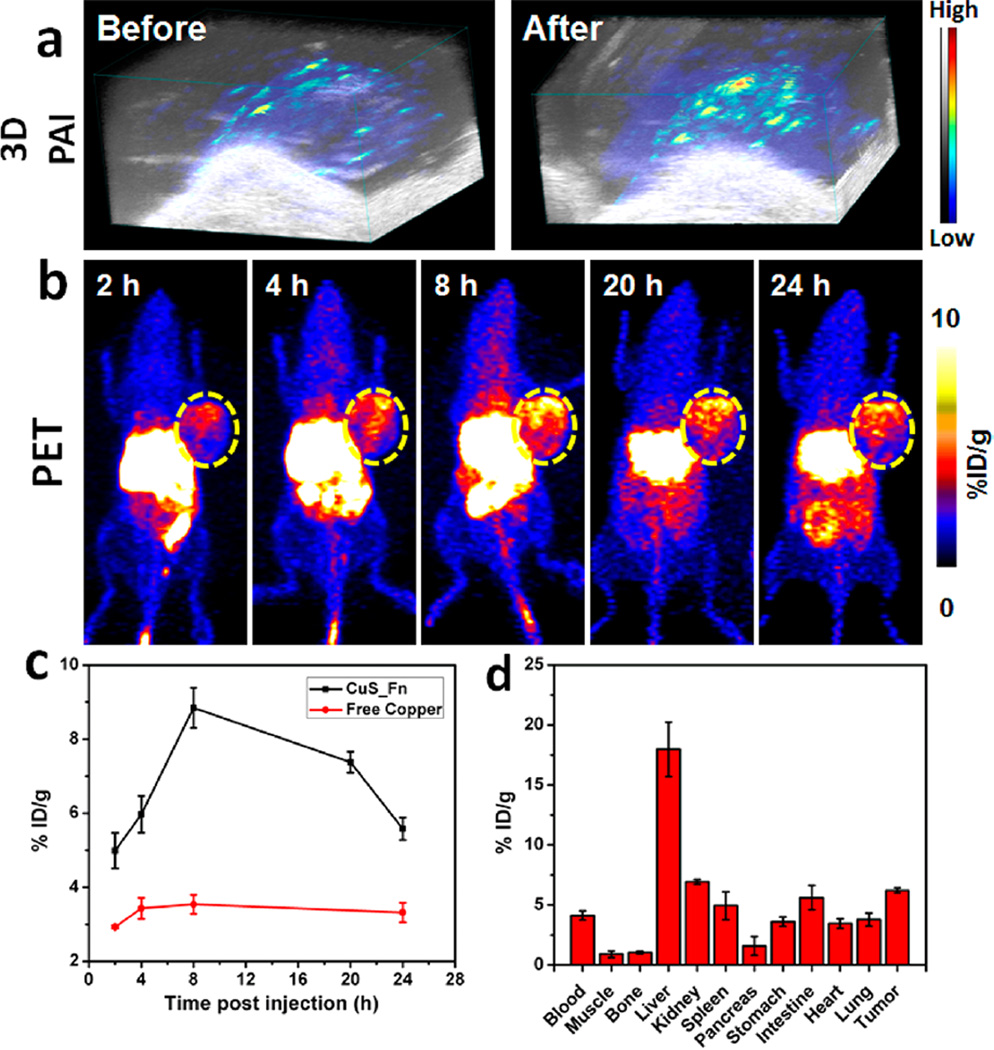
PAI has the great potential for imaging animal or human organs with high contrast and spatial resolution, especially for both vasculature and molecules outside the blood vessels.33,34 The significant photothermal and photoacoustic effects of CuS–Fn NCs motivated us to use PAI to investigate the accumulation behavior of CuS–Fn NCs in vivo. After intravenous injection, a steady increase in PA signal in the tumor region of CuS–Fn NCs-treated mice was observed (Figure S12), and quantification of tumor PA signal was also acquired (Figure S13). 3D–PAI images further confirmed the high PA signal of tumor tissue, which suggests high tumor accumulation of CuS–Fn NCs (Figure 5a).
Figure 5.
Photoacoustic and PET imaging of CuS–Fn NCs. (a) 3D Photoacoustic images of U87 MG tumor pre- and post-CuS–Fn injection. (b) PET images of tumor bearing mice 2, 4, 8, 20, and 24 h after iv injection of 50 µCi 64CuS–Fn NCs. (c) Comparison of time-dependent tumor uptake between 64CuS–Fn NCs and free copper groups. (d) Biodistribution of tumor and primary organs at 24 h time point.
To realize noninvasive and accurate imaging of CuS–Fn NCs, the integration of PAI and PET is a promising strategy that offers high sensitivity and fine spatial resolution, which provides unique advice that is not attainable compared with other modalities. Generally, PET offers noninvasive, sensitive, and quantitative imaging for efficient tumor targeting and pharmacokinetics.35 Radioactive copper, 64Cu, with a half-life of about 13 h, has been widely used in PET imaging. It has been used for tumor theranostics in combination with different nanomaterials such as Fe3O4,36Au,37 and CdSe/ZnS quantum dots.38 In the present case, 64Cu was used to synthesize 64CuS–Fn NCs in situ. The synthesis progress uses hot copper instead of cold copper and it is simple and robust. In brief, 64Cu was added to Fn solution for binding, and then Na2S was added to form copper sulfide inside the Fn cavity. The labeling efficiency was evaluated with instant thin layer chromatography (iTLC). The radiochemical yield of 64CuS–Fn NCs is ~100% (Figures S14 and S15). The stability of 64CuS–Fn NCs was also investigated. Even after 24 h of incubation with sodium acetate, the 64CuS–Fn NCs were still stable without free copper leakage, making them suitable for in vivo PET imaging.
To demonstrate the expediency of 64CuS–Fn NCs for in vivo PET imaging, we intravenously injected 64CuS–Fn NCs into human glioblastoma U87MG-bearing nude mice. The decay-corrected PET images displayed a high tumor-to-normal contrast in 64CuS–Fn NCs-treated mice as shown in Figure 5b. According to a quantitative three-dimensional volumes-of-interest analysis method, the tumor uptake of 64CuS–Fn NCs reached a peak (about 10%ID/g) at 8 h postinjection, and then dropped a little within 24 h. After 24 h postinjection, the mice were sacrificed and flushed with 30 mL of PBS, and the major organs were harvested for ex vivo PET imaging and a biodistribution study (Figure 5d). The high tumor accumulation of 64CuS–Fn NCs was also confirmed by ex vivo PET imaging (Figure S16). The tumor accumulation behavior of CuS–Fn NCs observed with in vivo PET was consistent with that measured by PAI.
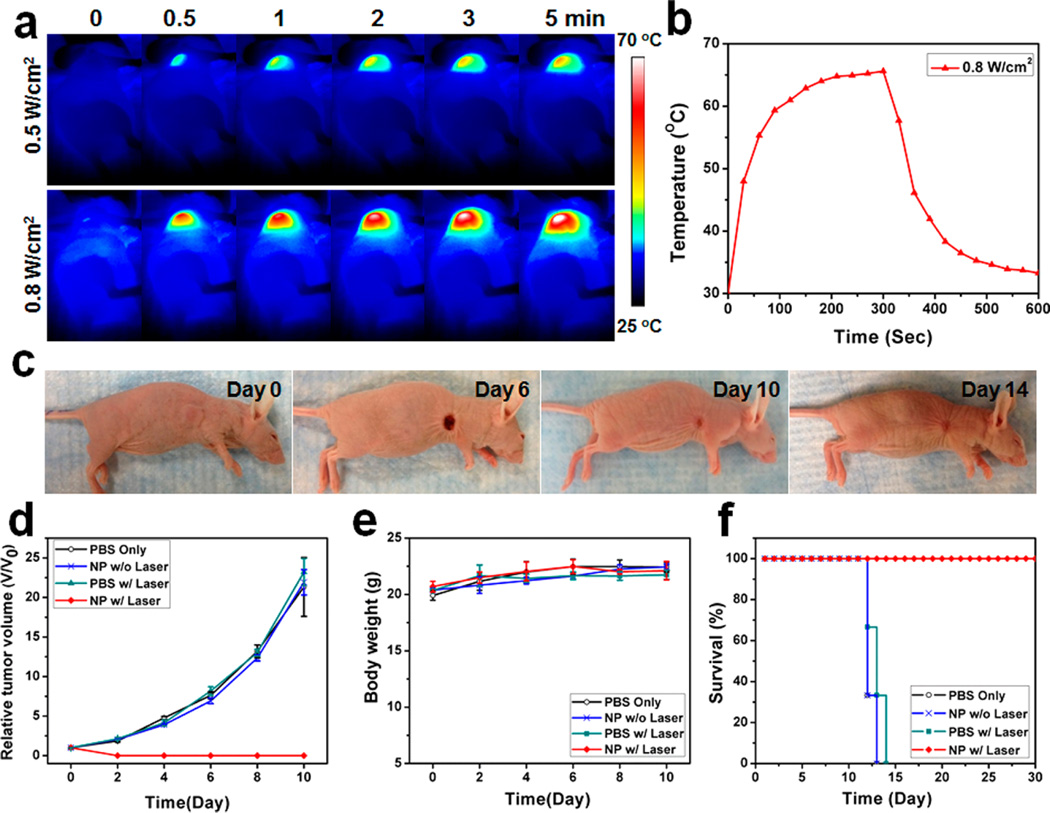
We next studied the potential for PTT of CuS–Fn NCs using the same animal model. On the basis of the tumor accumulation of CuS–Fn NCs in observations with PA and PET imaging, 8 h postinjection was the ideal time point to conduct the PTT treatment. Tumors were exposed upon an 808 nm laser for 5 min, and the temperature increase was monitored with a thermal camera. As shown in Figure 6a,b, upon 5 min laser exposure, the average temperature of the tumor area reached about 65 °C with 0.8 W/cm2 of laser irradiation. Generally, 65 °C is high enough to shrink the tumors.39 In the group with CuS–Fn NCs administration plus laser irradiation, all the tumors were completely eliminated, leaving scars at the original tumor sites at day 14 post treatment without showing recurrence (Figure 6c). As shown in Figure 6d, compared with other groups (PBS administration, PBS administration with laser irradiation, CuS–Fn NCs administration without laser irradiation), 100% tumor elimination was achieved in only the group that had CuS–Fn NCs administration plus laser irradiation. The tumors in other groups kept growing at a similar speed.
Figure 6.
Photothermal therapy of CuS–Fn NCs. (a) Temperature recording of U87 MG tumor mice upon 5 min laser exposure of different powers. (b) Temperature change of tumor area upon laser irradiation. (c) Representative photos of U87MG tumor mice at different days after treatment. Tumor volume (d), body weight (e), and mice survival rate (f) curves of different groups of tumor-bearing mice after treatment.
The toxicity effects are always a concern for clinical translations; we investigated the possible in vivo toxicity of CuS–Fn NCs. Within 10 days after treatment, no apparent body weight change was observed in four groups. Furthermore, due to the high tumor growth rate, mice in the control groups were sacrificed with abnormal large tumors in 2 weeks. We also collected the tumors for H&E staining 2 h after laser irradiation and found significant cancer cell damage that was beyond to repair (Figure S17). For the long-term treatment safety study of CuS–Fn, major organs were collected 15 and 30 days after treatment, and no obvious sign of toxic side effects for CuS–Fn NCs injection was found in these tissues (Figure S18). All together, the potential of CuS–Fn NCs as cancer theranostics for in vivo applications was successfully demonstrated.
CONCLUSIONS
Inspired by natural Fn mineralization, we have developed a unique photothermal theranostic agent with copper sulfide– ferritin nanocages (CuS–Fn NCs) by a biomimetic synthesis method for simultaneous PA/PET dual-modality imaging guided photothermal therapy. The hollow cavity of the Fn nanocage was employed as a nanoreactor to precisely control the size and morphology of CuS. The as-prepared CuS–Fn NCs with 8 nm CuS core show good stability, high water dispersibility, good biocompatibility, and strong NIR absorption. We validated the cancer theranostic capability of CuS–Fn NCs both in vitro and in vivo. Both PAI and PET were successfully used to monitor the in vivo pharmacokinetics of CuS–Fn NCs and guide PTT treatment. Full tumor elimination was achieved by iv injection of CuS–Fn NCs with low a laser irradiation dose (808 nm, 0.8 W cm−2, 5 min). This concept of biomineralization-inspired synthesis of CuS– Fn NCs has potential for clinically translatable cancer theranostics in applications such as cancer diagnosis, treatment, or drug delivery.
EXPERIMENTAL SECTION
Expression and Purification of Fn
Fn expression plasmid was constructed as reported.40 Briefly, rat heavy chain Fn sequence was double digested with Nco I and Xho I, then inserted into pRSFDuet-1 vector. After DNA sequencing verification, the plasmid was transformed into expression strain E. coli BL21 (DE3). One liter of LB medium of Fn E. coli (antibiotic: Kanamycin) was grown at 37 °C until an OD600 of 0.7 was reached, then induced with 1 mM IPTG at 37 °C for 4 h. The bacteria was collected by centrifuge for 10 min at 7000g, the bacteria were sonicated with lysis buffer (PBS with 5 mM EDTA), and after sonication, the supernatant was collected after centrifugation at 12 000g for 10 min. Then, the supernatant was heated at 60 °C for 15 min and centrifuged again at 12 000g for 10 min, and the supernatant was collected. The rough product was purified with a Superdex 200 (GE) column using HPLC. The purified protein was stored at −80 °C.
Iron Removal of Fn
Fn was dialyzed into sodium acetate (50 mM, pH 5.0). After complete buffer change, 10 mM sodium dithionite and 2 mM 2,2′-bipyridine were added to the protein samples to aid iron removal. Then, the solution was dialyzed into 50 mM sodium acetate completely in preparation for use in next step.
Preparation of CuS–Fn NCs
A total of 0.25 mL of CuCl2 (25 mM) solution was added into 0.5 mL of 1 mg/mL Fn with forceful stirring for another 20 min, and then the solution was kept at rest for 20 min at room temperature. Fn–Cu2+ mixture was purified by filtration through a 10 kDa cutoff spin using 0.1% sodium acetate solution as eluent and redissolved in 0.5 mL of ultrapure water with sonication. Then, 0.25 mL of 25 mM Na2S aqueous solution was added in the above solution with stirring at 60 °C for 25 min. The mixture then was transferred to ice bath to stop the reaction. The product was purified with filtration through a 10 kDa cutoff, and redissolved in the ultrapure water with sonication for further use. For 64CuS–Fn NCs preparation, the only difference is using radioactive 64CuCl2 (~150 µCi) as the copper source.
Characterization of CuS–Fn NCs
TEM was used to observe and measure the particle size, morphology, and CuS core size of CuS–Fn NCs. Uranyl acetate (1%) was used for staining of the samples. The UV–vis absorption spectra were measured with a Genesys 10S UV– vis spectrophotometer.
Measurement of Photothermal Effect
CuS–Fn NCs was diluted into different concentrations with PBS. A total of 200 µL of each solution was exposed upon an 808 nm NIR laser for 5 min with different laser powers. A laser energy meter (Coherent Portland, OR, USA) was used to calibrate and measure the laser densities. The temperatures changes of the solution were monitored with an IR thermal imaging system.
Cytotoxicity Assay
Human glioblastoma U87MG cells were cultured in MEM and cultured in 96-well plates at a density of 1 × 10⁴ cells each well. Eighteen hours later, different concentrations of CuS– Fn NCs (10, 5, 2, 1 µg/mL) were added into each well and the mixture was incubated at 37 °C. After 24 h incubation, PBS was used to wash the cells; then 5 µL of MTT solution (10 mg/mL MTT in PBS, pH 7.4) was added to each well and the plate was incubated at 37 °C for another 4 h. After the medium was removed, the intracellular formazan crystals were dissolved into 100 µL of DMSO. The absorbance was measured by a plate reader at 570 nm, and the cell viability was calculated by comparing wells with the CuS–Fn NCs free wells.
Photoacoustic and Photothermal Imaging of CuS–Fn NCs in Vivo
A total of 100 µL of CuS–Fn NCs solution was intravenously injected into tumor-bearing mice. PAI of tumor was performed with a Vevo 2100 LAZR system (VisualSonics, Inc., New York, NY). Photothermal Imaging was monitored by a SC300 infrared camera when the tumors were administrated with 808 nm laser with power density of 0.8 W/cm2 for 5 min.
Animal Models
All animal experiments were performed under a National Institutes of Health Animal Care and Use Committee (NIH-ACUC) approved protocol. A total of 5 × 10⁶ human glioblastoma U87MG cells were subcutaneously injected into the right flank of 6–7 week old athymic nude mice (Harlan). The mice were used for PAI and photothermal therapy when the tumor reached about 60 mm3. It was used for PET imaging when the tumor reached about 300 mm3.
In Vivo PTT Cancer Treatment
U87MG tumor-bearing mice were randomly divided into four groups with 6 mice in each group (CuS–Fn NCs with laser treatment, CuS–Fn NCs only, PBS with laser treatment and PBS only). For each group, mice were intravenously injected with 100 µL of particle or PBS; 24 h later, mice of treatment group were exposed with 0.8 W/cm2 808 nm laser for 5 min. Tumor volumes and mice body weight were measured with a caliper and an electronic balance, respectively, every 2 days after the treatment. Tumor volumes were calculated by an equation: V = width2 × length/2. The relative tumor volumes were normalized to their initial volumes.
MicroPET Imaging
U87MG tumor bearing mice were iv injected with about 50 µCi of 64CuS–Fn NCs. A micro PET (Siemens Inveon) scanner was used for the scanning at various time points after the injection. For each PET scan, 3-dimensional region of interests (ROIs) were drawn on the tumor with decay-corrected whole body coronal images. The %ID/g was then calculated according to the readings.
Biodistribution
Tumor-bearing mice were sacrificed at 24 h after CuS–Fn NCs injection. Tumors and major organs including heart, spleen, kidney, stomach, intestine, lung, liver, bone, and muscle were collected and weighed, then assayed for radioactivity using a gamma counter. The %ID/g was also calculated for comparison.
Ex Vivo Histological Staining
U87MG tumor-bearing mice were sacrificed at different days (2 h after laser irradiation, 15 days after irradiation and 30 days after irradiation); then, tumors (right after laser irradiation time point) and major organs (all three time points) were collected, and tissues were fixed with Z-Fix solution and stored at room temperature. H&E staining (Histoserv, Germantown, MD) was examined by a BX41 bright field microscopy.
Supplementary Material
Acknowledgments
This study was supported by the Major State Basic Research Development Program of China (973 Program) (2014CB744503 and 2013CB733802), the National Natural Science Foundation of China (NSFC) (81422023, 81371596, 51273165, 81401465 and 51573096), the Fundamental Research Funds for the Central Universities, China (2013121039), the Program for New Century Excellent Talents in University (NCET-13-0502), and the Intramural Research Program (IRP), National Institute of Biomedical Imaging and Bioengineering (NIBIB), National Institutes of Health (NIH). Zhantong Wang and Rui Tian were partially funded by the China Scholarship Council (CSC).
Footnotes
ASSOCIATED CONTENT
Supporting Information
The Supporting Information is available free of charge on the ACS Publications website at DOI: 10.1021/acsnano.5b07521.
Additional experimental information, discussions and data (PDF)
Notes
The authors declare no competing financial interest.
REFERENCES
- 1.Nascu C, Pop I, Ionescu V, Indrea E, Bratu I. Spray Pyrolysis Deposition of CuS Thin Films. Mater. Lett. 1997;32:73–77. [Google Scholar]
- 2.Kuchmii SY, Korzhak A, Raevskaya A, Kryukov A. Catalysis of the Sodium Sulfide Reduction of Methylviologene by CuS Nanoparticles. Theor. Exp. Chem. 2001;37:36–41. [Google Scholar]
- 3.Ku G, Zhou M, Song S, Huang Q, Hazle J, Li C. Copper Sulfide Nanoparticles as a New Class of Photoacoustic Contrast Agent for Deep Tissue Imaging at 1064 nm. ACS Nano. 2012;6:7489–7496. doi: 10.1021/nn302782y. [DOI] [PMC free article] [PubMed] [Google Scholar]
- 4.Huang P, Rong P, Lin J, Li W, Yan X, Zhang MG, Nie L, Niu G, Lu J, Wang W, Chen X. Triphase Interface Synthesis of Plasmonic Gold Bellflowers as Near-Infrared Light Mediated Acoustic and Thermal Theranostics. J. Am. Chem. Soc. 2014;136:8307–8313. doi: 10.1021/ja503115n. [DOI] [PMC free article] [PubMed] [Google Scholar]
- 5.Cheng L, Wang C, Feng L, Yang K, Liu Z. Functional Nanomaterials for Phototherapies of Cancer. Chem. Rev. 2014;114:10869–10939. doi: 10.1021/cr400532z. [DOI] [PubMed] [Google Scholar]
- 6.Yang K, Zhang S, Zhang G, Sun X, Lee S-T, Liu Z. Graphene in Mice: Ultrahigh in Vivo Tumor Uptake and Efficient Photothermal Therapy. Nano Lett. 2010;10:3318–3323. doi: 10.1021/nl100996u. [DOI] [PubMed] [Google Scholar]
- 7.Cheng L, He W, Gong H, Wang C, Chen Q, Cheng Z, Liu Z. Pegylated Micelle Nanoparticles Encapsulating a Non-Fluorescent near-Infrared Organic Dye as a Safe and Highly-Effective Photothermal Agent for in Vivo Cancer Therapy. Adv. Funct. Mater. 2013;23:5893–5902. [Google Scholar]
- 8.Zhang J, Zhang Z. Hydrothermal Synthesis and Optical Properties of Cus Nanoplates. Mater. Lett. 2008;62:2279–2281. [Google Scholar]
- 9.Zhu H, Wang J, Wu D. Fast Synthesis, Formation Mechanism, and Control of Shell Thickness of Cus Hollow Spheres. Inorg. Chem. 2009;48:7099–7104. doi: 10.1021/ic900201p. [DOI] [PubMed] [Google Scholar]
- 10.Yu X, Cao C, Zhu H, Li Q, Liu C, Gong Q. Nanometer Sized Copper Sulfide Hollow Spheres with Strong Optical Limiting Properties. Adv. Funct. Mater. 2007;17:1397–1401. [Google Scholar]
- 11.Zhang X, Wang G, Gu A, Wei Y, Fang B. CuS Nanotubes for Ultrasensitive Nonenzymatic Glucose Sensors. Chem. Commun. 2008;45:5945–5947. doi: 10.1039/b814725f. [DOI] [PubMed] [Google Scholar]
- 12.Huang P, Li Z, Hu H, Cui D. Synthesis and Characterization of Bovine Serum Albumin-Conjugated Copper Sulfide Nanocomposites. J. Nanomater. 2010;2010:33–38. [Google Scholar]
- 13.Huang P, Kong Y, Li Z, Gao F, Cui D. Copper Selenide Nanosnakes: Bovine Serum Albumin-Assisted Room Temperature Controllable Synthesis and Characterization. Nanoscale Res. Lett. 2010;5:949–956. doi: 10.1007/s11671-010-9587-0. [DOI] [PMC free article] [PubMed] [Google Scholar]
- 14.Lu Q, Gao F, Zhao D. One-Step Synthesis and Assembly of Copper Sulfide Nanoparticles to Nanowires, Nanotubes, and Nano-vesicles by a Simple Organic Amine-Assisted Hydrothermal Process. Nano Lett. 2002;2:725–728. [Google Scholar]
- 15.Goel S, Chen F, Cai W. Synthesis and Biomedical Applications of Copper Sulfide Nanoparticles: From Sensors to Theranostics. Small. 2014;10:631–645. doi: 10.1002/smll.201301174. [DOI] [PMC free article] [PubMed] [Google Scholar]
- 16.Xu H, Wang W, Zhu W, Zhou L. Synthesis of Octahedral Cus Nanocages Via a Solid-Liquid Reaction. Nanotechnology. 2006;17:3649–3654. [Google Scholar]
- 17.Huang P, Yang D, Zhang C, Lin J, He M, Bao L, Cui D. Protein-Directed One-Pot Synthesis of Ag Microspheres with Good Biocompatibility and Enhancement of Radiation Effects on Gastric Cancer Cells. Nanoscale. 2011;3:3623–3626. doi: 10.1039/c1nr10586h. [DOI] [PubMed] [Google Scholar]
- 18.Huang P, Bao L, Yang D, Gao G, Lin J, Li Z, Zhang C, Cui D. Protein Directed Solution Phase Green Synthesis of Bsa Conjugated MxSey (M = Ag, Cd, Pb, Cu) Nanomaterials. Chem. - Asian J. 2011;6:1156–1162. doi: 10.1002/asia.201000818. [DOI] [PubMed] [Google Scholar]
- 19.Allen M, Willits D, Young M, Douglas T. Constrained Synthesis of Cobalt Oxide Nanomaterials in the 12-Subunit Protein Cage from Listeria Innocua. Inorg. Chem. 2003;42:6300–6305. doi: 10.1021/ic0343657. [DOI] [PubMed] [Google Scholar]
- 20.Douglas T, Strable E, Willits D, Aitouchen A, Libera M, Young M. Protein Engineering of a Viral Cage for Constrained Nanomaterials Synthesis. Adv. Mater. 2002;14:415–418. [Google Scholar]
- 21.Huang P, Rong P, Jin A, Yan X, Zhang MG, Lin J, Hu H, Wang Z, Yue X, Li W, Niu G, Zeng W, Wang W, Zhou K, Chen X. Dye-Loaded Ferritin Nanocages for Multimodal Imaging and Photothermal Therapy. Adv. Mater. 2014;26:6401–6408. doi: 10.1002/adma.201400914. [DOI] [PMC free article] [PubMed] [Google Scholar]
- 22.Chasteen ND, Harrison PM. Mineralization in Ferritin: An Efficient Means of Iron Storage. J. Struct. Biol. 1999;126:182–194. doi: 10.1006/jsbi.1999.4118. [DOI] [PubMed] [Google Scholar]
- 23.Cowley J, Janney DE, Gerkin R, Buseck PR. The Structure of Ferritin Cores Determined by Electron Nanodiffraction. J. Struct. Biol. 2000;131:210–216. doi: 10.1006/jsbi.2000.4292. [DOI] [PubMed] [Google Scholar]
- 24.Douglas T, Dickson DP, Betteridge S, Charnock J. Synthesis and Structure of an Iron (III) Sulfide-Ferritin Bioinorganic Nanocomposite. Science. 1995;269:54. doi: 10.1126/science.269.5220.54. [DOI] [PubMed] [Google Scholar]
- 25.Liu X, Jin W, Theil EC. Opening Protein Pores with Chaotropes Enhances Fe Reduction and Chelation of Fe from the Ferritin Biomineral. Proc. Natl. Acad. Sci. U. S. A. 2003;100:3653–3658. doi: 10.1073/pnas.0636928100. [DOI] [PMC free article] [PubMed] [Google Scholar]
- 26.Price DJ, Joshi J. Ferritin. Binding of Beryllium and Other Divalent Metal Ions. J. Biol. Chem. 1983;258:10873–10880. [PubMed] [Google Scholar]
- 27.Butts CA, Swift J, Kang S-g, Di Costanzo L, Christianson DW, Saven JG, Dmochowski IJ. Directing Noble Metal Ion Chemistry within a Designed Ferritin Protein. Biochemistry. 2008;47:12729–12739. doi: 10.1021/bi8016735. [DOI] [PubMed] [Google Scholar]
- 28.Price D, Joshi JG. Ferritin: A Zinc Detoxicant and a Zinc Ion Donor. Proc. Natl. Acad. Sci. U. S. A. 1982;79:3116–3119. doi: 10.1073/pnas.79.10.3116. [DOI] [PMC free article] [PubMed] [Google Scholar]
- 29.Kasyutich O, Ilari A, Fiorillo A, Tatchev D, Hoell A, Ceci P. Silver Ion Incorporation and Nanoparticle Formation inside the Cavity of Pyrococcus Furiosus Ferritin: Structural and Size-Distribution Analyses. J. Am. Chem. Soc. 2010;132:3621–3627. doi: 10.1021/ja910918b. [DOI] [PubMed] [Google Scholar]
- 30.Pead S, Durrant E, Webb B, Larsen C, Heaton D, Johnson J, Watt G. Metal Ion Binding to Apo, Holo, and Reconstituted Horse Spleen Ferritin. J. Inorg. Biochem. 1995;59:15–27. doi: 10.1016/0162-0134(94)00050-k. [DOI] [PubMed] [Google Scholar]
- 31.Liang M, Fan K, Zhou M, Duan D, Zheng J, Yang D, Feng J, Yan X. H-Ferritin-Nanocaged Doxorubicin Nanoparticles Specifically Target and Kill Tumors with a Single-Dose Injection. Proc. Natl. Acad. Sci. U. S. A. 2014;111:14900–14905. doi: 10.1073/pnas.1407808111. [DOI] [PMC free article] [PubMed] [Google Scholar]
- 32.Huang P, Gao Y, Lin J, Hu H, Liao H-S, Yan X, Tang Y, Jin A, Song J, Niu G, Zhang G, Horkay F, Chen X. Tumor-Specific Formation of Enzyme-Instructed Supramolecular Self-Assemblies as Cancer Theranostics. ACS Nano. 2015;9:9517–9527. doi: 10.1021/acsnano.5b03874. [DOI] [PMC free article] [PubMed] [Google Scholar]
- 33.Song J, Yang X, Jacobson O, Huang P, Sun X, Lin L, Yan X, Niu G, Ma Q, Chen X. Biomedical Applications: Ultrasmall Gold Nanorod Vesicles with Enhanced Tumor Accumulation and Fast Excretion from the Body for Cancer Therapy. Adv. Mater. 2015;27:4805–4805. doi: 10.1002/adma.201502486. [DOI] [PubMed] [Google Scholar]
- 34.Huang P, Lin J, Li W, Rong P, Wang Z, Wang S, Wang X, Sun X, Aronova M, Niu G, Leapman R, Nie Z, Chen X. Biodegradable Gold Nanovesicles with an Ultrastrong Plasmonic Coupling Effect for Photoacoustic Imaging and Photothermal Therapy. Angew. Chem. 2013;125:14208–14214. doi: 10.1002/anie.201308986. [DOI] [PMC free article] [PubMed] [Google Scholar]
- 35.Hu H, Huang P, Weiss OJ, Yan X, Yue X, Zhang MG, Tang Y, Nie L, Ma Y, Niu G, Wu K, Chen X. PET and NIR Optical Imaging Using Self-Illuminating 64Cu-Doped Chelator-Free Gold Nanoclusters. Biomaterials. 2014;35:9868–9876. doi: 10.1016/j.biomaterials.2014.08.038. [DOI] [PMC free article] [PubMed] [Google Scholar]
- 36.Wong RM, Gilbert DA, Liu K, Louie AY. Rapid Size-Controlled Synthesis of Dextran-Coated, 64Cu-Doped Iron Oxide Nanoparticles. ACS Nano. 2012;6:3461–3467. doi: 10.1021/nn300494k. [DOI] [PubMed] [Google Scholar]
- 37.Sun X, Huang X, Guo J, Zhu W, Ding Y, Niu G, Wang A, Kiesewetter DO, Wang ZL, Sun S, Chen X. Self-Illuminating 64Cu-Doped CdSe/ZnS Nanocrystals for in Vivo Tumor Imaging. J. Am. Chem. Soc. 2014;136:1706–1709. doi: 10.1021/ja410438n. [DOI] [PMC free article] [PubMed] [Google Scholar]
- 38.Sun X, Huang X, Yan X, Wang Y, Guo J, Jacobson O, Liu D, Szajek LP, Zhu W, Niu G, Kiesewetter D, Sun S, Chen X. Chelator-Free 64Cu-Integrated Gold Nanomaterials for Positron Emission Tomography Imaging Guided Photothermal Cancer Therapy. ACS Nano. 2014;8:8438–8446. doi: 10.1021/nn502950t. [DOI] [PMC free article] [PubMed] [Google Scholar]
- 39.Rong P, Huang P, Liu Z, Lin J, Jin A, Ma Y, Niu G, Yu L, Zeng W, Wang W, Chen X. Protein-Based Photothermal Theranostics for Imaging-Guided Cancer Therapy. Nanoscale. 2015;7:16330–16336. doi: 10.1039/c5nr04428f. [DOI] [PMC free article] [PubMed] [Google Scholar]
- 40.Lin X, Xie J, Niu G, Zhang F, Gao H, Yang M, Quan Q, Aronova MA, Zhang G, Lee S, Leapman R, Chen X. Chimeric Ferritin Nanocages for Multiple Function Loading and Multimodal Imaging. Nano Lett. 2011;11:814–819. doi: 10.1021/nl104141g. [DOI] [PMC free article] [PubMed] [Google Scholar]
Associated Data
This section collects any data citations, data availability statements, or supplementary materials included in this article.


