

Abstract
Neuroinflammation is an important contributor to Alzheimer's disease (AD) pathogenesis, as underscored by the recent identification of immune-related genetic risk factors for AD, including coding variants in the gene TREM2 (triggering receptor expressed on myeloid cells 2). Understanding TREM2 function promises to provide important insights into how neuroinflammation contributes to AD pathology. However, studies so far have produced seemingly conflicting results, with reports that amyloid pathology can be both decreased and increased in TREM2-deficient AD mouse models. In this study, we unify these previous findings by demonstrating that TREM2 deficiency ameliorates amyloid pathology early, but exacerbates it late in disease progression in the APPPS1–21 mouse model of AD. We also demonstrate that TREM2 deficiency decreases plaque-associated myeloid cell accumulation by reducing cell proliferation, specifically late in pathology. In addition, TREM2 deficiency reduces myeloid cell internalization of amyloid throughout pathology, but decreases inflammation-related gene transcript levels selectively late in disease progression. Together, these results suggest that TREM2 plays distinct functional roles at different stages in AD pathology.
SIGNIFICANCE STATEMENT Alzheimer's disease (AD) is a devastating neurodegenerative disorder and there are currently no effective treatments that modify disease progression. However, the recent identification of genetic risk factors for AD promises to provide new insight into AD biology and possible new therapeutic targets. Among these risk factors, variants in the gene TREM2 (triggering receptor expressed on myeloid cells 2) confer greatly elevated risk for developing the disease. We demonstrate that TREM2 deficiency has opposing effects on AD-related pathologies at early and late stages of disease progression, unifying previous work in the field. In addition, we examine how TREM2 affects the function of the brain immune cell populations in which it is expressed throughout disease progression to understand possible mechanisms underlying its differential impacts on pathology.
Keywords: AD, genetic risk factor, inflammation, microglia, myeloid cell, neuroinflammation
Introduction
Alzheimer's disease (AD) is characterized by a robust neuroinflammatory response (McGeer et al., 1987; Itagaki et al., 1989; Heneka et al., 2015). In the past several years, genetic studies have identified variants in immune-related genes that confer risk for developing AD (Karch and Goate, 2015), directly implicating this neuroinflammatory response in AD pathogenesis. Of these risk factors, coding variants in the gene TREM2 (triggering receptor expressed on myeloid cells 2) confer the highest AD risk (Guerreiro et al., 2013; Jonsson et al., 2013; Lill et al., 2015). TREM2 encodes a receptor that is expressed exclusively on immune cells within the brain (Schmid et al., 2002; Colonna, 2003) and, in AD, is upregulated by plaque-associated myeloid cells (Frank et al., 2008; Melchior et al., 2010; Jay et al., 2015). These brain myeloid cells include microglia, brain-resident macrophages, and, in the context of AD, may also include macrophages derived from peripheral monocytes (El Khoury et al., 2007; Gate et al., 2010; Koronyo et al., 2015). TREM2's genetic linkage to AD suggests that these myeloid cells play an important role in AD pathogenesis. Understanding more about TREM2 expression and function within these cells promises to provide insights into the complex roles that immune cells perform in the context of AD.
To investigate the functional role of TREM2 and assess its impact on AD pathology, recent studies examined TREM2-deficient AD mouse models. Collectively, these studies demonstrated that TREM2 deficiency reduces accumulation of myeloid cells around plaques (Ulrich et al., 2014; Jay et al., 2015; Wang et al., 2015) and attenuates inflammation-related gene expression (Jay et al., 2015; Wang et al., 2015). However, these studies differed in their conclusions regarding the impact of TREM2 deficiency on amyloid pathology (Tanzi, 2015). Jay et al. (2015) reported reduced amyloid pathology early in disease progression in the hippocampus of 4-month-old APPPS1;Trem2−/− mice, whereas Wang et al. (2016) found no difference in amyloid pathology in the hippocampus of 4-month-old 5XFAD;Trem2−/− mice compared with controls (Wang et al., 2016), but increased amyloid accumulation at 8.5 months of age (Wang et al., 2015) (summarized in Table 1). These opposing findings raised concerns in the field about possible model-specific or facility-dependent (Montalvo et al., 2013) effects of TREM2 deficiency on pathology. Because these studies examined the effects of TREM2 deficiency at different time points in disease progression, these divergent findings could also be explained by distinct roles of TREM2 at different stages of pathology.
Table 1.
Effects of Trem2 deficiency on AD-related pathologies
| Mouse model | Age, mo | Brain region | Approximate stage of amyloid deposition | Changes in amyloid pathology | Accumulation of myeloid cells around plaques | Inflammatory gene transcript levels | Reference |
|---|---|---|---|---|---|---|---|
| 5XFAD;Trem2−/− | 4 | Cortex | Early–middle | ↔ | ↓ | N/A | Wang et al., 2016 |
| Hippocampus | Middle | ↔ | N/A | ||||
| 5XFAD;Trem2−/− | 8.5 | Cortex | Middle–late | ↔ | ↓ | ↓ | Wang et al., 2015 |
| Hippocampus | Late | ↑ | ↓ | ||||
| APPPS1;Trem2−/− | 2 | Cortex | Early | ↓ | ↓ | ↔ | Current Study |
| APPPS1;Trem2−/−;Cx3cr1GFP/+ | 3 | Unknown | N/A | N/A | ↓ | N/A | Wang et al., 2015 |
| APPPS1;Trem2−/− | 4–4.5 | Cortex | Middle | ↔ | ↓ | ↓ | Jay et al., 2015 |
| Hippocampus | Early | ↓ | ↓ | ||||
| APPPS1;Trem2−/− | 8 | Cortex | Late | ↑ | ↓ | ↓ | Current study |
| Hippocampus | Middle–late | ↔ | ↓ (data not shown) | ↓ (data not shown) | Current study |
In this study, we assess the functional role of TREM2 in the APPPS1 (Radde et al., 2006) AD mouse model at early and late stages of disease to determine whether TREM2 might play a disease-progression-dependent role in modifying AD pathology and myeloid cell function.
Materials and Methods
Mice.
The APPPS1–21 (APPPS1) mouse model of AD (provided by Mathias Jucker) expresses human familial mutations in APP (K670M/N671L) and PSEN1 (L166P) under the control of the Thy1 promoter (Radde et al., 2006). These mice were crossed with Trem2−/− mice (TREM2tm1(KOMP)Vlcg) from the National Institutes of Health's knock-out mouse project, which express a lacZ reporter in place of exons 2, 3, and part of 4. These mice were previously characterized to lack TREM2 expression (Jay et al., 2015). All mice were maintained on a B6 background. Because previous studies have suggested that sex may affect the time course of pathology development in this model, both sexes of mice were used for these experiments. The number of each sex used in each experiment is indicated in the figure legends. Mice were housed in the American Association for Laboratory Animal Care-accredited facility in the Cleveland Clinic Biological Resources Unit and all experimental procedures were approved by the Cleveland Clinic Foundation Institutional Animal Care and Use Committee.
Quantitative RT-PCR.
Mice were perfused with PBS and their cortices dissected and snap frozen on dry ice. Cortices were homogenized in PBS with 1% NP-40, 0.5% sodium deoxycholate, and 0.1% SDS. Lysates were added to an equal volume of RNA-Bee and kept at −80°C until use. RNA was isolated using chloroform extraction and purified using the Purelink RNA Mini Kit (Life Technologies). Samples were treated with an on-column DNase Purelink kit (Life Technologies). cDNA was prepared from 500 ng of RNA using a QuantiTech Reverse Transcription kit (Qiagen) and qPCR performed using the StepOne Plus Real Time PCR system (Life Technologies) using TaqMan assays. Relative gene expression is graphed as the fold change gene expression. ΔCT values were used for statistical analyses and are reported in the results for each genotype.
Immunohistochemistry.
Mice were deeply anesthetized with ketamine xylazine and perfused with ice-cold PBS. Brains were removed and one hemisphere was drop fixed in 4% PFA at 4°C overnight and cryoprotected in 30% sucrose before snap freezing in optimal cutting temperature compound. Brains were crysosectioned into 30 μm sections and stored at 4°C in PBS until use. For immunofluoresecent staining, slices were permeabilized in PBS with 0.1% Triton X-100 and then antigen retrieval was performed using 10 mm sodium citrate with 0.5% Tween, pH 6.0, at 85°C for 15 min and then at room temperature (RT) for 30 min. Slices were blocked in 5% NGS/0.3% Triton X-100 in 1× PBS for 1 h and then incubated in the following primary antibodies overnight at 4°C: 6E10 (Covance, 1:1000), Iba1 (Wako, 1:1000), GFAP (Sigma-Aldrich, 1:1000), S100β (R&D Systems, 1:500). Slices were incubated with Alexa Fluor-conjugated secondary antibodies at a 1:1000 concentration for 1 h at RT. Mouse on mouse blocking reagent (Vector Laboratories) was added to the blocking solution for all antibodies raised in mouse or rat. Slices were mounted using Prolong Gold. Cleaved caspase 3 staining (Cell Signaling Technology, 1:100) was performed as described except antigen retrieval was performed using Reveal Decloaker (Biocare Medical) at 85°C for 15 min and then at RT for 30 min; sections were incubated in primary antibody for 48 h. BrdU staining (Abcam, 1:50) was performed as described above except, after antigen retrieval, sections were incubated in 2 m HCl at 37°C for 20 min and then incubated in 0.1 m sodium borate for 10 min at RT before blocking.
Immunohistochemistry for CD45 (ABD Serotec 1:500) followed the same procedure with the exception of incubation in 1% H2O2 in PBS for 30 min after antigen retrieval and biotinylated secondary antibodies were used at a 1:200 concentration. Vectastain Elite ABC kit (Vector Laboratories) was added to sections for 1 h, followed by incubation with diaminobenzidine with nickel chloride. Sections were costained where indicated with Congo Red, which has been used previously to characterize amyloid pathology in this AD model (Radde et al., 2006). A 1% w/v solution of Congo Red was prepared in 80% ethanol and allowed to stir overnight before being filtered. Sections were incubated in this Congo Red solution for 1 h; dehydrated in 70%, 95%, and 100% ethanol; and the tissue cleared in xylene. Slices were mounted using Permount.
Brightfield images were acquired on a Leica DMLS microscope using a QImaging camera and QCapture Software (QImaging). Whole-brain images were acquired using a SCN400F slide scanner with a motorized stage using Leica SCN Software. Confocal images were acquired on an LSM 510 META microscope. A total of 10–30 sections 1 μm apart were stacked and reconstructed using ImageJ.
Image analysis.
GFAP, S100β, and CD45 expression was assessed by determining the immunoreactive area around plaques. For these analyses, one lateral and one medial section were matched for each animal. Two representative fields, one in the motor cortex and one in the frontal cortex, were acquired for each slice. Individual ROIs were defined by taking a circle 100 μm in diameter centered in the middle of each plaque in the field of view. These areas were then thresholded manually by a blinded observer to distinguish immunoreactivity from background. The percentage immunoreactive area within each ROI was recorded for each plaque and averaged within each field of view. These values were then averaged across images to produce the percentage immunoreactive area/plaque value reported for each mouse.
The number of Iba1+ cells per plaque was quantified. For these analyses, three slices from medial to lateral were matched and stained for each animal. Two images were acquired per slice in randomized regions of the cortex by an experimenter blinded to genotype. Images were taken 1 μm apart from the first plane containing a plaque in the field of view through the last. Z stacks were projected from these images and ROIs defined around each plaque as described above. An independent blinded observer quantified the number of Iba1+ cell bodies within that defined ROI. These numbers were averaged for each image and the images were averaged together to define the number of Iba1+ cells per plaque.
The number of CD45+ cells per square millimeter was quantified. For these analyses, slide scans of whole cortices from one medial and one lateral matched sagittal slice were acquired. A blinded observer counted the number of CD45+ cells manually across the cortex in each section and recorded the area of the cortex within each section. The number of CD45+ cells per square millimeter was recorded for each section and averaged across both sections for each animal.
The number of Thioflavin S+ plaques per square millimeter was quantified. For these analyses, every 12th section across the hemibrain was stained with ThioS and images of the whole cortex in each section were acquired on a slide scanner. A blinded observer recorded the area of each cortex and the number of ThioS+ plaques per cortex for each section. The number of ThioS+ plaques per square millimeter was determined for each section and these values were averaged across sections to determine the number of ThioS+ plaques per square millimeter for each animal.
6E10 immunoreactive area and plaque size were quantified from slide-scanned images of the cortex from every 12th section across the hemibrain. A blinded observer quantified these images by making ROIs around each plaque and determining the total 6E10-immunoreactive area for each plaque within each cortical section. The 6E10+ area for each plaque was then added together to yield the total 6E10+ area for each cortical section. This approach was used instead of making a global threshold across the whole cortex to avoid thresholding edge effects from tiling and nonspecific binding to blood vessels. This total 6E10+ area was divided by the total area of the cortical section to determine the percentage 6E10+ area for each slice. This number was averaged across all sections for each animal. Plaque size was determined from the same data using the area recorded for each plaque in the analysis above and averaging these across each section. The averages of these sections were then recorded as average plaque area, given in arbitrary units.
The number of BrdU+ Iba1+ cells per cortical section was quantified. For these analyses, matched lateral and medial sections were imaged on a slide scanner and images of Iba1 and BrdU were overlaid. A blinded observer quantified the number of BrdU+ Iba1+ cells in each cortical section and these values were averaged between sections. Ki67+ Iba1+ cells were quantified in the same manner.
Flow cytometry.
Mice were anesthetized with ketamine xylazine and perfused with ice-cold Hank's balanced salt solution. Brains were chopped and digested using the Miltenyi Neural Dissociation kit at 37°C. Cells were washed, strained, and resuspended in a 30% Percoll solution. Then, 10% FBS was overlaid and the myelin at the interface removed after centrifugation. Cells collected at the bottom of the gradient were resuspended in FACS buffer (PBS, 1% BSA, 0.1% NaN3, 5 mm EDTA) and filtered. Cells were blocked with a 1:200 concentration of CD16/CD32 antibody (BD PharMingen) for 10 min. Samples were pooled for unstained and single stained controls. Cells were stained with a mastermix of CD45:AX700 (BioLegend, 1:500) and CD11b:BV605 (BioLegend, 1:500). Cells were then fixed and permeabilized using the BD Biosciences Cytofix/Cytoperm kit and then exposed to 1 m HCl at RT for 10 min, centrifuged, and resuspended in 0.1 m sodium borate for 5 min. Cells were then stained in permeabilization buffer with BrdU (Abcam, 1:100) for 30 min at RT. Cells were then washed and resuspended in permeabilization buffer containing 1:1000 concentration of Alexa Fluor-488 secondary at RT for 15 min. Cells were resuspended in PBS and stored at 4°C overnight. Events were acquired on a Fortessa SORP (BD Biosciences) and analyzed using FlowJo. For analysis, events were gated on single cells and CD11b-positive events. Samples with >5000 CD11b-positive events were included in the analysis.
Western blotting.
Tissue was extracted and processed as described above, then sonicated and centrifuged. Protein concentration was determined using a BCA kit (Thermo Scientific). Proteins were boiled for 5 min at 95°C in sample buffer containing DTT. Then, 30 μg of protein per sample was loaded into 4–12% Bis-Tris gels (Life Technologies) and run at 100 V. Protein was transferred onto IR-compatible PVDF membranes on ice in a Tris glycine buffer containing methanol at 100 V for 1 h. Membranes were blocked in a 1:1 dilution of TBS Odyssey Blocking Buffer: TBS for 1 h at RT and incubated with the indicated primary antibodies in blocking buffer overnight at 4°C: 6E10 (BioLegend, 1:5000) or actin (Santa Cruz Biotechnology, 1:1000). Membranes were washed in TBS and incubated in a 1:10,000 dilution of the appropriate IR-dye-conjugated secondary antibody in blocking buffer for 1 h at RT. Membranes were imaged and analyzed using the Odyssey imaging system. Each sample was normalized to actin and the graphs represent these values normalized to the mean of the APPPS1;Trem2+/+ group at each time point.
Statistics.
Statistical analyses were performed using GraphPad Prism. Although graphed together, experiments at the 2- and 8-month time points were performed independently, so statistical comparisons were only made between genotypes within a given age. Two-sided, unpaired t tests were used to determine statistical differences between groups at each time point. Column statistics were performed to identify outliers and these samples were excluded. Each n is a single biological replicate. Graphs represent the mean and error bars denote the SEM. Statistical values in the text are expressed as follows: (mean ± SEM values for APPPS1;Trem2+/+ vs mean ± SEM values for APPPS1;Trem2−/−, t(degrees of freedom) = t-value, p-value). Power analyses were not used to determine group sizes, but the number of replicates included here are comparable to those used in previous studies (Ulrich et al., 2015; Wang et al., 2015; Jay et al., 2016). Mice from three separate cohorts were included for each group.
Results
Loss of TREM2 alters the temporal progression of amyloid pathology
To evaluate the effect of TREM2 deficiency on amyloid pathology longitudinally, we expanded on our previous work examining 4-month-old TREM2-deficient APPPS1 mice by assessing amyloid plaque area and number in the cortex of 2- and 8-month-old APPPS1;Trem2+/+ and APPPS1;Trem2−/− mice. At 2 months of age, an early stage of amyloid deposition in the cortex of the APPPS1 model, analysis of 6E10 immunoreactive area revealed a significant reduction in total plaque area in TREM2-deficient mice (Fig. 1e, representative images in Fig. 1a; WT 0.38 ± 0.02 vs KO 0.23 ± 0.05, t(8) = 2.8, p = 0.021). At 4 months of age, a midpoint in amyloid deposition in the cortex in the APPPS1 mouse model, we reported previously that there were no significant differences in 6E10 area in the cortex (Jay et al., 2015). When total plaque area was examined in the cortex at 8 months of age, a relatively late time point in disease progression, we found a significant increase in 6E10-immunoreactive area in TREM2-deficient mice (Fig. 1e, representative images in Fig. 1b; WT 1.39 ± 0.18 vs KO 3.04 ± 0.38, t(11) = 3.7, p = 0.004). Together, these findings demonstrate that TREM2 deficiency reduces cortical plaque area early, but increases it late in disease progression (summarized in Table 1).
Figure 1.

TREM2 deficiency reduces amyloid pathology early but exacerbates it late in disease progression. a, b, The 6E10-immunoreactive area was assessed in the cortex of APPPS1;Trem2+/+ and APPPS1;Trem2−/− mice at 2 months of age (a) and 8 months of age (b). c, d, Thioflavin S+ plaque number per square millimeter was assessed in APPPS1;Trem2+/+ and APPPS1;Trem2−/− mice at 2 months of age (c) and 8 months of age (d). e, There was a significant reduction in 6E10 immunoreactive area in the cortex of 2-month-old TREM2-deficient mice (WT, n = 3 M/2 F; KO, n = 3 M/2 F) and a significant increase in 6E10 immunoreactive area in the cortex of 8-month-old TREM2-deficient mice compared with controls (WT, n = 4 M/2 F; KO, n = 4 M/3 F). f, There was a trend toward a reduction in the density of ThioS+ plaque number in the cortex of 2-month-old APPPS1;Trem2−/− cortex compared with APPPS1;Trem2+/+ controls (WT, n = 4 M/2 F; KO, n = 3 M/3 F), but no significant difference in ThioS+ plaque density in the cortex of 8-month-old TREM2-deficient mice (WT, n = 4 M/2 F; KO, n = 5 M/3 F). g, Analysis of 6E10+ plaque size revealed no significant differences in 2-month-old TREM2-deficient mice (WT, n = 3M/2F; KO, n = 3M/3F), but a significant increase in 8-month-old TREM2-deficient mice compared with controls (WT, n = 4 M/2 F; KO, n = 4 M/2 F). h, Transcript levels of human APP were assessed in 2-month-old mice (WT, n = 4 M/2 F; KO, n = 3 M/3 F) and 8-month-old mice (WT, n = 4 M/2 F; KO, n = 3 M/3 F). i, Western blots were used to examine the protein levels of human APP using 6E10 in cortical lysates from 2-month-old mice (WT, n = 3 M/2 F; KO, n = 3M/2F) and 8-month-old mice (WT, n = 3 M/2 F; KO, n = 3 M/2 F) mice. j, APP protein levels were normalized to actin and the fold change expressed to the WT for each age. ns, Not significant; *p < 0.05; **p < 0.01.
We next examined the effects of TREM2 deficiency on plaque number by quantifying the density of Thioflavin S+ plaques in the cortex of 2- and 8-month old APPPS1;Trem2+/+ and APPPS1;Trem2−/− mice. At 2 months of age, there was a trend toward a reduction in the density of Thioflavin S+ plaques in TREM2-deficient mice compared with controls (Fig. 1f, representative images in Fig. 1c; WT 0.095 ± 0.006 vs KO 0.063 ± 0.014, t(12) = 2.0, p = 0.072), consistent with the significant reduction in plaque area at that time point. At 8 months of age, we did not detect any significant differences in Thioflavin S+ plaque density in TREM2-deficient APPPS1 mice (Fig. 1f, representative images in Fig. 1d; WT 0.13 ± 0.01 vs KO 0.13 ± 0.02, t(12) = 0.1, p = 0.930). These data suggest that TREM2 deficiency decreases plaque number selectively at early stages of disease progression.
To address possible explanations for the increase in total plaque area without concomitant changes in plaque number in TREM2-deficient mice at 8 months of age, we assessed whether the average size of plaques in TREM2-deficient mice might be altered late stage in disease progression. Quantification of average plaque size revealed no significant differences between 2-month-old APPPS1;Trem2−/− mice compared with APPPS1;Trem2+/+ mice (WT 7.07 ± 0.98 vs KO 5.76 ± 0.49, t(9) = 1.3, p = 0.240), but, at 8 months of age, there was a striking increase in the average plaque size in TREM2-deficient mice (Fig. 1g; WT 26.79 ± 4.57 vs KO 60.99 ± 9.79, t(9) = 2.5, p = 0.034). This is consistent with recent findings demonstrating that TREM2 deficiency can lead to increased diffuseness of plaques with greater fibril extension (Wang et al., 2016; Yuan et al., 2016).
We wanted to determine whether these disease progression-dependent changes in amyloid pathology observed in the cortex also occurred in other brain regions. We previously reported a significant reduction in amyloid pathology in the hippocampus of 4-month-old TREM2-deficient APPPS1 mice compared with controls (Jay et al., 2015), an early stage in pathology in that brain region. This led us to investigate whether amyloid plaque accumulation would be affected differentially at 8 months of age, a midpoint in disease progression in the hippocampus. We found no significant differences in 6E10-immunoreactive area in the hippocampus of 8-month-old APPPS1;Trem2−/− mice compared with controls (0.96 ± 0.17 vs 1.52 ± 0.29, t(11) = 1.6, p = 0.132). There was also a trend toward an increase in average plaque size in the hippocampus of TREM2-deficient mice compared with controls (29.42 ± 5.25 vs 62.71 ± 11.43, t(9) = 2.1, p = 0.066; summarized in Table 1). These results indicate that there is also a disease-progression-dependent effect of amyloid pathology in the hippocampus of APPPS1 mice, with reductions in amyloid pathology early, but no significant changes at a midpoint in disease progression.
To ensure that these differences in amyloid pathology were not due to differences in transgene expression, we assessed transcript (Fig. 1h) and protein levels (Fig. 1i,j) of human APP. Although there was a significant reduction in APP transcript levels in lysates from TREM2-deficient mice at 8 (WT 2.43 ± 0.19 vs KO 1.45 ± 0.25, t(9) = 3.1, p = 0.012), but not 2 months of age (WT 1.86 ± 0.20 vs KO 1.89 ± 0.15, t(10) = 1.1, p = 0.913), there were no significant alterations in APP protein levels at 2 (WT 1.00 ± 0.06 vs KO 0.89 ± 0.11, t(8) = 0.9, p = 0.374) or 8 months of age (WT 1.00 ± 0.16 vs KO 1.31 ± 0.20, t(8) = 1.2, p = 0.258), suggesting that changes in transgene expression do not drive the changes in pathology observed in this study.
Together, these data suggest a disease progression-dependent role for TREM2 on amyloid pathology. TREM2 deficiency initially results in reduced amyloid pathology, but leads to increased plaque area late in disease progression. These results are consistent with our previous findings, as well as those reported in TREM2-deficient mice using other AD mouse models (summarized in Table 1).
TREM2 deficiency decreases the number of CD45hi and plaque-associated myeloid cells
Because TREM2 deficiency had opposing effects on amyloid plaque accumulation early and late in disease progression, we assessed whether TREM2 deficiency might affect myeloid cell distribution and phenotype differentially at these two time points. First, we examined gene expression of myeloid cell markers in the cortex of 2- and 8-month-old APPPS1;Trem2+/+ and APPPS1;Trem2−/− mice to assess how TREM2 deficiency affects different myeloid cell subsets. There were no significant changes in expression of these myeloid cell markers in 2-month-old TREM2-deficient mice compared with controls (Fig. 2a; PU.1 WT 11.63 ± 0.17 vs KO 12.12 ± 0.42, t(10) = 1.1, p = 0.304; Tmem119 WT 9.80 ± 0.17 vs KO 9.93 ± 0.19, t(10) = 0.5, p = 0.626; CD45 WT 14.60 ± 0.32 vs KO 14.76 ± 0.32, t(10) = 0.3, p = 0.735). However, at 8 months of age, there were trends toward reductions in the expression of the myeloid cell transcription factor PU.1 (WT 10.42 ± 0.28 vs KO 11.14 ± 0.20, t(9) = 2.1, p = 0.060) (Scott et al., 1994) and the previously characterized microglia specific marker Tmem119 (WT 8.64 ± 0.09 vs KO 8.93 ± 0.09, t(9) = 2.1, p = 0.060) (Butovsky et al., 2014; Bennett et al., 2016) in TREM2-deficient mice (Fig. 2a). In addition, the myeloid cell marker CD45 was reduced significantly and substantially in TREM2-deficient mice at 8 months of age (Fig. 2a; WT 11.70 ± 0.09 vs 13.60 ± 0.24, t(9) = 5.7, p = 0.0003). Previous work showed that TREM2 in APPPS1 mice and other AD models was expressed exclusively on myeloid cells expressing high levels of CD45 throughout disease progression (Jay et al., 2015). Because of these previous findings, and the gene expression data in this study, we chose to distinguish myeloid cells subsets expressing high (CD45hi) and low (CD45lo) levels of this marker in subsequent studies examining TREM2 function.
Figure 2.

TREM2 deficiency reduces myeloid cell number. a, Analysis of myeloid cell markers by qPCR revealed no significant changes in expression of the myeloid cell markers PU.1, Tmem119, or CD45 in cortical lysates from 2-month-old APPPS1;Trem2−/− mice compared with APPPS1;Trem2+/+ controls (WT, n = 3 M/3 F; KO, n = 3 M/3 F). However, there was a trend toward reduction in expression levels of PU.1 and Tmem119 in 8-month-old TREM2-deficient mice and a significant reduction in CD45 expression (WT, n = 2 M/2 F; KO, n = 3 M/4 F). b–d, Immunohistochemistry for CD45 at 2 months of age (b; WT, n = 3 M/2 F; KO, n = 3 M/4 F) and 8 months of age (c; WT, n = 4M/2F; KO, n = 4M/2F) revealed a significant decrease in the density of cells expressing high levels of CD45 in the cortex of APPPS1;Trem2−/− mice compared with APPPS1;Trem2+/+ controls (d). ns, Not significant; **p < 0.01; ***p < 0.001.
It was unclear whether the changes in gene expression of myeloid cell markers reflected a change in the total number of cells within these myeloid cell populations or altered gene expression. To distinguish these two possibilities, the numbers of myeloid cells in the cortex of 2- and 8-month-old APPPS1;Trem2+/+ and APPPS1;Trem2−/− mice were quantified. There were no significant differences in the number of cells labeled with the pan-myeloid cell marker Iba1 in TREM2-deficient mice compared with controls (data not shown). However, quantification of the number of CD45hi cells revealed a significant reduction in this population in 2-month-old (WT 0.14 ± 0.01 vs KO 0.02 ± 0.005, t(9) = 16.2, p < 0.0001) and 8-month-old APPPS1;Trem2−/− mice compared with APPPS1;Trem2+/+ controls (Fig. 2b–d; WT 1.26 ± 0.11 vs 0.15 ± 0.03, t(10) = 10.2, p < 0.0001). Together, these data demonstrate that TREM2 deficiency affects brain myeloid cell number, especially at late stages in disease progression and specifically within the CD45hi myeloid cell subset in which TREM2 is known to be predominantly expressed.
It has been reported previously that TREM2 deficiency also affects accumulation of myeloid cells around plaques (Jay et al., 2015). We assessed whether TREM2 deficiency affected the accumulation of myeloid cells differentially at early and late stages in disease progression. Analysis of Iba1+ myeloid cell accumulation around 6E10+ plaques in 2-month-old (Fig. 3a,c; WT 3.76 ± 0.31 vs KO 1.75 ± 0.21, t(9) = 5.5, p = 0.0004) and 8-month-old (Fig. 3b,d; WT 9.39 ± 0.55 vs KO 4.39 ± 0.44, t(4) = 7.1, p = 0.002) TREM2-deficient mice revealed significant reductions in plaque-associated myeloid cells at both time points (Fig. 3e). Consistent with our findings that CD45hi cell number was decreased in TREM2-deficient mice, analysis of CD45 immunoreactivity around Congo Red+ plaques in 2-month-old (Fig. 3f; WT 15.40 ± 0.74 vs KO 3.85 ± 0.61, t(9) = 12.2, p < 0.0001) and 8-month-old (Fig. 3g; WT 28.39 ± 3.50 vs KO 6.05 ± 1.18, t(10) = 6.0, p = 0.0001) mice also revealed a significant reduction in accumulation of this myeloid cell subset around plaques in TREM2-deficient mice at both time points (Fig. 3h). Together, these results demonstrate reduced accumulation of CD45hi myeloid cells associated with plaques in TREM2-deficient mice at both early and late stages in disease progression.
Figure 3.
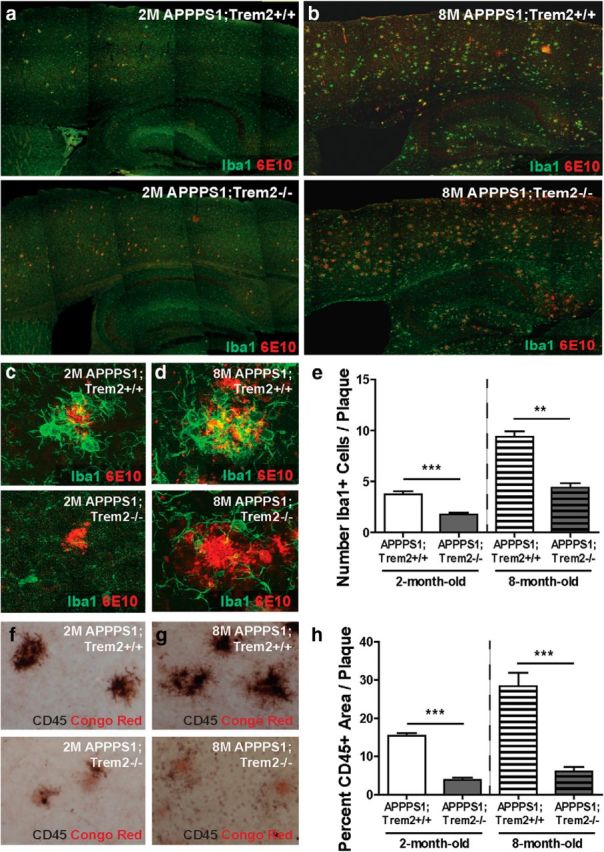
TREM2 deficiency reduces plaque-associated myeloid cells. a, b, Immunohistochemistry for Iba1 and 6E10 was performed to assess accumulation of myeloid cells around plaques in the cortex of 2-month-old (a) and 8-month-old (b) APPPS1;Trem2−/− and APPPS1;Trem2+/+ mice. c–e, Quantification of confocal images from 2-month-old (c) and 8-month-old mice (d) revealed significant reductions in the number of Iba1+ cells around plaques in TREM2-deficient mice at both 2 months of age (WT, n = 3 M/2 F; KO, n = 3 M/3 F) and 8 months of age (WT, n = 2 M/1 F; KO, n = 2 M/1 F; e). f–h, Quantification of CD45-immunoreactive area around Congo Red+ plaques in 2-month-old (f) and 8-month-old (g) APPPS1;Trem2+/+ and APPPS1;Trem2−/− mice revealed significant reductions in the CD45hi cell accumulation around plaques in TREM2-deficient mice at both 2 (WT, n = 3M/2F; KO, n = 3M/3F) and 8 (WT, n = 4M/2F; KO, n = 4M/2F) month time points (h). **p < 0.01; ***p < 0.001.
TREM2 deficiency reduces myeloid cell proliferation at late stages in disease progression
Due to the observed reduction in plaque-associated myeloid cells in TREM2-deficient mice throughout the time course of pathology, we wanted to assess whether TREM2 deficiency drove this reduction in plaque-associated cells through different mechanisms at early and late stages in disease progression. In other disease contexts, TREM2 has been shown to play an important role in myeloid cell proliferation (Otero et al., 2012; Cantoni et al., 2015; Poliani et al., 2015), which could contribute to a loss of plaque-associated myeloid cells.
We assessed whether TREM2 deficiency contributes to myeloid cell loss in AD mice by impairing myeloid cell proliferation. To examine proliferation, BrdU injections were administered every 24 h for 72 h before mice were killed and the number of BrdU+ Iba1+ myeloid cells were quantified in the cortex of APPPS1;Trem2−/− and APPPS1;Trem2+/+ mice at 2 months (Fig. 4a) and 8 months (Fig. 4b) of age. The numbers of proliferating cells were not altered significantly at 2 months of age (WT 16.50 ± 2.5 vs KO 12.00 ± 3.00, t(3) = 1.2, p = 0.368), but were reduced significantly in 8-month-old TREM2-deficient mice compared with controls (Fig. 4c; WT 74.80 ± 3.08 vs KO 33.06 ± 5.94, t(12) = 5.0, p = 0.003). An independent evaluation of proliferation was performed by examining Ki67+ Iba1+ cell numbers. Similar to our BrdU analysis, we found no change in proliferating cells per cortical section in 2-month-old APPPS1;Trem2+/+ and APPPS1;Trem2−/− mice (WT 44.20 ± 9.69 vs KO 37.83 ± 8.59, t(6) = 0.4, p = 0.673), but a significant reduction in TREM2-deficient mice compared with controls at 8 months of age (WT 17.38 ± 3.08 vs KO 6.10 ± 0.93, t(7) = 3.9, p = 0.006).
Figure 4.

TREM2 deficiency reduces myeloid cell proliferation late in disease progression. Mice were injected with 10 mg/kg BrdU intraperitoneally every 24 h for 72 h and killed 24 h after the last injection. a, b, BrdU immunohistochemistry was used to identify proliferating cells in 2-month-old (a) and 8-month-old (b) APPPS1;Trem2−/− and APPPS1;Trem2+/+ mice. c, Number of BrdU+ Iba1+ double-positive cells was quantified in the cortex of 2-month-old (WT, n = 1 M/2 F; KO, n = 1 M/1 F) and 8-month old (WT, n = 3 M/1 F; KO, n = 5 M/3 F) APPPS1;Trem2−/− and APPPS1;Trem2+/+ mice. There were no significant differences in the numbers of proliferating myeloid cells in 2-month-old TREM2-deficient mice, but there were significant decreases in 8-month-old APPPS1;Trem2−/− mice compared with APPPS1;Trem2+/+ controls. d, Brain myeloid cells were isolated from 6- to 9-month-old APPPS1 mice and cells were analyzed by flow cytometry. e, Cells were gated on CD11b and divided into CD45lo and CD45hi cells. f, When the percentage of BrdU+ cells was quantified within that CD45hi population, there were very few proliferating cells (0.43%). g, However, there was a substantial population (7.53%) of proliferating CD45lo cells. ***p < 0.001.
Because TREM2 deficiency specifically decreased the number of CD45hi myeloid cells in APPPS1 mice, we wanted to determine whether proliferation was affected preferentially in this myeloid cell subset. To assess this possibility, 6- to 9-month-old APPPS1;Trem2+/+ mice were administered BrdU as described above and brain myeloid cells were isolated and analyzed using flow cytometry. The cells were gated on CD11b (Fig. 4d) to select the total myeloid cell population and then divided into CD45lo and CD45hi populations (Fig. 4e). Quantification of the percentage of BrdU+ cells within the CD45hi cell population revealed few proliferating cells (0.43%; Fig. 4f). Rather, BrdU+ cells were primarily identified within the CD45lo microglial population (7.94%; Fig. 4g). These findings are consistent with the interpretation that TREM2 deficiency affects CD45hi myeloid cell numbers throughout disease progression, but has a specific impact on CD45lo myeloid cells late in disease pathology. This reduction in CD45lo myeloid cell proliferation is likely a contributing factor to the loss of plaque-associated myeloid cells selectively at this late time point and suggests that TREM2 alters myeloid cell number early and late in disease progression through different mechanisms. It remains to be determined whether this is due to targeting of distinct myeloid cell subsets at different stages in pathology or if TREM2 or myeloid cell function across myeloid cell subsets might change throughout disease progression.
TREM2 deficiency reduces amyloid internalization, astrocytosis, and inflammatory gene expression
Our findings indicate that TREM2 is important for the proliferation of myeloid cells late in disease progression, leading to a loss of plaque-associated myeloid cells in TREM2-deficient mice. We next assessed whether TREM2 deficiency and loss of these cells would affect myeloid cell functions known to be important modifiers of AD-related pathologies, including myeloid cell internalization of amyloid, astrocytosis, and inflammation. Because TREM2 has been shown to play an important role in phagocytosis in other contexts (Takahashi et al., 2005; Hsieh et al., 2009; Kawabori et al., 2015), we assessed whether TREM2 deficiency affected myeloid cell internalization of amyloid plaques. Plaques and plaque-associated myeloid cells were reconstructed from confocal stacks and the volume of 6E10 and Iba1 colocalization was quantified as a measure of 6E10 internalization within myeloid cells. This area was normalized to the total plaque volume. At both 2 months of age (Fig. 5a; WT 14.09 ± 2.31 vs KO 4.03 ± 1.00, t(4) = 4.0, p = 0.016) and 8 months of age (Fig. 5b; WT 12.36 ± 2.64 vs KO 2.75 ± 0.41, t(4) = 3.6, p = 0.022), TREM2 deficiency resulted in significantly reduced internalization of 6E10 within myeloid cells (Fig. 5c).
Figure 5.
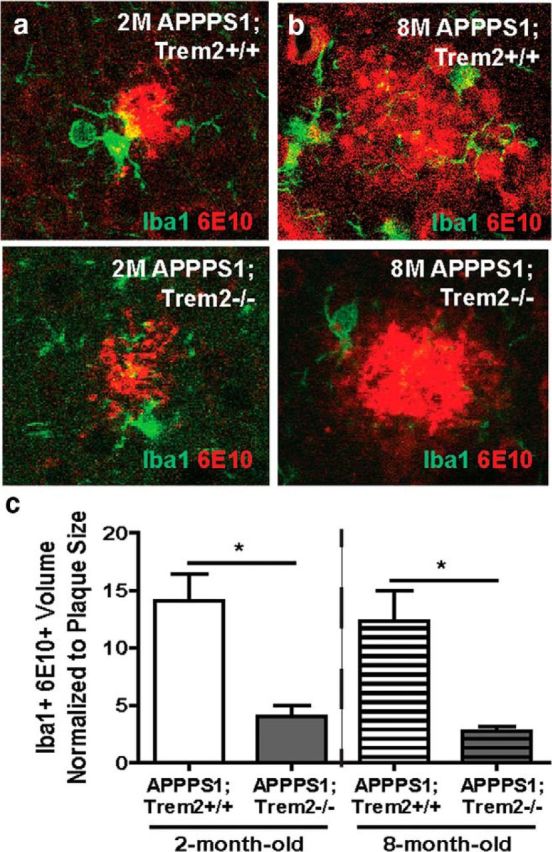
TREM2 deficiency reduces amyloid internalization within myeloid cells. a, b, Confocal slices through amyloid plaques were acquired 1 μm apart for up to 30 slices in 2-month-old (a) and 8-month-old (b) APPPS1;Trem2−/− and APPPS1;Trem2+/+ mice. The total volume of colocalization between Iba1 and 6E10 was measured and normalized to plaque volume. c, This normalized volume was reduced significantly in TREM2-deficient mice at 2 months of age (WT, n = 2 M/1 F; KO, n = 2 M/1 F) and 8 months of age (WT, n = 1 M/2 F; KO, n = 3M). *p < 0.05.
Because amyloid internalization was affected both early and late in pathology, changes in this myeloid cell function could not explain the differential effects of TREM2 deficiency with regard to amyloid accumulation early and late in disease progression. Therefore, we examined whether TREM2 deficiency might affect astrocyte activation and accumulation indirectly around plaques differentially at these two time points. The total immunoreactive area of the astrocyte marker GFAP around 6E10+ plaques at 2 months of age (Fig. 6a; WT 5.43 ± 1.15 vs KO 0.72 ± 0.24, t(9) = 4.4, p = 0.002) and 8 months of age (Fig. 6b; WT 26.74 ± 2.30 vs KO 18.60 ± 2.30, t(10) = 2.6, p = 0.027) was reduced significantly (Fig. 6c) in TREM2-deficient mice. S100β expression has been used in other disease contexts to distinguish whether changes in GFAP expression reflect altered astrocyte activation or are due to a change in the distribution of astrocytes (Kang et al., 2014). To assess whether the changes in GFAP expression observed here were due to a reduction in plaque-proximal astrocytes, expression of the pan-astrocyte marker S100β was also examined in 2-month-old (Fig. 6d; WT 5.83 ± 0.30 vs KO 6.43 ± 0.29, t(9) = 1.4, p = 0.185) and 8-month-old (Fig. 6e; WT 10.47 ± 0.76 vs KO 11.22 ± 0.71, t(9) = 0.7, p = 0.498) TREM2-deficient mice. There were no significant changes in S100β immunoreactive area at either time point (Fig. 6f), suggesting that TREM2 deficiency likely affects the activation of astrocytes rather than astrocyte distribution in the brains of AD mice.
Figure 6.
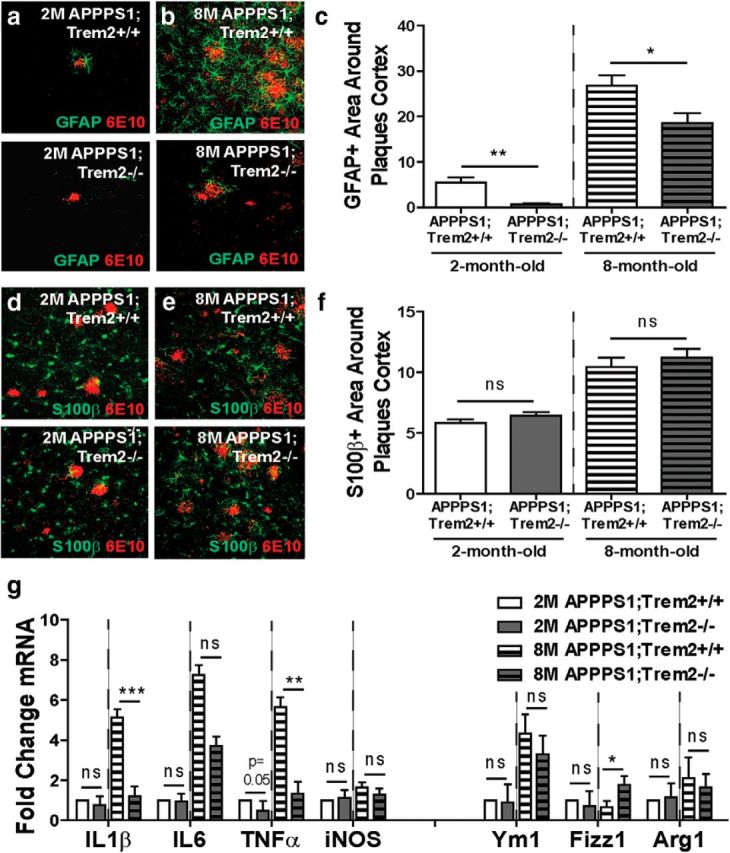
TREM2 deficiency reduces astrocytosis and inflammation. a, b, Immunohistochemistry for GFAP and 6E10 was performed to assess astrocytosis in 2-month-old (a) and 8-month-old (b) APPPS1;Trem2−/− and APPPS1;Trem2+/+ mice. c, Quantification of the GFAP-immunoreactive area around plaques revealed significant reductions in TREM2-deficient mice at 2 months of age (WT, n = 3 M/2 F; KO, n = 3 M/3 F) and 8 months of age (WT, n = 4 M/2 F; KO, n = 4 M/3 F). d–f, S100β-immunoreactive area around 6E10+ plaques was also examined at 2 months of age (d) and 8 months of age (e) and revealed no significant differences between genotypes at either time point (f; 2 M WT, n = 3 M/ 2F; 2 M KO, n = 3 M/3 F; 8 M WT, n = 4 M/2 F; 8 M KO, n = 3 M/2 F). g, Expression of inflammation-related transcripts was quantified using qPCR. There were no significant changes in expression of these genes in TREM2-deficient mice at 2 months of age (WT, n = 3 M/3 F; KO, n = 3 M/3 F). However, there was a significant reduction in the pro-inflammatory genes IL1β and TNFα and a significant increase in the anti-inflammatory marker Fizz1 in TREM2-deficient mice at 8 months of age (WT, n = 2 M/2 F; KO, n = 3 M/4 F). *p < 0.05; **p < 0.01; ***p < 0.001.
Finally, we assessed whether these changes in myeloid cell accumulation and astrocytosis resulted in reduced expression of inflammation-related genes. There were no significant changes in expression levels of several pro-inflammatory or anti-inflammatory genes in 2-month-old APPPS1;Trem2−/− mice compared with APPPS1;Trem2+/+ controls (Fig. 6g; IL1β WT 14.31 ± 0.47 vs KO 15.11 ± 0.39, t(10) = 1.3, p = 0.215; IL6 WT 15.52 ± 0.37 vs KO 15.35 ± 0.50, t(10) = 0.3, p = 0.781; iNOS WT 14.19 ± 0.23 vs KO 14.29 ± 0.16, t(10) = 0.3, p = 0.751; Ym1 WT 15.20 ± 0.70 vs KO 15.37 ± 0.41, t(10) = 0.2, p = 0.841; Fizz1 WT 14.80 ± 0.29 vs KO 14.95 ± 0.68, t(10) = 0.2, p = 0.847; Arg1 WT 15.26 ± 0.66 vs KO 15.05 ± 0.23, t(10) = 0.3, p = 0.767). However, there was a significant reduction in the inflammatory genes IL1β (WT 14.43 ± 0.29 vs KO 16.17 ± 0.19, t(9) = 5.2, p = 0.0005) and TNFα (WT 13.07 ± 0.30 vs KO 15.14 ± 0.40, t(9) = 3.6, p = 0.006) and a significant increase in the IL4/IL13 response marker Fizz1 (WT 16.41 ± 0.14 vs KO 14.99 ± 0.35, t(9) = 2.9, p = 0.016) in TREM2-deficient mice at 8 months of age, but no significant changes in other genes examined (IL6 WT 16.18 ± 0.24 vs KO 16.39 ± 0.20, t(9) = 0.7, p = 0.527; iNOS WT 14.87 ± 0.09 vs KO 15.31 ± 0.22, t(9) = 0.6, p = 0.180; Ym1 WT 14.42 ± 0.45 vs KO 14.82 ± 0.40, t(9) = 0.6, p = 0.545; Arg1 WT 15.62 ± 0.57 vs KO 15.55 ± 0.16, t(8) = 0.1, p = 0.894). Although myeloid cell accumulation and astrocytosis were reduced at both the 2- and 8-month time points, we observed an overall reduction in inflammation-related transcript levels selectively in 8-month-old TREM2-deficient mice. This selective decrease in inflammation could contribute to the differential impact of TREM2 deficiency on pathology at early and late stages in disease progression, but additional studies will be required to determine the full array of changes in myeloid cell functions that contribute to these effects.
Discussion
We report that TREM2 deficiency has a disease-progression-dependent effect on amyloid pathology and on AD-related myeloid cell functions. We found that loss of TREM2 results in a reduction in plaque number and area early in disease progression, but increased plaque size and area late in pathology. TREM2 deficiency decreased accumulation of myeloid cells around plaques and total numbers of CD45hi myeloid cells. Reduced cell proliferation contributed to these changes, specifically at late stages of pathology. TREM2 deficiency also reduced myeloid cell internalization of amyloid, resulting in reduced astrocytosis at all time points examined. We found that mice lacking TREM2 exhibited selectively reduced inflammatory gene expression at late stages of pathology.
Our findings demonstrate that TREM2 deficiency has opposing effects on plaque burden as a function of disease progression. This unifies the seemingly contradictory findings in the current literature. Our previous work evaluated changes in amyloid pathology in 4-month-old APPPS1 TREM2-deficient mice and reported no changes in the cortex, but significant reductions in the hippocampus, which is at an early stage of pathology development at that time point (Jay et al., 2015). However, others have reported no changes in amyloid pathology in the hippocampus of TREM2-deficient 5XFAD mice at 4 months of age, a midpoint in disease progression in the 5XFAD model (Wang et al., 2016), and a significant increase in pathology in the hippocampus of TREM2-deficient 8.5-month-old 5XFAD mice (Wang et al., 2015). These opposing effects of TREM2 deficiency on amyloid pathology raised concerns about possible differences between AD models or TREM2 knock-out lines. However, our results here support that these opposing results may instead reflect a disease-progression-dependent impact of TREM2 deficiency on amyloid pathology. The possibility that TREM2 plays a time-dependent role in disease progression has also been supported by other work examining the effects of TREM2 overexpression in AD mice. Jiang et al. (2014) reported alterations in amyloid pathology in AD mice in which TREM2 was overexpressed at early stages in disease progression, but more recently showed that overexpression of TREM2 at later stages in pathology did not alter amyloid accumulation significantly (Jiang et al., 2016). The disease-stage-dependent role of TREM2 on AD pathology presented here reconciles these previous findings and, together with other work in the field, suggests that TREM2 deficiency reduces amyloid pathology early, but increases it late in disease progression.
Although our findings are consistent with the known data from human TREM2 variant carriers, as well as those using other strategies to alter TREM2 expression in AD mouse models, we have not demonstrated definitively whether this TREM2 deletion model affects the expression of other gene transcripts in this locus. The TREM2 locus also contains several immune-related genes, including some implicated in altering AD risk and pathology, such as TREM1 (Replogle et al., 2015) and TREML2 (Benitez et al., 2014), and it is possible that expression of these or other transcripts could be affected by deletion of unrecognized regulatory sequences in our model for TREM2 deficiency. To exclude this possibility and to more closely model changes in TREM2 function that occur in human AD, it will be important to make mouse models expressing human TREM2 variants, including those known to promote loss of protein function such as Q33X, to validate findings from the TREM2 KO models reported so far and those that may not confer a full loss of function phenotype such as R47H (Kleinberger et al., 2014). These models could provide insight into whether TREM2 deficiency fully models the effect of human AD risk variants.
In this study, we demonstrate that TREM2 deficiency affects some aspects of myeloid cell function in a consistent manner throughout disease progression, including myeloid cell accumulation around plaques, phagocytosis, and induction of astrocytosis. For that reason, differential effects of TREM2 deficiency on these myeloid cell functions cannot explain the differential effects on amyloid pathology at early and late time points. However, it remains possible that alterations in myeloid cell distribution and phenotype could have opposing impacts on amyloid accumulation at different stages of pathology. Heneka et al. (2015) suggested that myeloid cell activation could play divergent roles early and late in disease progression, which they proposed could underlie different results from clinical trials examining use of immune-targeted therapeutics such as NSAIDs and Aβ immunotherapy at different stages in disease progression. If this is the case, then understanding how immune-related functions regulate pathology differentially at early and late stages of AD will be crucial to deciphering the biology of inflammation in the process of neurodegeneration and designing effective inflammation-targeted therapeutics. Studying how similar effects of TREM2 deficiency early and late in disease progression result in opposing pathological outcomes could provide a platform to study how common myeloid cell functions might play different roles throughout AD progression.
In addition to these consistent effects on myeloid cell function throughout progression, TREM2 deficiency does exhibit stage-specific effects on myeloid cell function. Specifically, alterations in inflammatory gene expression were altered selectively late in pathology. Several recent studies have demonstrated that reduced inflammation can exacerbate amyloid pathology (Guillot-Sestier et al.; Chakrabarty et al., 2015). Therefore, it is possible that reduced inflammation in TREM2-deficient mice late in disease progression leads to the increases in amyloid accumulation observed at that time point. In this study, we examined a small subset of the possible inflammation-related pathways altered by TREM2 deficiency. Future studies will be required to examine more broadly which pathways are altered in TREM2-deficient mice and to define how changes in these pathways contribute to amyloid pathology.
TREM2 deficiency also reduced proliferation selectively at late stages in AD pathology. Interestingly, we found that proliferation occurred specifically within CD45lo myeloid cells. However, we reported previously that TREM2 is expressed predominantly on CD45hi macrophages in the AD brain throughout the progression of pathology (Jay et al., 2015). Our previous work based on marker expression and our unpublished findings using bone marrow chimeras are consistent with the identification of these cells as macrophages derived from peripheral monocytes. Therefore, one possible explanation for the stage-dependent role of TREM2 deficiency on amyloid pathology is that TREM2 deficiency affects different myeloid cell subsets at different stages of pathology. TREM2 deficiency first affects CD45hi myeloid cells, where it is primarily expressed, but later loss of these CD45hi cells also affects the function of the CD45lo myeloid cells, reducing their proliferation and potentially altering other AD-related phenotypes. If these subsets are indeed reflective of different cell origins, then these data suggest that opposing impacts of TREM2 on resident microglia and peripherally derived macrophages could underlie its changing role throughout disease progression. Moving forward, it will be important to use conditional TREM2 knock-out models to examine definitively the effects of TREM2 deficiency in specific myeloid cell populations throughout disease progression.
We propose that TREM2 deficiency first results in loss of CD45hi myeloid cells from the AD brain. These cells may normally play an important role in altering the local brain microenvironment in AD, inducing a local inflammatory response in cells surrounding amyloid plaques. Loss of these CD45hi myeloid cells results in reduced activation of plaque-associated astrocytes and, later in disease progression, decreased activation and proliferation of CD45lo microglia. The reduction in CD45hi myeloid cells mediated by TREM2 deficiency initially results in decreased amyloid pathology through mechanisms that are not yet understood. However, later in disease progression, when CD45lo myeloid cell function is also affected, reduced amyloid internalization and decreased inflammatory gene transcription likely contribute to increased plaque size and an overall increase in amyloid accumulation.
Since the identification of TREM2 variants as risk factors for AD, there has been substantial interest in TREM2 as a potential inflammation-related therapeutic target. Recognizing the dual role for TREM2 function early and late in disease progression provides important insights into the underlying biology of TREM2 in AD and suggests new considerations in the development of TREM2-directed therapeutics. This study suggests that trials using TREM2-directed therapies will have to consider carefully the disease stage being targeted. The time point in progression at which these therapeutics are delivered could critically affect clinical outcomes. These findings also suggest that disease progression might be an important factor to consider in the use of inflammation- or immune-cell-targeted therapeutics in general in the context of AD.
Footnotes
This work was supported by the Alzheimer's Association (Grant BFG-15–364590 to G.E.L.), the Jane and Lee Seidman Fund, generous donations from Chet and Jane Scholtz and Dave and Susan Roberts (B.T.L.), the National Institute on Aging–National Institutes of Health (NIA Grant RF1 AG051495 to B.T.L. and G.E.L.; NIA Grant R01 AG050597 to G.E.L.; and NIA National Research Service Award F31 AG048704 to T.R.J.), and Case Western Reserve University (Neurosciences Training Grant T32 NS067431 to T.R.J.). We thank the imaging core at Case Western Reserve University and the flow cytometry core at the Cleveland Clinic Lerner Research Institute for technical support.
The authors declare no competing financial interests.
References
- Benitez BA, et al. Missense variant in TREML2 protects against Alzheimer's disease. Neurobiol Aging. 2014;35:1510e19–26. doi: 10.1016/j.neurobiolaging.2013.12.010. [DOI] [PMC free article] [PubMed] [Google Scholar]
- Bennett ML, Bennett FC, Liddelow SA, Ajami B, Zamanian JL, Fernhoff NB, Mulinyawe SB, Bohlen CJ, Adil A, Tucker A, Weissman IL, Chang EF, Li G, Grant GA, Hayden Gephart MG, Barres BA. New tools for studying microglia in the mouse and human CNS. Proc Natl Acad Sci U S A. 2016;113:E1738–E1746. doi: 10.1073/pnas.1525528113. [DOI] [PMC free article] [PubMed] [Google Scholar]
- Butovsky O, Jedrychowski MP, Moore CS, Cialic R, Lanser AJ, Gabriely G, Koeglsperger T, Dake B, Wu PM, Doykan CE, Fanek Z, Liu L, Chen Z, Rothstein JD, Ransohoff RM, Gygi SP, Antel JP, Weiner HL. Identification of a unique TGF-β dependent molecular and functional signature in microglia. Nat Neurosci. 2014;17:131–143. doi: 10.1038/nn.3599. [DOI] [PMC free article] [PubMed] [Google Scholar]
- Cantoni C, Bollman B, Licastro D, Xie M, Mikesell R, Schmidt R, Yuede CM, Galimberti D, Olivecrona G, Klein RS, Cross AH, Otero K, Piccio L. TREM2 regulates microglial cell activation in response to demyelination in vivo. Acta Neuropathol. 2015;129:429–447. doi: 10.1007/s00401-015-1388-1. [DOI] [PMC free article] [PubMed] [Google Scholar]
- Chakrabarty P, Li A, Ceballos-Diaz C, Eddy JA, Funk CC, Moore B, DiNunno N, Rosario AM, Cruz PE, Verbeeck C, Sacino A, Nix S, Janus C, Price ND, Das P, Golde TE. IL-10 alters immunoproteostasis in APP mice, increasing plaque burden and worsening cognitive behavior. Neuron. 2015;85:519–533. doi: 10.1016/j.neuron.2014.11.020. [DOI] [PMC free article] [PubMed] [Google Scholar]
- Colonna M. TREMs in the immune system and beyond. Nat Rev Immunol. 2003;3:445–453. doi: 10.1038/nri1106. [DOI] [PubMed] [Google Scholar]
- El Khoury J, Toft M, Hickman SE, Means TK, Terada K, Geula C, Luster AD. Ccr2 deficiency impairs microglial accumulation and accelerates progression of Alzheimer-like disease. Nat Med. 2007;13:432–438. doi: 10.1038/nm1555. [DOI] [PubMed] [Google Scholar]
- Frank S, Burbach GJ, Bonin M, Walter M, Streit W, Bechmann I, Deller T. TREM2 is upregulated in amyloid plaque-associated microglia in aged APP23 transgenic mice. Glia. 2008;56:1438–1447. doi: 10.1002/glia.20710. [DOI] [PubMed] [Google Scholar]
- Gate D, Rezai-Zadeh K, Jodry D, Rentsendorj A, Town T. Macrophages in Alzheimer's disease: the blood-borne identity. J Neural Transm. 2010;117:961–970. doi: 10.1007/s00702-010-0422-7. [DOI] [PMC free article] [PubMed] [Google Scholar]
- Guerreiro R, et al. TREM2 variants in Alzheimer's disease. N Engl J Med. 2013;368:117–127. doi: 10.1056/NEJMoa1211851. [DOI] [PMC free article] [PubMed] [Google Scholar]
- Guillot-Sestier MV, Doty KR, Gate D, Rodriguez J, Jr, Leung BP, Rezai-Zadeh K, Town T. Deficiency rebalances innate immunity to mitigate Alzheimer-like pathology. Neuron. 2015;85:534–548. doi: 10.1016/j.neuron.2014.12.068. [DOI] [PMC free article] [PubMed] [Google Scholar]
- Heneka MT, et al. Neuroinflammation in Alzheimer's disease. Lancet Neurol. 2015;14:388–405. doi: 10.1016/S1474-4422(15)70016-5. [DOI] [PMC free article] [PubMed] [Google Scholar]
- Hsieh CL, Koike M, Spusta SC, Niemi EC, Yenari M, Nakamura MC, Seaman WE. A role for TREM2 ligands in the phagocytosis of apoptotic neuronal cells by microglia. J Neurochem. 2009;109:1144–1156. doi: 10.1111/j.1471-4159.2009.06042.x. [DOI] [PMC free article] [PubMed] [Google Scholar]
- Itagaki S, McGeer PL, Akiyama H, Zhu S, Selkoe D. Relationship of microglia and astrocytes to amyloid deposits of Alzheimer disease. J Neuroimmunol. 1989;24:173–182. doi: 10.1016/0165-5728(89)90115-X. [DOI] [PubMed] [Google Scholar]
- Jay TR, et al. TREM2 deficiency eliminates TREM2+ inflammatory macrophages and ameliorates pathology in Alzheimer's disease mouse models. J Exp Med. 2015;212:287–295. doi: 10.1084/jem.20142322. [DOI] [PMC free article] [PubMed] [Google Scholar]
- Jiang T, Wan Y, Zhang YD, Zhou JS, Gao Q, Zhu XC, Shi JQ, Lu H, Tan L, Yu JT. TREM2 overexpression has no improvement on neuropathology and cognitive impairment in aging APPswe/PS1dE9 mice. Mol Neurobiol. 2016 doi: 10.1007/s12035-016-9704-x. In press. [DOI] [PubMed] [Google Scholar]
- Jonsson T, et al. Variant of TREM2 associated with the risk of Alzheimer's disease. N Engl J Med. 2013;368:107–116. doi: 10.1056/NEJMoa1211103. [DOI] [PMC free article] [PubMed] [Google Scholar]
- Kang W, Balordi F, Su N, Chen L, Fishell G, Hébert JM. Astrocyte activation is suppressed in both normal and injured brain by FGF signaling. Proc Natl Acad Sci U S A. 2014;111:E2987–E2995. doi: 10.1073/pnas.1320401111. [DOI] [PMC free article] [PubMed] [Google Scholar]
- Karch CM, Goate AM. Alzheimer's disease risk genes and mechanisms of disease pathogenesis. Biol Psychiatry. 2015;77:43–51. doi: 10.1016/j.biopsych.2014.05.006. [DOI] [PMC free article] [PubMed] [Google Scholar]
- Kawabori M, Kacimi R, Kauppinen T, Calosing C, Kim JY, Hsieh CL, Nakamura MC, Yenari MA. Triggering Receptor Expressed on Myeloid Cells 2 (TREM2) Deficiency Attenuates Phagocytic Activities of Microglia and Exacerbates Ischemic Damage in Experimental Stroke. J Neurosci. 2015;35:3384–3396. doi: 10.1523/JNEUROSCI.2620-14.2015. [DOI] [PMC free article] [PubMed] [Google Scholar]
- Kleinberger G, et al. TREM2 mutations implicated in neurodegeneration impair cell surface transport and phagocytosis. Sci Transl Med. 2014;6:243ra286. doi: 10.1126/scitranslmed.3009093. [DOI] [PubMed] [Google Scholar]
- Koronyo Y, Salumbides BC, Sheyn J, Pelissier L, Li S, Ljubimov V, Moyseyev M, Daley D, Fuchs DT, Pham M, Black KL, Rentsendorj A, Koronyo-Hamaoui M. Therapeutic effects of glatiramer acetate and grafted CD115(+) monocytes in a mouse model of Alzheimer's disease. Brain. 2015;138:2399–2422. doi: 10.1093/brain/awv150. [DOI] [PMC free article] [PubMed] [Google Scholar]
- Lill CM, et al. The role of TREM2 R47H as a risk factor for Alzheimer's disease, frontotemporal lobar degeneration, amyotrophic lateral sclerosis, and Parkinson's disease. Alzheimers Dement. 2015;11:1407–1416. doi: 10.1016/j.jalz.2014.12.009. [DOI] [PMC free article] [PubMed] [Google Scholar]
- McGeer PL, Itagaki S, Tago H, McGeer EG. Reactive microglia in patients with senile dementia of the Alzheimer type are positive for the histocompatibility glycoprotein HLA-DR. Neurosci Lett. 1987;79:195–200. doi: 10.1016/0304-3940(87)90696-3. [DOI] [PubMed] [Google Scholar]
- Melchior B, Garcia AE, Hsiung BK, Lo KM, Doose JM, Thrash JC, Stalder AK, Staufenbiel M, Neumann H, Carson MJ. Dual induction of TREM2 and tolerance-related transcript, Tmem176b, in amyloid transgenic mice: implications for vaccine-based therapies for Alzheimer's disease. ASN Neuro. 2010;2:e00037. doi: 10.1042/AN20100010. [DOI] [PMC free article] [PubMed] [Google Scholar]
- Montalvo V, Quigley L, Vistica BP, Boelte KC, Nugent LF, Takai T, McVicar DW, Gery I. Environmental factors determine DAP12 deficiency to either enhance or suppress immunopathogenic processes. Immunology. 2013;140:475–482. doi: 10.1111/imm.12158. [DOI] [PMC free article] [PubMed] [Google Scholar]
- Otero K, Shinohara M, Zhao H, Cella M, Gilfillan S, Colucci A, Faccio R, Ross FP, Teitelbaum SL, Takayanagi H, Colonna M. TREM2 and beta-catenin regulate bone homeostasis by controlling the rate of osteoclastogenesis. J Immunol. 2012;188:2612–2621. doi: 10.4049/jimmunol.1102836. [DOI] [PMC free article] [PubMed] [Google Scholar]
- Poliani PL, Wang Y, Fontana E, Robinette ML, Yamanishi Y, Gilfillan S, Colonna M. TREM2 sustains microglial expansion during aging and response to demyelination. J Clin Invest. 2015;125:2161–2170. doi: 10.1172/JCI77983. [DOI] [PMC free article] [PubMed] [Google Scholar]
- Radde R, Bolmont T, Kaeser SA, Coomaraswamy J, Lindau D, Stoltze L, Calhoun ME, Jäggi F, Wolburg H, Gengler S, Haass C, Ghetti B, Czech C, Hölscher C, Mathews PM, Jucker M. Abeta42-driven cerebral amyloidosis in transgenic mice reveals early and robust pathology. EMBO Rep. 2006;7:940–946. doi: 10.1038/sj.embor.7400784. [DOI] [PMC free article] [PubMed] [Google Scholar]
- Replogle RA, Chan G, White CC, Raj T, Winn PA, Evans DA, Sperling RA, Chibnik LB, Bradshaw EM, Schneider JA, Bennett DA, De Jager PL. A TREM1 variant alters the accumulation of Alzheimer-related amyloid pathology. Ann Neurol. 2015;77:469–477. doi: 10.1002/ana.24337. [DOI] [PMC free article] [PubMed] [Google Scholar]
- Schmid CD, Sautkulis LN, Danielson PE, Cooper J, Hasel KW, Hilbush BS, Sutcliffe JG, Carson MJ. Heterogeneous expression of the triggering receptor expressed on myeloid cells-2 on adult murine microglia. J Neurochem. 2002;83:1309–1320. doi: 10.1046/j.1471-4159.2002.01243.x. [DOI] [PMC free article] [PubMed] [Google Scholar]
- Scott E, Simon MC, Anastasi J, Singh H. Requirement of transcription factor PU.1 in the development of multiple hematopoietic lineages. Science. 1994;265:1573–1577. doi: 10.1126/science.8079170. [DOI] [PubMed] [Google Scholar]
- Takahashi K, Rochford CD, Neumann H. Clearance of apoptotic neurons without inflammation by microglial triggering receptor expressed on myeloid cells-2. J Exp Med. 2005;201:647–657. doi: 10.1084/jem.20041611. [DOI] [PMC free article] [PubMed] [Google Scholar]
- Tanzi RE. TREM2 and Risk of Alzheimer's Disease— Friend or Foe? N Engl J Med. 2015;372:2564–2565. doi: 10.1056/NEJMcibr1503954. [DOI] [PubMed] [Google Scholar]
- Ulrich JD, Finn MB, Wang Y, Shen A, Mahan TE, Jiang H, Stewart FR, Piccio L, Colonna M, Holtzman DM. Altered microglial response to Aβ plaques in APPPS1–21 mice heterozygous for TREM2. Mol Neurodegener. 2014;9:20–20. doi: 10.1186/1750-1326-9-20. [DOI] [PMC free article] [PubMed] [Google Scholar]
- Wang Y, Cella M, Mallinson K, Ulrich JD, Young KL, Robinette ML, Gilfillan S, Krishnan GM, Sudhakar S, Zinselmeyer BH, Holtzman DM, Cirrito JR, Colonna M. TREM2 lipid sensing sustains the microglial response in an Alzheimer's disease model. Cell. 2015;160:1061–1071. doi: 10.1016/j.cell.2015.01.049. [DOI] [PMC free article] [PubMed] [Google Scholar]
- Wang Y, Ulland TK, Ulrich JD, Song W, Tzaferis JA, Hole JT, Yuan P, Mahan TE, Shi Y, Gilfillan S, Cella M, Grutzendler J, DeMattos RB, Cirrito JR, Holtzman DM, Colonna M. TREM2-mediated early microglial response limits diffusion and toxicity of amyloid plaques. J Exp Med. 2016;213:667–675. doi: 10.1084/jem.20151948. [DOI] [PMC free article] [PubMed] [Google Scholar]
- Yuan P, Condello C, Keene CD, Wang Y, Bird TD, Paul SM, Luo W, Colonna M, Baddeley D, Grutzendler J. TREM2 haploinsufficiency in mice and humans impairs the microglia barrier function leading to decreased amyloid compaction and severe axonal dystrophy. Neuron. 2016;90:724–739. doi: 10.1016/j.neuron.2016.05.003. [DOI] [PMC free article] [PubMed] [Google Scholar]