
Figure 4. Genomic dissection of astrocytes and non-astrocyte cells in SCI lesions.
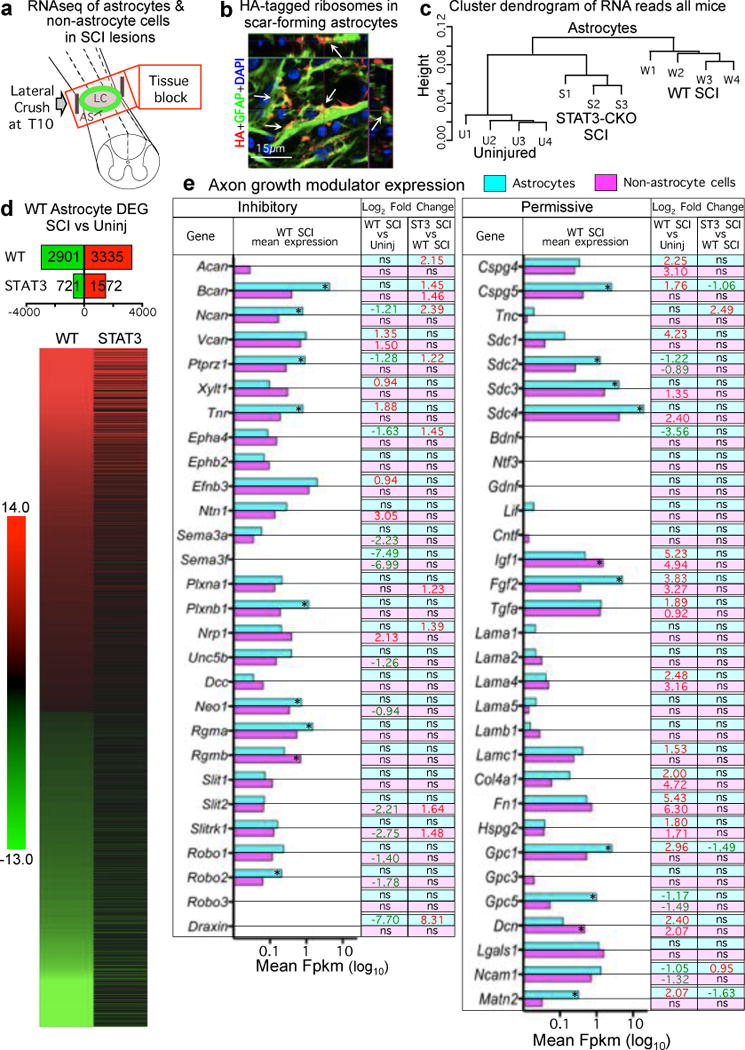
(a) Schematic of tissue harvested for RNA-sequencing. (b) Transgenically-targeted HA-tagged ribosome clusters (arrows) among GFAP filaments in scar-forming astrocytes (see Extended Data Fig. 3a). (c) Unsupervised hierarchical clustering dendrogram based on Pearson correlations shows that transcriptome profiles of STAT3-CKO SCI astrocytes cluster nearer to (and are more similar to) those of uninjured as compared to WT SCI astrocytes. (d) Numbers and heat map of significantly differentially expressed genes (DEGs) in WT astrocytes after SCI and the comparative differential expression profile of that specific cohort of genes in STAT3-CKO SCI astrocytes. Differential expression relative to uninjured, FDR<0.1. (e) Histogram of astrocyte and non-astrocyte expression of axon inhibitory or permissive molecules after SCI shown as mean FPKM. * significant difference astrocytes versus non-astrocytes, FDR<0.1. Numbers show Log2 fold significant differences. Red upregulated, green downregulated, ns non-significant.