

Summary
The cell fate decision between interferon-producing plasmacytoid DC (pDC) and antigen-presenting classical DC (cDC) is controlled by the E protein transcription factor TCF4 (E2-2). We report that TCF4 comprises two transcriptional isoforms, both of which are required for optimal pDC development in vitro. The long Tcf4 isoform is expressed specifically in pDCs, and its deletion in mice impaired pDCs development and led to the expansion of non-canonical CD8+ cDCs. The expression of Tcf4 commenced in progenitors and was further upregulated in pDCs, correlating with stage-specific activity of multiple enhancer elements. A conserved enhancer downstream of Tcf4 was required for its upregulation during pDC differentiation, revealing a positive feedback loop. The expression of Tcf4 and the resulting pDC differentiation were selectively sensitive to the inhibition of enhancer-binding BET protein activity. Thus, lineage-specifying function of E proteins is facilitated by lineage-specific isoform expression and by BET-dependent feedback regulation through distal regulatory elements.
e-TOC blurb
The development of plasmacytoid dendritic cells is driven by E protein transcription factor TCF4 (E2-2). Grajkowska et al. show that TCF4 itself is controlled by multiple mechanisms including isoform-specific expression and positive feedback regulation through distal regulatory elements.
Introduction
E proteins are basic helix-loop-helix (bHLH) transcription factors that are orthologous to the Daughterless protein in Drosophila, and in vertebrates include 3 proteins: TCF3 (E2a), TCF4 (E2-2) and TCF12 (HEB) (Kee, 2009; Murre, 2005). E proteins bind their cognate DNA sequence termed “E box” (CANNTG) as homo- or heterodimers, and can either activate or repress their target genes. DNA binding by E proteins is antagonized by the Inhibitor of differentiation (Id) proteins that sequester E proteins into non-functional heterodimers. The net balance between E and Id proteins determines several key cell fate choices in the immune system (Rothenberg, 2014), such as B cell versus natural killer (NK) cell specification (Boos et al., 2007), the choice between CD4+ and CD8+ T cell lineages (Jones-Mason et al., 2012) and peripheral T cell differentiation (Omilusik et al., 2013; Shaw et al., 2016).
Full-length E proteins contain two canonical activation domains (AD1–AD2), a TFIID-interacting activation domain (AD3) (Chen et al., 2013), as well as the PCET and DES domains that mediate binding to the ETO family of transcriptional cofactors (Guo et al., 2009). TCF3 has two splicing isoforms (E47 and E12), which play both unique and overlapping roles in B cell development (Beck et al., 2009). TCF12 comprises distinct transcriptional isoforms, including the AD1 domain-containing “canonical” isoform and the AD1-lacking “alternative” isoform, which differ in their expression and function in reconstitution assays (Braunstein and Anderson, 2010; Wang et al., 2010). Similarly, the AD1-containing “long” isoforms of TCF4 show stronger activation of a transcription reporter (Corneliussen et al., 1991; Sepp et al., 2011; Skerjanc et al., 1996). The mechanisms of lineage-specific E protein activity, including the potential role of distinct E protein isoforms and the regulation of E protein expression, remain poorly understood.
Plasmacytoid dendritic cells (pDCs) comprise a distinct lineage specialized in the production of type I interferon (IFNα/β) in response to viruses and other pathogens. The features and genetic makeup of pDCs are highly conserved between humans and mice, reflecting an important role in immunity (Reizis et al., 2011; Swiecki and Colonna, 2015). pDCs develop in the bone marrow (BM) from a common dendritic cell progenitor (CDP), which also gives rise to antigen-presenting classical dendritic cells (cDCs) (Schraml and Reis, 2015; Shortman et al., 2013). CDP-derived cDC progenitors (pre-DCs) differentiate into two main cDC subsets, CD8+ (CD103+ in tissues) and CD11b+ (“myeloid”). These subsets are conserved in evolution and have been recently termed DC1 and DC2, respectively (Guilliams et al., 2014). In addition to common origins, pDCs and cDCs share related gene expression profiles, dependence on the cytokine Flt3 ligand (Flt3L) and joint regulation by transcription factors including PU.1 and IRF8 (Merad et al., 2013; Satpathy et al., 2012). Importantly, clonogenic CDPs can give rise to both pDCs and cDCs when cultured with Flt3L in the absence of any additional signals. This fact suggests that the pDC versus cDC lineage split is mediated by cell-intrinsic transcriptional mechanisms, such as feedback loops between lineage-specifying transcription factors.
An important regulator of pDC development is the E protein TCF4. Tcf4−/− mice show normal development of all immune cell types but lack pDCs, whereas Tcf4+/− mice and human patients with TCF4 haplodeficiency (Pitt-Hopkins syndrome) show impaired pDC development and/or phenotype (Cisse et al., 2008). Accordingly, pDCs express TCF4 whereas cDCs express Id2, which is particularly abundant in DC1 (Ginhoux et al., 2009; Jackson et al., 2011) and is required for their development (Hacker et al., 2003). TCF4 directly activates pDC-specific gene expression program, and its loss from committed pDCs causes their spontaneous differentiation into DC1-like cells (Ghosh et al., 2010). The in vivo counterpart of such “defaulted” pDCs may be represented by non-canonical CD8+ cDCs, which express many pDC-enriched genes including Tcf4 (Bar-On et al., 2010). The activity of TCF4 is facilitated by its ETO protein cofactor CBFA2T3 (MTG16), which promotes pDC development and restricts DC1 development (Ghosh et al., 2014). Thus, TCF4 appears as a critical determinant of the pDC vs cDC lineage specification, yet the specificity and regulation of its activity in DC development remain poorly understood.
We report that the “long” isoform of Tcf4 is expressed specifically in pDCs and is required for their development, contributing to the specificity of TCF4 function. We also identified a conserved distal enhancer in the Tcf4 gene that is bound by its protein product and mediates the upregulation of Tcf4 expression during pDC lineage commitment. These results reveal the complex developmental regulation of E protein activity, which involves lineage-specific expression of E protein isoforms and feedback regulation through distal regulatory elements.
Results
The long isoform of Tcf4 is expressed specifically in pDCs
To reconcile the broad expression of TCF4 with its pDC-specific activity, we analyzed the expression of its transcriptional isoforms. The FANTOM atlas of transcription start sites revealed two main transcription start sites of the murine Tcf4 gene, thereby defining two promoters (Fig. 1A, S1A). The distal promoter gives rise to the “long” isoform of Tcf4 (here denoted Tcf4L, also referred to as the “B” isoform (Forrest et al., 2014)) that contains all functional domains (Fig. 1B). The proximal promoter gives rise to a “short” isoform (Tcf4S, previously also referred to as the “A” isoform) that lacks the AD1 domain and ETO-binding domains (Fig. 1B). By qRT-PCR, Tcf4S was prominently expressed in pDCs but also present in other cell types including B cells and cDCs (Fig. 1C). In contrast, the expression of Tcf4L was detected almost exclusively in pDCs (Fig. 1C). Using qRT-PCR with a common reverse primer, we found that Tcf4L was more abundant than Tcf4S in the immature Ly49Q− pDCs in the BM (Kamogawa-Schifter et al., 2005; Toyama-Sorimachi et al., 2005), but the two isoforms equalized in mature splenic pDCs (Fig. 1D). The specificity and relative abundance of the two TCF4 isoforms were confirmed by Immuno blot of pDCs derived in Flt3L-supplemented BM cultures (Fig. 1E). Similarly, whole transcriptome sequencing (RNA-seq) of ex vivo sorted DCs (Lau et al., 2016) confirmed that the reads mapping to Tcf4L–specific exons were present only in pDCs (Fig 1F).
Figure 1. The long isoform of Tcf4 is expressed specifically in the pDCs.

(A) Diagram of the murine Tcf4 locus. The two major transcription start sites corresponding to the long (Tcf4L) and short (Tcf4S) isoforms of Tcf4 are indicated. In the Tcf4LacZ allele, the gene trap cassette with splice acceptor (SA) and LacZ has been inserted upstream of the Tcf4L -specific exon 5.
(B) Schematic of protein domains present in the two TCF4 isoforms.
(C) The expression of Tcf4 isoforms in different immune cell types. Indicated cell types were sorted from pooled mouse spleens and analyzed by qRT-PCR with primers for common or isoform-specific exons of Tcf4. Data represent transcript amounts relative to the pDC sample (mean ± S.D. of triplicate PCR reactions).
(D) Relative amounts of the two isoforms during pDC development. Immature Ly49Q−and mature Ly49Q+ subsets of BM pDCs and mature splenic pDCs were sorted from wild-type mice and analyzed by qRT-PCR using isoform-specific forward primers and a common reverse primer. Data represent transcript amounts relative to Tcf4L in the Ly49Q− sample (mean ± S.D. of triplicate PCR reactions).
(E) Western blot analysis of TCF4 protein expression in pDCs and cDCs isolated from Flt3L-supplemented cultures of normal mouse BM. The long (L) and short (S) isoforms are indicated.
(F) RNA-seq data from ex vivo sorted dendritic cell populations. Shown is the Tcf4 locus with the transcription start sites for Tcf4L and Tcf4S indicated. Note that the scale for the pDC track is 10x higher than for the cDC tracks.
(G) The expression of Tcf4L reporter cassette in primary immune cells, as determined by staining for βGal. Shown are representative histograms of βGal expression in the indicated gated populations from the spleen or BM of Tcf4LacZ/+ reporter mice or wild-type controls (WT). Representative of four independent reporter animals.
(H) The expression of Tcf4L and Id2 reporters in primary immune cells from Tcf4LacZ/+ Id2hCD5/hCD5 reporter mice, as determined by staining for βGal and hCD5, respectively. The phenotype of gated βGal+ (green) and hCD5+ (red) populations of splenic CD8+ cDCs is also indicated. Representative of three independent reporter animals.
Please refer to Figure S1.
The analysis of human FANTOM atlas data revealed the same distal and proximal promoters of human TCF4 (Fig. S1B). Furthermore, TCF4 transcripts derived from human pDCs were abundant at the distal promoter, whereas transcripts from B cells were specifically enriched at the proximal promoter (Fig. S1C). Accordingly, the human pDC cell line Gen2.2 expressed both TCF4 isoforms, but the human B lymphoblastoid line GM12878 expressed only TCF4S (Fig. S1D). Thus, the main transcriptional isoforms of TCF4 and the pDC-specific expression of the long isoform appear conserved between mice and humans.
To analyze the expression of Tcf4L in vivo at the single-cell level, we used a Tcf4 allele with a reporter cassette inserted upstream of the Tcf4L-specific exon (Fig. 1A). The splice acceptor in the cassette traps Tcf4L transcript and drives the expression of bacterial LacZ gene, whose product β-galactosidase (βGal) can be visualized by flow cytometry using a fluorescent substrate. The analysis of heterozygous Tcf4LacZ/+ reporter mice revealed homogeneous βGal expression exclusively in pDCs (Fig. 1G). To compare the expression of Tcf4L with that of its functional antagonist Id2, we crossed Tcf4LacZ/+ mice with the Id2hCD5 reporter strain that expresses surface marker hCD5 from the Id2 locus without disrupting the latter (Jones-Mason et al., 2012). Simultaneous staining for Tcf4L (βGal) and Id2 (hCD5) showed that pDCs were βGal+ hCD5− and cDCs were βGal− hCD5+ (Fig. 1H). Whereas the majority of CD8+ cDC showed the expected βGal− hCD5hi phenotype of DC1, a minor βGal+ hCD5lo population was also detected. The hCD5lo cells had low side scatter (SSC) and low CD86 expression (Fig.1H) typical of non-canonical CD8+ cDCs (Bar-On et al., 2010). Collectively, these data show that Tcf4L is expressed specifically in pDCs and reciprocally to Id2, which is abundant in canonical cDCs.
Although Tcf4L was absent from naive B cells, we observed its low expression in the germinal center (GC) B cells (Fig. S1E). Specifically, it was detected in the CXCR4+ CD83− centroblast population that undergoes activation-induced deaminase (AID)-dependent somatic hypermutation and class switch recombination (Bannard et al., 2013; Victora and Nussenzweig, 2012). Conversely, the CXCR4− CD83+ centrocytes had lower expression of Tcf4L but expressed detectable Id2 (Fig. S1G). B cell-specific deletion of TCF4 did not impair GC B cell numbers or phenotype, and did not affect antibody responses or somatic hypermutation (data not shown), likely due to genetic redundancy with TCF3 (Gloury et al., 2016; Wohner et al., 2016). Thus, the centroblast-specific expression of TCF4L is not required for centroblast development, but is consistent with a genetically redundant function of TCF4 in these cells.
Both Tcf4 isoforms are required for optimal pDC development in vitro
To investigate the roles of individual Tcf4 isoforms in pDC development, we used a conditionally immortalized progenitor cell line, HoxB8-FL (Redecke et al., 2013). Withdrawal of estrogen from these cells inactivated the immortalizing HoxB8 oncogene and induced Flt3L-dependent differentiation into pDCs and cDCs (Fig. 2A). In this system cDCs were CD11b+ and MHC IIhi, while the CD11b− MHC II− population contained B220+ Bst2+ pDCs (Fig. 2B). We used CRISPR/Cas9-mediated genome editing to disrupt either or both isoforms of Tcf4 in HoxB8-FL cells (Fig. S2A, B). Lentiviruses encoding single guide RNA (sgRNA) to exons specific for Tcf4L, Tcf4S or to a common exon were introduced into Cas9-expressing undifferentiated HoxB8-FL cells (Fig. 2C). Following selection in bulk cultures, the targeting of each isoform was confirmed by the T7 cleavage assay (Fig. S2C) and Immuno blot (data not shown), and the resulting cells were subjected to differentiation.
Figure 2. Both Tcf4 isoforms are required for optimal pDC development in vitro.

(A) Schematic of the HoxB8-FL cell line differentiation.
(B) The differentiation output of HoxB8-FL cell line at day 7 after the removal of β-estradiol. Shown are staining plots for CD11b and MHC II, with the Bst2+ B220+ mature pDCs highlighted.
(C) Schematic of Tcf4 locus with CRISPR sites targeting the isoforms indicated in green (Tcf4L), purple (Tcf4S) and black (Tcf4 common).
(D) The differentiation output of HoxB8-FL cells with the CRISPR/Cas9-mediated deletion (Del) of Tcf4L, Tcf4S or total Tcf4L. Shown are representative staining plots for CD11b and MHC II (top) and the gated CD11b− MHC II− population (bottom) with the Bst2+ B220+ mature pDCs highlighted.
(E) The frequencies among total live cells and absolute numbers of pDCs in differentiated HoxB8-FL cultures with isoform-specific or global TCF4 deletion. Shown are individual values from 5–6 independent differentiation experiments; bar represents the median. Statistical significance: *, p<0.05; **, p<0.01.
Please refer to Figure S2.
As expected, the deletion of both Tcf4 isoforms resulted in a profound loss of pDCs, with only few remaining cells showing low expression of pDC markers (Fig. 2D–E). The deletion of either Tcf4L or Tcf4S allowed pDC development but caused a significant reduction of pDC fraction and absolute numbers (Fig. 2D–E). No significant difference was observed between the numbers of resulting pDCs after the disruption of either isoform (Fig. 2E); moreover, these residual pDCs had similar gene expression patterns, including the expected upregulation of cDC-enriched genes (data not shown). Finally, chromatin immunoprecipitation (ChIP-Seq) analysis of TCF4 binding in cells lacking specific isoforms did not reveal major differences in binding targets (data not shown). Collectively, these data suggest that both isoforms of TCF4 have similar molecular activities and control pDC development in an additive and non-redundant fashion.
Tcf4L is required for optimal pDC development in vivo
To test the role of the pDC-specific Tcf4L isoform in vivo, we took advantage of the gene trap functionality of the Tcf4LacZ allele (Fig. 1A). Indeed, the expression of Tcf4L was nearly abolished in Tcf4LacZ/LacZ mice, whereas the expression of Tcf4S was unaffected (Fig. S3A). A specific ablation of the TCF4L protein isoform was confirmed by Immuno blot on total BM cells (Fig. S3B). Heterozygous Tcf4LacZ/+ animals showed a minor reduction of pDC frequency in the BM and normal pDC frequency in the spleen (Fig. 3A and data not shown). Very few weaning-age homozygous Tcf4LacZ/LacZ mice could be derived from the intercross of Tcf4LacZ/+ parents (Fig. S3C); those rare mice were runted and showed abnormal behavior, likely reflecting the role of TCF4 in brain development (Flora et al., 2007). The partial lethality and failure to thrive of Tcf4LacZ/LacZ mice stand between the complete lethality of Tcf4−/− mice and the full viability of Tcf4+/− mice. As such, Tcf4LacZ/LacZ mice comprise a part of Tcf4 “allelic series”, although their utility for functional pDC analysis may be limited.
Figure 3. Tcf4L is required for optimal pDC development and restricts the development of non-canonical cDC.

(A) The pDC population in the BM of mice with heterozygous (Tcf4LacZ/+) or homozygous (Tcf4LacZ/LacZ) targeting of Tcf4L compared to wild-type (Tcf4+/+) littermates. Shown are representative staining profiles of gated B220+ BM cells with the CD11clo Bst2+ pDC population highlighted, and the frequency of pDCs among total BM cells (mean ± S.D. of 6 mice per group).
(B) The pDC population in chimeras reconstituted with Tcf4+/+ or Tcf4LacZ/LacZ hematopoietic cells. Shown are representative staining profiles of gated CD45.1− donor-derived cells from the BM or spleen, and the frequency of B220+ CD11clo Bst2+ pDCs among the total donor-derived cells (median and individual values from 4 recipient mice per group).
(C) The expression of characteristic pDC (left column) and cDC (right column) markers in the gated pDCs from Tcf4+/+ or Tcf4LacZ/LacZ mice. Representative of three recipient animals.
(D) Splenic cDC population in recipients of Tcf4+/+ or Tcf4LacZ/LacZ hematopoietic cells carrying the Id2hCD5 reporter. Shown are staining profiles of donor-derived CD11chi cDCs and the expression of hCD5 marker in the CD8+ cDC subset. Representative of four recipient animals.
(E) The fraction of cDC subsets among donor-derived CD45.1− splenocytes in the chimeras described above. CD8+ cDCs were separated into the canonical hCD5+ (DC1) and non-canonical hCD5− cDCs. Shown are median and individual values from 4 recipient mice per group. Statistical significance: *, p<0.05.
Please refer to Figure S3.
The surviving adult Tcf4LacZ/LacZ mice showed a reduction in the fraction of pDCs in the BM (Fig. 3A), while the spleens were too small for quantitative analysis (data not shown). To circumvent health defects in Tcf4LacZ/LacZ mice, we reconstituted wild-type recipients with control or Tcf4LacZ/LacZ hematopoietic cells. The fraction of Tcf4LacZ/LacZ pDCs among total donor-derived cells was significantly reduced in the BM and spleen of the resulting chimeras (Fig. 3B). Similarly, the fraction of mature pDCs in Flt3L-supplemented cultures of Tcf4LacZ/LacZ recipient BM was reduced (Fig. S3D). Similar to Tcf4+/− pDCs, pDCs from Tcf4LacZ/LacZ mice showed aberrant phenotype including the loss of CCR9 and CD4, and reduction of Bst2 (Fig. 3C). Conversely, cDC markers CD11c, CD8 and (to a lesser extent) MHC class II were upregulated (Fig. 3C), overall suggesting a “drift” towards the cDC fate.
To analyze the development of Tcf4L-deficient cDCs, we reconstituted wild-type recipients with Tcf4LacZ/LacZ hematopoietic cells carrying the Id2hCD5 reporter. Donor-derived pDCs in the recipients of Tcf4LacZ/LacZ Id2hCD5 BM showed the same reduction and phenotypic abnormalities (data not shown). Whereas the DC2 and canonical hCD5hi DC1 were unchanged, the fraction of hCD5lo non-conventional CD8+ cDC was significantly increased compared to controls (Fig. 3D,E). We conclude that TCF4L facilitates optimal pDC differentiation and prevents their “default” into the non-canonical pDC-related cDC subset.
Tcf4L is expressed in progenitors and is upregulated during pDC commitment
To characterize the regulation of Tcf4L expression during pDC development, we stained hematopoietic progenitors from Tcf4LacZ/+ reporter mice for βGal. βGal expression was detected in hematopoietic stem cells (HSCs), myeloid progenitors (MPs) and common dendritic cell progenitors (CDPs), albeit lower than in pDCs (Fig. 4A). The expression of total TCF4 protein in these progenitor populations was confirmed by intracellular staining (Fig. 4B and S4A). By qRT-PCR, Tcf4L and Tcf4S transcripts were comparably expressed in progenitors, followed by Tcf4L upregulation in the BM pDCs (Fig. S4B). Although the CD115− subset of common dendritic cell precursors (CDPs) was reported to express as much Tcf4 as pDCs (Onai et al., 2013), this was not observed in our analysis. Notably, cDC progenitors in the BM (pre-DCs) also expressed Tcf4 but also upregulated Id2, consistent with cDC commitment (Fig. S4C). Thus, the expression of Tcf4 is initiated in early progenitors prior to pDC versus cDC lineage split; in particular, the expression of Tcf4 but not of Id2 by CDPs likely maintains their pDC potential.
Figure 4. The expression of Tcf4 precedes pDC commitment.

(A) The expression of Tcf4L reporter in the stem and progenitor populations from Tcf4LacZ/+ reporter mice. Shown are histograms of βGal expression in gated Lin− BM populations including HSC (Flt3− Sca-1+ c-Kit+), MP (Flt3+ Sca-1− c-Kit+), CDP (Sca-1− c-Kitlo Flt3+ CD115+), CD115− lymphoid and DC progenitors (Sca-1− c-Kitlo Flt3+ CD115−). The high background of βGal staining precluded resolution of dim markers such as CD115 in MP. Gated pDCs and B cells are shown as a positive and negative control, respectively. Representative of three reporter animals.
(B) The expression of TCF4 protein in the progenitor populations from wild-type mice. Shown are histograms of intracellular TCF4 expression in gated Lin− BM populations including the HSC-containing LSK subset (c-Kit+ Sca-1+), myeloid progenitors (MP, Sca-1− Flt3+ c-Kit+ CD115−), macrophage and DC progenitor (MDP, Sca-1− Flt3+ c-Kit+ CD115+), CDP (Sca-1− Flt3+ c-Kitlo CD115+ CD11c−). The staining with control IgG is shown for the HSC population and is representative of all indicated populations.
(C) The kinetics of HoxB8-FL cell differentiation in Flt3L culture. Shown are the expression histograms of DC marker CD11c at the indicated days after the induction of differentiation in HoxB8-FL cells by estrogen withdrawal.
(D) The expression of TCF4 protein in the differentiating HoxB8-FL cells at the same time points, as determined by intracellular staining with anti-TCF4 mAb or control IgG.
(E) The expression of TCF4 protein at the early (day 3), middle (day 5) and late (day 7) stages of DC differentiation. Shown are plots of TCF4 expression versus the markers of differentiated pDCs (Bst2, B220) or cDCs (MHC II).
(F) The expression of Tcf4 isoform transcripts in the differentiating HoxB8-FL cells. Total HoxB8-FL cells at the indicated days of differentiation were analyzed by qRT-PCR using Tcf4 isoform-specific primers as in Fig. 1C. Data represent transcript amount relative to Tcf4L expression on day 0 (mean ± S.D. of triplicate PCR reactions). Data in panels D–F are representative of the original HoxB8-FL clone (Redecke et al., 2013) and two independently derived HoxB8-FL clones.
Please refer to Figure S4.
To further resolve the temporal dynamics of Tcf4 expression during pDC development, we used HoxB8-FL cell line. During its differentiation, CD11c-expressing DCs emerge on days 4–5 and become predominant by day 7 (Fig. 4C). Notably, TCF4 protein expression preceded DC emergence and was homogeneously high on day 3 (Fig. 4D,E). By day 7, cultures contained both TCF4+ and TCF4− cells (Fig. 4D), with TCF4 expression enriched in B220+ Bst2+ pDCs and excluded from mature MHC II+ cDCs (Fig. 4E). qRT-PCR of total cells at each time point showed a coordinate increase of both Tcf4 isoforms on days 3–5, with a particularly notable induction of Tcf4L (Fig. 4F). Collectively, these data suggest that the expression of Tcf4, and particularly of the Tcf4L isoform, precedes pDC commitment and is subsequently maintained in pDCs but downregulated in cDCs and other mature cell types.
A 3′ enhancer is required for Tcf4 expression during pDC development
The expression of Tcf4 prior to pDC commitment suggests that TCF4 may maintain its own expression in the developing pDCs through a putative regulatory region. The analysis of sorted primary mouse DCs for active regulatory regions by the assay for transposase-accessible chromatin (ATAC-Seq) revealed several pDC-specific peaks within ~1.5 Mb around the Tcf4 locus (Fig. 5A). The most prominent and specific ATAC-Seq signal (two adjacent peaks) was located ~150 Kb 3′ of Tcf4, in a region that has no annotated coding genes (Fig. 5A). The sequences corresponding to the two peaks are conserved in mammals (Fig. S5A) and contain several conserved E boxes (data not shown). Importantly, these regions correspond to the binding peaks of TCF4 in human pDC cell lines (Fig. S5A). Comparison between DC and other hematopoietic cell types (Shih et al., 2016) revealed that the ATAC-Seq signal was low or absent in HSC, progenitors or B cells; it was also absent from neurons (Mo et al., 2015), which express TCF4 (Fig. 5B). In contrast, the promoters of both Tcf4 isoforms produced prominent ATAC-Seq signal in all these cell types (Fig. 5C).
Figure 5. A distal 3′ enhancer controls Tcf4 upregulation in pDC.

(A) ATAC-Seq analysis of Tcf4 locus in primary DCs. Shown are ATAC-Seq peaks across ~1.5 Mb of the Tcf4 locus; indicated are proximal promoters of Tcf4L (green) and Tcf4S (purple), the 3′ enhancer (orange) and the cluster of 5′ regulatory elements (yellow). In this and subsequent panels, the scale was adjusted between different samples based on signals from housekeeping genes.
(B) ATAC-Seq analysis of the 3′ enhancer of Tcf4 in the indicated primary cell types.
(C) ATAC-Seq analysis of the two Tcf4 promoters in the same primary cell types.
(D) ChIP analysis of histone modifications (H3K4me1 and H3K27ac) and of TCF4 binding to the 3′ enhancer in differentiating HoxB8-FL cells. Shown is fold enrichment of bound 3′ enhancer region over a control region in undifferentiated (day 0), differentiating (day 4) and mature pDC and cDC on day 7. ND, no signal detected.
(E) The differentiation output of HoxB8-FL clones with heterozygous enhancer deletion (Del-1 and -2) and a control non-targeted clone. Shown are staining plots of day 7 differentiated cultures gated on the CD11b− MHC II− non-cDC population, with the Bst2+ B220+ mature pDCs highlighted. Representative of three independent differentiation experiments.
(F) The expression of Tcf4 isoform transcripts during the differentiation of enhancer-targeted clones shown above. Total cultures on days 0, 4 or 7 of differentiation were analyzed by qRT-PCR using Tcf4 isoform-specific primers as in Fig. 1C. Data represent transcript amounts relative to Tcf4L expression on day 0 (mean ± S.D. of triplicate PCR reactions; representative of two differentiation experiments).
Please refer to Figure S5.
We analyzed the 3′ region by ChIP during the differentiation of HoxB8-FL cells. Histone modifications associated with active enhancers, including histone 3 lysine 4 monomethylation (H3K4me1) and lysine 27 acetylation (H3K27ac), were induced in this region on day 4, i.e. at the onset of pDC differentiation (Fig. 5D). Similarly, the binding of TCF4 was massively induced at the same time point and persisted in mature pDCs. Previously published ChIP-Seq analysis of BM-derived DCs (Grajales-Reyes et al., 2015) revealed the pDC-specific H3K27ac signal and binding of the co-activator p300 in this region (Fig. S5B). Thus, the regulatory element 3′ of Tcf4 represents a pDC-specific enhancer that becomes activated and bound by TCF4 at the onset of pDC differentiation.
To test the role of the enhancer in Tcf4 expression, we targeted it in the HoxB8-transformed cell line using the CRISPR/Cas9-based genome editing (Fig. S5C–D). The resulting cells were cloned by limiting dilution and screened for the presence of the wild-type and deleted alleles. Whereas no homozygous deletions were found, we identified 2 out of 81 clones with a heterozygous deletion (Fig. S5E). Upon differentiation, the two deletion-carrying clones failed to produce mature Bst2+ B220hi pDCs (Fig. 5E). Moreover, the induction of Tcf4 expression prior to pDC differentiation on day 4 of the cultures was markedly reduced in the targeted clones (Fig. 5F). Both Tcf4 isoforms were reduced, with the induction of Tcf4L nearly abolished. The observed strong effects of monoallelic targeting are consistent with the haploinsufficiency of Tcf4, which is particularly evident in Flt3L-driven pDC development in culture (Cisse et al., 2008). These data suggest that the 3′ enhancer is required for the induction of Tcf4 in immature pDCs and for the ensuing pDC differentiation.
Tcf4 expression and pDC development are regulated by BET-dependent enhancers
ATAC-Seq and ChIP-Seq analysis of transformed human pDC cell lines identified multiple regulatory elements 5′ of TCF4, which collectively comprised a super-enhancer (Ceribelli et al., 2016). Similarly, ATAC-Seq on normal murine cells (Fig. 5A) revealed multiple pDC-specific peaks spread across ~900 Kb 5′ of Tcf4. A more detailed analysis of this region revealed two types of ATAC-Seq peaks (Fig. 6A): those that were present in stem and progenitor cells but extinguished in pDCs (e.g. peak A) and those that were present preferentially in pDCs (e.g. peaks B and C). The pDC-specific 5′ peaks also showed enhancer-associated chromatin marks in BM-derived pDCs (Grajales-Reyes et al., 2015) (Fig. S6A). The reciprocal epigenetic pattern of the pDC- and progenitor-specific elements was confirmed by ChIP-qPCR analysis of HoxB8-FL cells, the progenitor-specific peak A rapidly lost activating chromatin marks upon differentiation (day 4). Conversely, pDC-specific elements B and C acquired activating chromatin marks and showed TCF4 binding by day 4 and especially in mature pDCs (Fig. 6B and S6B). Notably, TCF4 binding at the 3′ enhancer preceded binding at the 5′ regulatory regions, consistent with its prominent role in the positive feedback regulation of TCF4 expression.
Figure 6. Dynamic regulatory landscape of Tcf4 in pDC development.

(A) ATAC-Seq analysis of the region 5′ of Tcf4 in primary cell types. Representative peaks specific for stem and progenitor cells (A) or for mature pDC (B and C) are indicated.
(B) Combined results of ChIP analysis for H3K27 acetylation and TCF4 binding to the indicated regulatory regions. Shown is the schematic of HoxB8-FL cell line differentiation at days 0 (d0), 4 (d4) and 7 (d7; pDC in oval shape, cDC in dendritic shape). Color intensity indicates % of maximum fold change over control.
(C) The differentiation output of HoxB8-FL cells in the presence of BET domain inhibitor JQ1 compared to vehicle alone. Shown are representative staining plots for CD11b and MHC II (top) and the gated CD11b− MHC II− population (bottom) with the Bst2+ B220+ mature pDCs highlighted. Absolute numbers of CD11b+ MHC II+ cDCs and Bst2+ B220+ pDCs from 6 independent parallel cultures are shown.
(D) The expression of Tcf4 isoform transcripts in JQ1-treated HoxB8-FL cells. Total HoxB8-FL cells at the indicated days of differentiation were analyzed by qRT-PCR using Tcf4 isoform-specific primers as in Fig. 1C. Data represent transcript amounts relative to Tcf4L expression on day 0 (mean ± S.D. of triplicate PCR reactions). Representative of two experiments.
Statistical significance: *, p<0.05.
Please refer to Figure S6.
In transformed human pDC lines, the expression of TCF4 and activity of all its regulatory regions were dependent on bromodomain and extraterminal (BET) domain-containing proteins (Ceribelli et al., 2016). BET proteins comprise a family of transcriptional cofactors that are particularly important for the activity of super-enhancers, and their inhibition by drugs such as JQ1 potently inhibits cell growth (Delmore et al., 2011). Given the dependence of TCF4 expression in malignant pDCs on BET proteins, we tested whether this mechanism is also operative in normal pDC development. To circumvent the effect of JQ1 on cell growth, we used HoxB8-FL cells that cease to proliferate after the induction of differentiation. Treatment of differentiating HoxB8-FL cells with 100 nM JQ1 caused a significant reduction of pDCs, while cDC numbers were unaffected (Fig. 6C). This was accompanied by a marked decrease of Tcf4 expression, particularly of its induction at the onset of pDC differentiation (day 4, Fig. 6D). Collectively, these data suggest that BET proteins facilitate Tcf4 expression and are required for the establishment of a TCF4-dependent positive feedback loop that facilitates pDC development.
Discussion
We here report that the “long” transcriptional isoform of E protein TCF4 (TCF4L) is expressed specifically in pDCs and their progenitors, whereas the short isoform (TCF4S) accounts for the observed Tcf4 expression in other immune cell types. In an in vitro model of DC development, the deletion of either isoform impaired pDC development to a similar degree. Moreover, the resulting pDCs had a similar expression profile characterized by the induction of cDC-specific genes, and no difference was found between the binding targets of specific isoforms (data not shown). Therefore, the two transcriptional isoforms of Tcf4 may be functionally overlapping and contribute to pDC development in an additive manner. These results were confirmed in vivo for Tcf4L, whose deletion did not abolish the development of pDCs but led to their reduced numbers and impaired phenotype. This isoform may be particularly important for pDC development rather than maintenance, because its deletion had a stronger impact on pDCs in the BM than in the spleen; in contrast, haplodeficiency for total Tcf4 has a minor effect on BM pDCs but strongly affects their peripheral maintenance and functionality (Cisse et al., 2008; Ghosh et al., 2010). Overall, the combination of a broadly expressed and a lineage-specific transcriptional isoform facilitate and fine-tune the role of TCF4 in pDC specification and maintenance.
The loss of TCF4L reduced pDC numbers and caused phenotypic changes characteristic of cDC differentiation, resembling the reduction of total TCF4 or of its cofactor Mtg16. Notably, the loss of total TCF4 or of Mtg16 abolished the development of non-canonical Id2lo CD8+ cDCs (Bar-On et al., 2010; Ghosh et al., 2014), whereas the deletion of TCF4L enhanced it. These results further suggest that the non-canonical CD8+ cDCs are “by-products” of pDC development, originating from pDCs that failed to accrue sufficient TCF4 expression (Reizis et al., 2011). Thus, strong reduction of net TCF4 activity (e.g. in TCF4 or Mtg16 deficiency) impairs both pDCs and non-canonical cDCs, whereas moderate reduction (e.g. in TCF4L deficiency) “shunts” pDCs towards the non-canonical cDCs. This shunt apparently occurs early in developing pDCs rather than in the periphery, because pDC reduction is already prominent in the BM. The CCR9− pDC precursor that retains the cDC potential (Schlitzer et al., 2011) represents a likely stage of the bifurcation between pDCs and non-canonical cDCs. The proposed model reconciles our results with previous observations and suggests that the TCF4L isoform is particularly important for cell fate stabilization in immature pDCs.
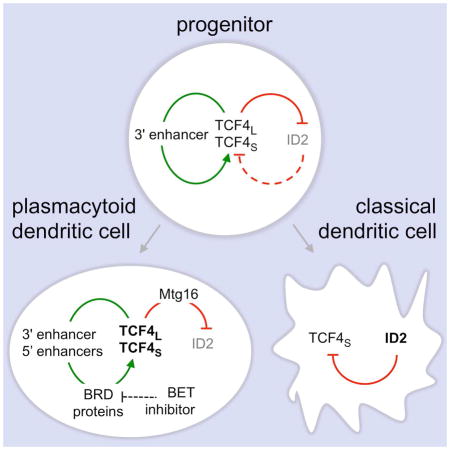
The key role of TCF4 in pDC lineage specification begs the question of upstream signal(s) that induce its expression in pDCs. We here report that TCF4, particularly its pDC-specific long isoform, is expressed in hematopoietic progenitors and is further induced in pDCs but silenced in other cell types. Similarly, in a “time-controlled” HoxB8-FL cell line model, TCF4 was induced in most cells and then “resolved” at the pDC versus cDC bifurcation. The expression of TCF4 but not of its inhibitor Id2 is particularly notable in CDP, supporting the role of this population as a major source of pDCs. This observation also explains the early expression of pDC-specific genes in CDP (Miller et al., 2012), which likely reflects their pDC potential rather than actual commitment. We have previously described a negative feedback loop whereby TCF4 and its cofactor Mtg16 repress the expression of Id2 (Ghosh et al., 2014). Conversely, the increase of TCF4 expression from intermediate in progenitors to high in pDCs can be best explained by a positive feedback regulation by TCF4 and its target transcription factors such as Bcl11a and SpiB (Ghosh et al., 2010; Ippolito et al., 2014; Nagasawa et al., 2008). Such E protein-dependent positive and negative feedback loops represent a robust “built-in” mechanism of DC diversification in the absence of specific inducers.
The postulated cell-intrinsic upregulation of TCF4 in pDCs implies a cis-regulatory element that would enhance the expression of both TCF4 isoforms in response to TCF4 itself. We have identified a conserved pDC-specific enhancer 3′ of the Tcf4 gene that is prominently bound by TCF4 in human and murine cultured pDCs. During HoxB8-FL differentiation, activated chromatin marks and TCF4 binding in the enhancer coincided with the induction of Tcf4 expression prior to the emergence of mature pDCs. Finally, monoallelic deletion of this element reduced the induction of Tcf4 during pDC differentiation and the output of mature pDCs in vitro. Thus, Tcf4 expression in pDC lineage specification is controlled by the 3′ lineage-specific enhancer through a TCF4-dependent positive feedback loop.
In addition to the 3′ enhancer, multiple elements in the Tcf4 5′ region showed dynamic changes during pDC differentiation. Some of these elements appeared active in stem cells and progenitors but silent in pDCs, suggesting that they might regulate the initial Tcf4 expression prior to DC development. Other 5′ elements became active specifically in pDCs; these elements also bound TCF4 and therefore may play a role in its feedback regulation. Notably, the 3′ enhancer showed an earlier activation and stronger TCF4 binding during pDC development, consistent with its major non-redundant role in the process. Thus, distal 5′ and 3′ regulatory elements appear to drive TCF4 expression, and their combinations with the respective promoters yield broader (for TCF4S) or pDC-specific (for TCF4L) expression patterns. In cultured human pDC lymphoma cell lines, the activity of all distal regulatory elements of TCF4 is controlled by BET domain proteins and is inhibited by BET inhibitor JQ1 (Ceribelli et al., 2016). Accordingly, Tcf4 expression during pDC differentiation was also inhibited by JQ1, extending this mechanism to normal DC development. The preferential sensitivity of pDC development to BET inhibition further emphasizes the active nature of pDC development, which is driven by a hierarchy of regulatory elements controlling Tcf4 expression. In contrast, cDC differentiation may represent a “default” pathway in the absence of dominant E protein activity (Ghosh et al., 2010).
In conclusion, we describe tissue-specific isoform usage and feedback regulation of E protein TCF4 in a prototypical lineage specification event, the choice between pDC and cDC lineages. The positive feedback mechanism of TCF4 regulation helps explain essential features of the pDC vs cDC lineage choice, including its apparent cell-intrinsic nature; resolution from a TCF4-intermediate progenitor state into TCF4-expressing pDCs and Id2-expressing cDCs; and enhanced DC1 development at the expense of pDCs upon the net reduction of E protein activity (Ghosh et al., 2014; Scott et al., 2016). Similar mechanisms involving E proteins and their antagonists are likely operational in other immune cell lineages such as T and B lymphocytes, as well as in other tissues such as the brain.
Materials and Methods
Animals
All animal experiments were performed according to the investigator’s protocol approved by the Institutional Animal Care and Use Committee. The targeted Tcf4 reporter allele (Tcf4tm1a(EUCOMM)Wtsi) has been generated as part of the Mouse Knockout Project (KOMP). Embryonic stem cells (JM8.F6 line, C57BL/6) were injected into C57BL/6 blastocysts at the KOMP/Mouse Biology Program at the University of California, San Diego, and the resulting chimeras were crossed to C57BL/6 mice to generate Tcf4LacZ mice on pure C57BL/6 background. The strain was maintained by backcrossing to C57BL/6 mice or intercrossed where indicated. For the Tcf4L/Id2 double reporter, we used the fully functional Id2 allele containing an IRES-human CD5 cassette in the 3′ UTR (Jones-Mason et al., 2012). Tcf4LacZ/+ mice were crossed with Id2hCD5/hCD5 mice on C57BL/6 background and backcrossed to generate Tcf4LacZ/+ Id2hCD5/hCD5 mice. Wild-type C57BL/6 mice were obtained from Taconic.
For hematopoietic reconstitution with Tcf4LacZ/LacZ cells, 2×10⁶ total BM cells from wild-type or surviving adult Tcf4LacZ/LacZ mice were injected i.v. into lethally irradiated recipient mice. For hematopoietic reconstitution with Tcf4LacZ/LacZ Id2hCD5/hCD5 cells, timed matings of Tcf4LacZ/+ Id2hCD5/hCD5 mice were established and livers from Tcf4LacZ/LacZ Id2hCD5/hCD5 or control Tcf4+/+ Id2hCD5/hCD5 fetuses were used for reconstitution. All recipients were F1 progeny of 129SvEv and B6.SJL mice congenic for the CD45.1 allele. Donor-derived hematopoietic cells were identified as CD45.2+ CD45.1− and comprised >90% in all recipients. To analyze GC formation, mice were injected i.p. with 0.3 ml of the 3.3% solution of sheep red blood cells (Cocalico Biologicals) and analyzed 14 days later.
Cell culture
Murine progenitor HoxB8-FL cell line was derived and cultured as described (Redecke et al., 2013). Briefly, the cells were grown in RPMI supplemented with 10% FCS, 10% supernatant from the Flt3L-producing B16 cell line, and 10 μM β-estradiol. The cells were induced to differentiate into DCs by washing and replating in the same medium without β-estradiol. For pDC development in vitro, total BM cells (2×10⁶/ml) were cultured for 7 d with 100 ng/ml recombinant human Flt3L (PeproTech). For protein analysis, pDCs were enriched by magnetic sorting (Miltenyi Biotech) for B220+ cells. For BET-protein inhibition, HoxB8-FL cells were differentiated in the presence of 100 nM JQ1 (SigmaAldrich) dissolved in DMSO or in DMSO alone as a control.
Genome editing in HoxB8-FL cells
The Tcf4 isoforms were targeted using the CRISPR/Cas9 approach with sgRNAs to exons specific for either isoform, or to a common exon as a control. The 3′ enhancer element was targeted using the short guiding RNAs to DNA elements flanking the region. Details of the targeting are described in Supplemental Methods.
Cell analysis
Single-cell suspension of splenocytes or BM cells were subjected to red blood cell lysis, washed, and then stained for multicolor analysis with the indicated fluorochrome-conjugated antibodies (BD Biosciences or eBioscience). The samples were acquired on an LSRII flow cytometer or sorted on FACSAria II flow sorter (BD Biosciences) and analyzed with FlowJo software (TreeStar). The pDCs were defined as B220+ CD11clo Bst2+; cDCs were defined as B220− CD11chi and further subdivided into subsets as indicated. For progenitor analysis, BM cells were stained with a cocktail of antibodies to lineage markers (CD3, NK1.1, CD19, CD11b, Gr1) and the DC marker CD11c, unless it was used in a separate fluorescence channel. Id2 expression was detected by surface staining with a fluorochrome-conjugated antibody specific to Human CD5 (clone UCHT2). To analyze LacZ expression, cells were resuspended in HBSS with 1 mM HEPES and 2% FBS, incubated for 20 min at 37°C, mixed with pre-warmed fluorescein di-β-D-galactopyranoside (FDG, SigmaAldrich) in a hypotonic solution for 1 min, placed on ice and washed with ice-cold buffer. Endogenous β-gal activity from lysosomes was inhibited by chloroquine diphosphate. Following FDG loading, cells were stained for surface markers and analyzed by flow cytometry.
For intracellular TCF4 staining, cells were stained for surface markers, fixed/permeabalized with the intracellular fixation and permeabilization buffer kit (eBioscience) for 1 hr at 4°C, and incubated with 2 % mouse serum for 15 min. Cells were stained for 1 hr at room temperature with control rabbit IgG or with a rabbit mAb to TCF4 (Ceribelli et al., 2016). The cells were then washed, incubated with PE-conjugated anti-rabbit IgG (Jackson Immunoresearch) and analyzed by flow cytometry.
Gene expression analysis
RNA from total or sorted cell samples was isolated using TRIzol reagent (Life Technologies), reverse transcribed (SuperScript III; Life Technologies) and assayed by SYBR Green-based real-time PCR using primers listed in Supplemental Methods. The expression of Tcf4 and Id2 were normalized to that of housekeeping gene Actb and quantified using the ΔΔCT method.
For protein analysis, cell pellets were lysed with a nuclear lysis buffer (1% SDS, 150 mM Tris-HCL pH 8.25, 10mM EDTA), sonicated briefly to facilitate pipetting and boiled for 10 min in the presence of 1% SDS loading buffer. Lysates from equal cell numbers were analyzed by SDS-PAGE followed by Western blotting with antibodies to TCF4 or to tubulin as a loading control.
Chromatin analysis
Visualization and analysis of existing ATAC-Seq and ChIP-Seq data are described in Supplemental Methods. Chromatin immunoprecipitation in HoxB-FL cells was performed as previously described (Ghosh et al., 2014). Briefly, 3×10⁶ cells were fixed for 5 min using the truChIP™ High Cell Chromatin Shearing Kit with SDS Shearing Buffer (Covaris) according to manufacturer’s protocol. The fixed nuclei were sheared using the Covaris LE220 ultrasonicator for 6 minutes. Sheared chromatin was incubated overnight at 4°C with magnetic Protein A beads pre-coated with Abs to TCF4, H3K4me1 (Abcam) or H3K27ac (Abcam). The DNA was eluted from beads by incubating at 65°C for 15 min, incubated overnight at 65°C to reverse crosslinks, purified and used for qPCR using primers listed in Supplemental Methods. A fixed amount of total chromatin input was used as a control. Percent input was calculated using 100*2^(adjusted input - CT(IP), where adjusted input equals CT(input)-log2(dilution factor). Fold enrichment was calculated using % input (region of interest) divided by % input (control region).
Statistical analysis
Statistical significance was estimated by nonparametric Mann-Whitney test except in Fig. 6C, in which Wilcoxon matched-pairs signed-rank test was used.
Supplementary Material
Highlights.
Two functional isoforms of the E protein factor TCF4 (E2-2) are expressed in pDC
The “long” TCF4 isoform is pDC-specific and controls pDC development in vivo
A conserved enhancer controls TCF4 expression and pDC development
TCF4 expression and pDC development are sensitive to BET protein inhibitors
Acknowledgments
We thank S. Kellner for help with cloning sgRNA constructs, N. De Silva and N. Heise for advice, and Y. Zhuang for the Id2 reporter strain. Supported by the NIH grants AI072571 (B.R), AI100853 (C.M.L.) and AI124661 (M.E.W.)
Footnotes
Author contributions
L.T.G., C.M.L., M.E.W., I.T., S.N.H. and A.B. performed and interpreted experiments. L.A.M. contributed to the initial data analysis. M.C. and L.M.S. provided essential reagents, unpublished data and interpretations. H.H. provided reagents. B.R. conceived and supervised the project. L.T.G. and B.R. wrote the manuscript.
Publisher's Disclaimer: This is a PDF file of an unedited manuscript that has been accepted for publication. As a service to our customers we are providing this early version of the manuscript. The manuscript will undergo copyediting, typesetting, and review of the resulting proof before it is published in its final citable form. Please note that during the production process errors may be discovered which could affect the content, and all legal disclaimers that apply to the journal pertain.
References
- Bannard O, Horton RM, Allen CD, An J, Nagasawa T, Cyster JG. Germinal center centroblasts transition to a centrocyte phenotype according to a timed program and depend on the dark zone for effective selection. Immunity. 2013;39:912–924. doi: 10.1016/j.immuni.2013.08.038. [DOI] [PMC free article] [PubMed] [Google Scholar]
- Bar-On L, Birnberg T, Lewis KL, Edelson BT, Bruder D, Hildner K, Buer J, Murphy KM, Reizis B, Jung S. CX3CR1+ CD8alpha+ dendritic cells are a steady-state population related to plasmacytoid dendritic cells. Proc Natl Acad Sci U S A. 2010;107:14745–14750. doi: 10.1073/pnas.1001562107. [DOI] [PMC free article] [PubMed] [Google Scholar]
- Beck K, Peak MM, Ota T, Nemazee D, Murre C. Distinct roles for E12 and E47 in B cell specification and the sequential rearrangement of immunoglobulin light chain loci. J Exp Med. 2009;206:2271–2284. doi: 10.1084/jem.20090756. [DOI] [PMC free article] [PubMed] [Google Scholar]
- Boos MD, Yokota Y, Eberl G, Kee BL. Mature natural killer cell and lymphoid tissue-inducing cell development requires Id2-mediated suppression of E protein activity. J Exp Med. 2007;204:1119–1130. doi: 10.1084/jem.20061959. [DOI] [PMC free article] [PubMed] [Google Scholar]
- Braunstein M, Anderson MK. Developmental progression of fetal HEB(−/−) precursors to the pre-T-cell stage is restored by HEBAlt. Eur J Immunol. 2010;40:3173–3182. doi: 10.1002/eji.201040360. [DOI] [PubMed] [Google Scholar]
- Ceribelli M, Hou ZE, Kelly PN, Huang DW, Wright G, Ganapathi K, Evbuomwan MO, Pittaluga S, Shaffer AL, Marcucci G, et al. A Druggable TCF4- and BRD4-Dependent Transcriptional Network Sustains Malignancy in Blastic Plasmacytoid Dendritic Cell Neoplasm. Cancer Cell. 2016;30:764–778. doi: 10.1016/j.ccell.2016.10.002. [DOI] [PMC free article] [PubMed] [Google Scholar]
- Chen WY, Zhang J, Geng H, Du Z, Nakadai T, Roeder RG. A TAF4 coactivator function for E proteins that involves enhanced TFIID binding. Genes Dev. 2013;27:1596–1609. doi: 10.1101/gad.216192.113. [DOI] [PMC free article] [PubMed] [Google Scholar]
- Cisse B, Caton ML, Lehner M, Maeda T, Scheu S, Locksley R, Holmberg D, Zweier C, den Hollander NS, Kant SG, et al. Transcription factor E2-2 is an essential and specific regulator of plasmacytoid dendritic cell development. Cell. 2008;135:37–48. doi: 10.1016/j.cell.2008.09.016. [DOI] [PMC free article] [PubMed] [Google Scholar]
- Corneliussen B, Thornell A, Hallberg B, Grundstrom T. Helix-loop-helix transcriptional activators bind to a sequence in glucocorticoid response elements of retrovirus enhancers. J Virol. 1991;65:6084–6093. doi: 10.1128/jvi.65.11.6084-6093.1991. [DOI] [PMC free article] [PubMed] [Google Scholar]
- Delmore JE, Issa GC, Lemieux ME, Rahl PB, Shi J, Jacobs HM, Kastritis E, Gilpatrick T, Paranal RM, Qi J, et al. BET bromodomain inhibition as a therapeutic strategy to target c-Myc. Cell. 2011;146:904–917. doi: 10.1016/j.cell.2011.08.017. [DOI] [PMC free article] [PubMed] [Google Scholar]
- Flora A, Garcia JJ, Thaller C, Zoghbi HY. The E-protein Tcf4 interacts with Math1 to regulate differentiation of a specific subset of neuronal progenitors. Proc Natl Acad Sci U S A. 2007;104:15382–15387. doi: 10.1073/pnas.0707456104. [DOI] [PMC free article] [PubMed] [Google Scholar]
- Forrest MP, Hill MJ, Quantock AJ, Martin-Rendon E, Blake DJ. The emerging roles of TCF4 in disease and development. Trends Mol Med. 2014;20:322–331. doi: 10.1016/j.molmed.2014.01.010. [DOI] [PubMed] [Google Scholar]
- Ghosh HS, Ceribelli M, Matos I, Lazarovici A, Bussemaker HJ, Lasorella A, Hiebert SW, Liu K, Staudt LM, Reizis B. ETO family protein Mtg16 regulates the balance of dendritic cell subsets by repressing Id2. J Exp Med. 2014;211:1623–1635. doi: 10.1084/jem.20132121. [DOI] [PMC free article] [PubMed] [Google Scholar]
- Ghosh HS, Cisse B, Bunin A, Lewis KL, Reizis B. Continuous expression of the transcription factor e2-2 maintains the cell fate of mature plasmacytoid dendritic cells. Immunity. 2010;33:905–916. doi: 10.1016/j.immuni.2010.11.023. [DOI] [PMC free article] [PubMed] [Google Scholar]
- Ginhoux F, Liu K, Helft J, Bogunovic M, Greter M, Hashimoto D, Price J, Yin N, Bromberg J, Lira SA, et al. The origin and development of nonlymphoid tissue CD103+ DCs. J Exp Med. 2009;206:3115–3130. doi: 10.1084/jem.20091756. [DOI] [PMC free article] [PubMed] [Google Scholar]
- Gloury R, Zotos D, Zuidscherwoude M, Masson F, Liao Y, Hasbold J, Corcoran LM, Hodgkin PD, Belz GT, Shi W, et al. Dynamic changes in Id3 and E-protein activity orchestrate germinal center and plasma cell development. J Exp Med. 2016;213:1095–1111. doi: 10.1084/jem.20152003. [DOI] [PMC free article] [PubMed] [Google Scholar]
- Grajales-Reyes GE, Iwata A, Albring J, Wu X, Tussiwand R, Kc W, Kretzer NM, Briseno CG, Durai V, Bagadia P, et al. Batf3 maintains autoactivation of Irf8 for commitment of a CD8alpha(+) conventional DC clonogenic progenitor. Nature immunology. 2015;16:708–717. doi: 10.1038/ni.3197. [DOI] [PMC free article] [PubMed] [Google Scholar]
- Guilliams M, Ginhoux F, Jakubzick C, Naik SH, Onai N, Schraml BU, Segura E, Tussiwand R, Yona S. Dendritic cells, monocytes and macrophages: a unified nomenclature based on ontogeny. Nat Rev Immunol. 2014;14:571–578. doi: 10.1038/nri3712. [DOI] [PMC free article] [PubMed] [Google Scholar]
- Guo C, Hu Q, Yan C, Zhang J. Multivalent binding of the ETO corepressor to E proteins facilitates dual repression controls targeting chromatin and the basal transcription machinery. Mol Cell Biol. 2009;29:2644–2657. doi: 10.1128/MCB.00073-09. [DOI] [PMC free article] [PubMed] [Google Scholar]
- Hacker C, Kirsch RD, Ju XS, Hieronymus T, Gust TC, Kuhl C, Jorgas T, Kurz SM, Rose-John S, Yokota Y, et al. Transcriptional profiling identifies Id2 function in dendritic cell development. Nature immunology. 2003;4:380–386. doi: 10.1038/ni903. [DOI] [PubMed] [Google Scholar]
- Ippolito GC, Dekker JD, Wang YH, Lee BK, Shaffer AL, 3rd, Lin J, Wall JK, Lee BS, Staudt LM, Liu YJ, et al. Dendritic cell fate is determined by BCL11A. Proc Natl Acad Sci U S A. 2014;111:E998–1006. doi: 10.1073/pnas.1319228111. [DOI] [PMC free article] [PubMed] [Google Scholar]
- Jackson JT, Hu Y, Liu R, Masson F, D’Amico A, Carotta S, Xin A, Camilleri MJ, Mount AM, Kallies A, et al. Id2 expression delineates differential checkpoints in the genetic program of CD8alpha+ and CD103+ dendritic cell lineages. EMBO J. 2011;30:2690–2704. doi: 10.1038/emboj.2011.163. [DOI] [PMC free article] [PubMed] [Google Scholar]
- Jones-Mason ME, Zhao X, Kappes D, Lasorella A, Iavarone A, Zhuang Y. E protein transcription factors are required for the development of CD4(+) lineage T cells. Immunity. 2012;36:348–361. doi: 10.1016/j.immuni.2012.02.010. [DOI] [PMC free article] [PubMed] [Google Scholar]
- Kamogawa-Schifter Y, Ohkawa J, Namiki S, Arai N, Arai K, Liu Y. Ly49Q defines 2 pDC subsets in mice. Blood. 2005;105:2787–2792. doi: 10.1182/blood-2004-09-3388. [DOI] [PubMed] [Google Scholar]
- Kee BL. E and ID proteins branch out. Nat Rev Immunol. 2009;9:175–184. doi: 10.1038/nri2507. [DOI] [PubMed] [Google Scholar]
- Lau CM, Nish SA, Yogev N, Waisman A, Reiner SL, Reizis B. Leukemia-associated activating mutation of Flt3 expands dendritic cells and alters T cell responses. J Exp Med. 2016;213:415–431. doi: 10.1084/jem.20150642. [DOI] [PMC free article] [PubMed] [Google Scholar]
- Merad M, Sathe P, Helft J, Miller J, Mortha A. The dendritic cell lineage: ontogeny and function of dendritic cells and their subsets in the steady state and the inflamed setting. Annu Rev Immunol. 2013;31:563–604. doi: 10.1146/annurev-immunol-020711-074950. [DOI] [PMC free article] [PubMed] [Google Scholar]
- Miller JC, Brown BD, Shay T, Gautier EL, Jojic V, Cohain A, Pandey G, Leboeuf M, Elpek KG, Helft J, et al. Deciphering the transcriptional network of the dendritic cell lineage. Nature immunology. 2012;13:888–899. doi: 10.1038/ni.2370. [DOI] [PMC free article] [PubMed] [Google Scholar]
- Mo A, Mukamel EA, Davis FP, Luo C, Henry GL, Picard S, Urich MA, Nery JR, Sejnowski TJ, Lister R, et al. Epigenomic Signatures of Neuronal Diversity in the Mammalian Brain. Neuron. 2015;86:1369–1384. doi: 10.1016/j.neuron.2015.05.018. [DOI] [PMC free article] [PubMed] [Google Scholar]
- Murre C. Helix-loop-helix proteins and lymphocyte development. Nature immunology. 2005;6:1079–1086. doi: 10.1038/ni1260. [DOI] [PubMed] [Google Scholar]
- Nagasawa M, Schmidlin H, Hazekamp MG, Schotte R, Blom B. Development of human plasmacytoid dendritic cells depends on the combined action of the basic helix-loop-helix factor E2-2 and the Ets factor Spi-B. Eur J Immunol. 2008;38:2389–2400. doi: 10.1002/eji.200838470. [DOI] [PubMed] [Google Scholar]
- Omilusik KD, Shaw LA, Goldrath AW. Remembering one’s ID/E-ntity: E/ID protein regulation of T cell memory. Curr Opin Immunol. 2013;25:660–666. doi: 10.1016/j.coi.2013.09.004. [DOI] [PMC free article] [PubMed] [Google Scholar]
- Onai N, Kurabayashi K, Hosoi-Amaike M, Toyama-Sorimachi N, Matsushima K, Inaba K, Ohteki T. A clonogenic progenitor with prominent plasmacytoid dendritic cell developmental potential. Immunity. 2013;38:943–957. doi: 10.1016/j.immuni.2013.04.006. [DOI] [PubMed] [Google Scholar]
- Redecke V, Wu R, Zhou J, Finkelstein D, Chaturvedi V, High AA, Hacker H. Hematopoietic progenitor cell lines with myeloid and lymphoid potential. Nat Methods. 2013;10:795–803. doi: 10.1038/nmeth.2510. [DOI] [PMC free article] [PubMed] [Google Scholar]
- Reizis B, Bunin A, Ghosh HS, Lewis KL, Sisirak V. Plasmacytoid Dendritic Cells: Recent Progress and Open Questions. Annu Rev Immunol. 2011 doi: 10.1146/annurev-immunol-031210-101345. [DOI] [PMC free article] [PubMed] [Google Scholar]
- Rothenberg EV. Transcriptional control of early T and B cell developmental choices. Annu Rev Immunol. 2014;32:283–321. doi: 10.1146/annurev-immunol-032712-100024. [DOI] [PMC free article] [PubMed] [Google Scholar]
- Satpathy AT, Wu X, Albring JC, Murphy KM. Re(de)fining the dendritic cell lineage. Nature immunology. 2012;13:1145–1154. doi: 10.1038/ni.2467. [DOI] [PMC free article] [PubMed] [Google Scholar]
- Schlitzer A, Loschko J, Mair K, Vogelmann R, Henkel L, Einwachter H, Schiemann M, Niess JH, Reindl W, Krug A. Identification of CCR9- murine plasmacytoid DC precursors with plasticity to differentiate into conventional DCs. Blood. 2011;117:6562–6570. doi: 10.1182/blood-2010-12-326678. [DOI] [PubMed] [Google Scholar]
- Schraml BU, Reis ESC. Defining dendritic cells. Curr Opin Immunol. 2015;32C:13–20. doi: 10.1016/j.coi.2014.11.001. [DOI] [PubMed] [Google Scholar]
- Scott CL, Soen B, Martens L, Skrypek N, Saelens W, Taminau J, Blancke G, Van Isterdael G, Huylebroeck D, Haigh J, et al. The transcription factor Zeb2 regulates development of conventional and plasmacytoid DCs by repressing Id2. J Exp Med. 2016;213:897–911. doi: 10.1084/jem.20151715. [DOI] [PMC free article] [PubMed] [Google Scholar]
- Sepp M, Kannike K, Eesmaa A, Urb M, Timmusk T. Functional diversity of human basic helix-loop-helix transcription factor TCF4 isoforms generated by alternative 5′ exon usage and splicing. PLoS One. 2011;6:e22138. doi: 10.1371/journal.pone.0022138. [DOI] [PMC free article] [PubMed] [Google Scholar]
- Shaw LA, Belanger S, Omilusik KD, Cho S, Scott-Browne JP, Nance JP, Goulding J, Lasorella A, Lu LF, Crotty S, et al. Id2 reinforces TH1 differentiation and inhibits E2A to repress TFH differentiation. Nature immunology. 2016;17:834–843. doi: 10.1038/ni.3461. [DOI] [PMC free article] [PubMed] [Google Scholar]
- Shih HY, Sciume G, Mikami Y, Guo L, Sun HW, Brooks SR, Urban JF, Jr, Davis FP, Kanno Y, O’Shea JJ. Developmental Acquisition of Regulomes Underlies Innate Lymphoid Cell Functionality. Cell. 2016;165:1120–1133. doi: 10.1016/j.cell.2016.04.029. [DOI] [PMC free article] [PubMed] [Google Scholar]
- Shortman K, Sathe P, Vremec D, Naik S, O’Keeffe M. Plasmacytoid dendritic cell development. Adv Immunol. 2013;120:105–126. doi: 10.1016/B978-0-12-417028-5.00004-1. [DOI] [PubMed] [Google Scholar]
- Skerjanc IS, Truong J, Filion P, McBurney MW. A splice variant of the ITF-2 transcript encodes a transcription factor that inhibits MyoD activity. J Biol Chem. 1996;271:3555–3561. doi: 10.1074/jbc.271.7.3555. [DOI] [PubMed] [Google Scholar]
- Swiecki M, Colonna M. The multifaceted biology of plasmacytoid dendritic cells. Nat Rev Immunol. 2015;15:471–485. doi: 10.1038/nri3865. [DOI] [PMC free article] [PubMed] [Google Scholar]
- Toyama-Sorimachi N, Omatsu Y, Onoda A, Tsujimura Y, Iyoda T, Kikuchi-Maki A, Sorimachi H, Dohi T, Taki S, Inaba K, et al. Inhibitory NK receptor Ly49Q is expressed on subsets of dendritic cells in a cellular maturation- and cytokine stimulation-dependent manner. J Immunol. 2005;174:4621–4629. doi: 10.4049/jimmunol.174.8.4621. [DOI] [PubMed] [Google Scholar]
- Victora GD, Nussenzweig MC. Germinal centers. Annu Rev Immunol. 2012;30:429–457. doi: 10.1146/annurev-immunol-020711-075032. [DOI] [PubMed] [Google Scholar]
- Wang D, Claus CL, Rajkumar P, Braunstein M, Moore AJ, Sigvardsson M, Anderson MK. Context-dependent regulation of hematopoietic lineage choice by HEBAlt. J Immunol. 2010;185:4109–4117. doi: 10.4049/jimmunol.0901783. [DOI] [PubMed] [Google Scholar]
- Wohner M, Tagoh H, Bilic I, Jaritz M, Poliakova DK, Fischer M, Busslinger M. Molecular functions of the transcription factors E2A and E2-2 in controlling germinal center B cell and plasma cell development. J Exp Med. 2016;213:1201–1221. doi: 10.1084/jem.20152002. [DOI] [PMC free article] [PubMed] [Google Scholar]
Associated Data
This section collects any data citations, data availability statements, or supplementary materials included in this article.