

Abstract
Intrinsic aerobic exercise capacity can influence many complex traits including obesity and aging. To study this connection we established two rat lines by divergent selection of untrained aerobic capacity. After 32 generations the high capacity runners (HCR) and low capacity runners (LCR) differed in endurance running distance and body fat, blood glucose, other health indicators, and natural life span. To understand the interplay among genetic differences, chronological age, and acute exercise we performed microarray-based gene expression analyses in skeletal muscle with a 2×2×2 design to simultaneously compare HCR and LCR, old and young animals, and rest and exhaustion. Transcripts for mitochondrial function are expressed higher in HCRs than LCRs at both rest and exhaustion and for both age groups. Expression of cell adhesion and extracellular matrix genes tend to decrease with age. This and other age effects are more prominent in LCRs than HCRs, suggesting that HCRs have a slower aging process and this may be partly due to their better metabolic health. Strenuous exercise mainly affects transcription regulation and cellular response. The effects of any one factor often depend on the other two. For example, there are ∼140 and ∼110 line-exercise “interacting” genes for old and young animals, respectively. Many genes highlighted in our study are consistent with prior reports, but many others are novel. The gene- and pathway-level statistics for the main effects, either overall or stratified, and for all possible interactions, represent a rich reference dataset for understanding the interdependence among lines, aging, and exercise.
Keywords: divergent selection, aerobic capacity, gene expression, aging, exercise
it has been increasingly recognized that exercise capacity, metabolism health, and the aging process are closely related with each other. In humans, the health and longevity benefits of an enhanced exercise capacity/Vo2 max have been demonstrated in numerous studies (2, 3, 9, 18, 28, 29, 31, 40, 46). However, the biological basis of interindividual variation of intrinsic exercise capacity is not clear, though a strong genetic component has been documented in both humans and animals (1, 4, 5). Another major unknown is how metabolism differences that underlie exercise capacity are linked to other health indicators such as resistance to obesity, improved insulin sensitivity, lower blood pressure, improved lipid parameters, and longevity. These phenotypes are of immense public health interest, as prevalence of diabetes, cardiovascular disorders, obesity, and metabolic syndrome is rising at an alarming rate. Compared with human studies, an animal model may confer the advantage of making it easier to disentangle the complex gene-environmental interactions (5, 34, 35). Toward this goal, we have established two lines of rat for studying aerobic exercise capacity and its impact on metabolic health (25, 37). The two lines, high-capacity runners (HCR) and low-capacity runners (LCR), have been selectively bred for high and low intrinsic exercise capacity, respectively. The selection was based on untrained aerobic capacity as measured by endurance running, as opposed to increased capacity after regular training, or performance based on muscle strength or short-term speed. The two lines were started from the same genetically heterogeneous population and have now diverged in exercise capacity and many other physiological measures, including weight, body composition, blood pressure, body mass index, lung capacity, and lipid and glucose metabolism (reviewed in Refs. 26, 51). As in humans, the enhanced running capacity of the HCR is paralleled by its longer lifespan, with the median age of death at 23.5 mo for LCRs and 30.1 mo for HCRs (27), a 28% difference in life expectancy. As such, the HCR and LCR animals have become a valuable model to study metabolic health. In as early as generation 7 of selection, HCR displayed significantly greater O2 utilization in the skeletal muscle (20). Continued selection to generation 15 resulted in further divergence in O2 utilization as well as O2 delivery in the skeletal muscle (21). A gene expression analysis of the skeletal muscle from HCR and LCR at generation 16 found that exercise-trained HCR had higher expression than exercise-trained LCR for genes involved in lipid metabolism and fatty acid elongation, while in untrained rats there were only minor differences between the two lines (7). Another study using 9 mo old rats at generation 18 revealed significant differences in genes involved in oxidative energy metabolism, including fat metabolism, branched-chain amino acid metabolism, Krebs cycle, and oxidative phosphorylation (24). The between-line differences in gene expression were consistent with results from proteomic analysis of skeletal muscle mitochondria, which showed similar pathways enriched in HCR (33).
It has long been appreciated that biological regulation, manifested in this case as transcript levels, is affected by inherited genetic variation, naturally occurring aging process, as well as responses to immediate physiological stressors. These factors often act jointly, but they have not been analyzed simultaneously in a single controlled study. Here we analyzed the transcriptomic profiles of both young and aged female rats from both lines and under either resting or exhausted conditions with the goal of identifying pathways that underlie the divergence in intrinsic aerobic capacity, the aging process, and the response to acute exercise.
MATERIALS AND METHODS
Ethics Statement
This study was approved by the University Committee on Use and Care of Animals, Ann Arbor, MI (approval numbers: 08905 and 03797). The animal use procedures are in compliance with University guidelines and State and Federal regulations.
Animals, Tissue, and RNA extraction
We used old (∼92–105 wk of age) and young (∼25–35 wk of age) rats from HCR and LCR generations 29 and 32, respectively. The reason for studying young animals in a later generation along with old animals in an earlier generation is to make all animals in the study contemporaneous: they were housed under the same conditions in the weeks leading up to the experiment, with the final exercise and tissue harvesting conducted under the same protocol, using the same personnel and reagents. The study included three binary factors and therefore eight groups; HCR-Old-Exhausted (H-O-E, n = 6), HCR-Old-Rest (H-O-R, n = 6), HCR-Young-Exhausted (H-Y-E, n = 6), HCR-Young-Rest (H-Y-R, n = 6), LCR-Old-Exhausted (L-O-E, n = 6), LCR-Old-Rest (L-O-R, n = 6), LCR-Young-Exhausted (L-Y-E, n = 6), and LCR-Young-Rest (L-Y-R, n = 6). Skeletal muscle tissue was obtained from the extensor digitorum longus (EDL). For the exhausted rats, dissections were performed within 10 min after the maximal running distance was reached. With such a short handling time we aim to capture the exhausted state for all transcripts except those that have changed at an even faster rate. All tissue samples were immediately weighed and snap frozen in liquid nitrogen, and stored at −80°C.
We extracted skeletal muscle total RNA from the 48 animals (n = 6 in each of the 8 groups) using Trizol reagent (Invitrogen, Carlsbad, CA). RNA was treated with DNase-free (Invitrogen) and cleaned up with RNeasy columns (Qiagen, Hilden, Germany).
Gene Expression Microarray Experiments
We analyzed the RNA samples on the Affymetrix Rat Gene ST 2.1 array. The labeling and microarray hybridizations were performed by the DNA sequencing Core at the University of Michigan according to the manufacturer's instructions. We used the Affymetrix Expression Console software to generate gene expression values for individual transcripts from the raw probe intensity (CEL) files. These transcripts were defined by clusters of probe sets. We relied on transcripts annotation from the Archived NetAffx Annotation Files for RaGene-2_1-st-v1, Release 33.2 (3/28/13). Out of the 36,685 transcripts, 19,607 had annotated gene symbols and were included in the analysis.
Study Design and Data Structure
Our study adopted a 2×2×2 full factorial design to examine simultaneously the effects of three binary factors: genetic lines (HCR-LCR), chronological age (Old-Young), exercise (Rest-Exhausted), and their interactions. The exercise factor refers to the response to one bout of endurance run, not the long-term adaptation to regular training nor the evolutionary response to multigeneration selection. Tissues from exhausted animals were obtained immediately (<10 min) after the run-to-exhaustion test. Young animals are from generation 32 and tested at the age of 31.6 ± 2.6 wk; and Old are from generation 29 and tested at 98.9 ± 3.1 wk. Among the young animals, HCRs and LCRs show 8.5-fold difference in their maximal running distance. Old animals have a ∼50% decline of performance in both lines, while maintaining the HCR-LCR difference at 8.9-fold (Supplemental Fig. S1).1 Despite the clear between-group difference in maximal running distance, there is not a significant within-group correlation between age and distance in any age-line combination (Supplemental Fig. S1). For three factors and two levels each, there are eight experimental groups. In each group we analyzed six female animals as biological replicates. In all, we analyzed 19,607 transcripts corresponding to known genes in 48 samples from a single batch of microarray experiments. The raw data and the processed data are available at the National Center for Biotechnology Information's Gene Expression Omnibus: http://www.ncbi.nlm.nih.gov/geo/query/acc.cgi?acc=GSE75629.
Gene Expression Data Analysis
Data processing and group notation.
Data analysis were performed in R (36). After log transformation, expression levels for 19,607 transcripts were normalized with quantiles normalization. Principal component analysis (PCA) was performed using the prcomp function. As a 2×2×2 design can be naturally displayed as a cube, we drew a hexahedron, i.e., an irregular, “stretched” cube, overlaid on the PCA plot in Fig. 1 to connect the median expression patterns of the eight groups. Note that this hexahedron in the reduced two-dimensional view is not a precise representation of the distances between high-dimension gene expression profiles but can be considered as a useful illustration of the relationships among the experimental groups and, in a semiquantitative fashion, their relative distances to each other. This representation has six quadrilateral faces (or planes) forming three opposing pairs, each representing the two levels of a given factor. For example, the left and right faces represent the Old and Young animals, respectively, whereas the top and bottom faces represent Exhausted and Rest groups, respectively. The eight corners (nodes) represent the centroids of the eight experimental groups, and the 12 edges represent the 12 two-way contrasts, each representing the main effect of a given factor in one of the four strata formed by the other two factors. Group name abbreviations and edge numbers are provided in the legend to Fig. 2.
Fig. 1.
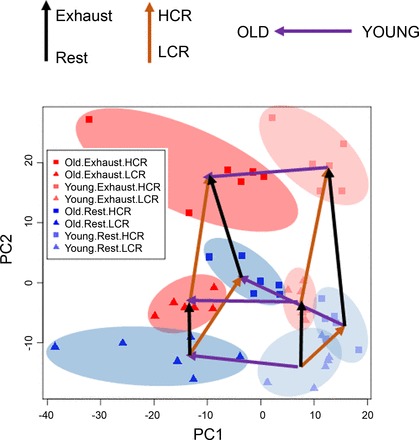
Principal component analysis plot (PC1 vs. PC2) for 48 samples using the expression levels of 19,607 transcripts. The different symbols mark the 8 known groups in the 2×2×2 design for high-capacity runners (HCR) and low-capacity runners (LCR), aged and young, and rest and exhausted (n = 6 each). HCR-LCR are shown as squares and triangles, respectively. Exhausted animals are in red, and animals at rest are in blue. Old animals are shown as dark red/blue, and young animals are shown as light red/blue. Clusters are also highlighted using different colored ovals. Arrows are drawn to show the direction of comparison; purple arrows for old-young animals; orange arrows for HCR-LCR; and black arrows for exhausted-rest. PC1 is mainly driven by the Old-Young differences, while PC2 is driven by HCR-LCR and exercise effects.
Fig. 2.
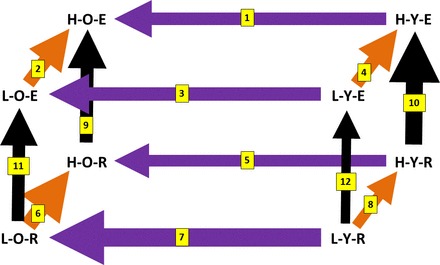
Graphic representation of the sample groups and their distances. Each group is represented by their abbreviated names (HCR/LCR = H/L, old/young = O/Y, exhausted/rest = E/R). The color scheme for the edges/arrows is the same as Fig. 1. The numbers on each arrow denote the 2-way comparison (between 1 and 12) that will be referred to in the main text, and the thickness of each arrow is proportional to the Euclidean distance (see materials and methods) between the pair of groups. The numeric values of the distance are shown in Supplemental Fig. S2.
The Euclidean distance between clusters was calculated with the dist function using the median expression values of each cluster. Alternative distance measures, such as the median absolute difference (MAD) between pairs of group centroids, yield similar results: the Pearson's correlation coefficient (r) between MAD and Euclidean values is 0.91 across the 12 stratified pairwise comparisons (see below).
Differential expression analysis.
Statistical significance of gene expression differences between test groups were calculated using linear regression with the lm function.
For the main effect analyses, we implemented the following multiple regression model: exp ∼ line + age + exercise, which identifies genes with overall main effects for each of the three factors.
We also implemented the “full model” that included three two-way interaction effects: exp ∼ line + age + exercise + line*age + line*exercise + age*exercise.
To curate finer-granule summary statistics we also analyzed the main effect of each factor within each of the four strata formed by the two other factors. The led to the following 12 stratified analyses: exp ∼ line (for old and exhausted, edge 2; “edge” is explained below and in Fig. 2); exp ∼ line (for young and exhausted; edge 4); exp ∼ line (for old and rest, edge 6); exp ∼ line (for young and rest, edge 8); exp ∼ age (for HCR and exhausted, edge 1); exp ∼ age (for LCR and exhausted, edge 3); exp ∼ age (for HCR and rest, edge 5); exp ∼ age (for LCR and rest, edge 7); exp ∼ exercise (for HCR and old, edge 9); exp ∼ exercise (for HCR and young, edge 10); exp ∼ exercise (for LCR and old, edge 11), exp ∼ exercise (for LCR and young, edge 12).
Last, to analyze the two-way interaction effect within each level of the third factor, we implemented the following six regression models: exp ∼ line + age + line*age (for exhausted, top plane of the cube in Fig. 2); exp ∼ line + age + line*age (for rest, bottom); exp ∼ line + exercise + line*exercise (for old, left); exp ∼ line + exercise + line*exercise (for young, right); exp ∼ age + exercise + age*exercise (for HCR, back); exp ∼ age + exercise + age*exercise (for LCR, front).
For each analysis we collected effect size, P value and the Benjamini-Hochberg false discovery rate (BH-FDR) for every gene. Note that the models described above are often nested and should not be considered as testing mutually independent models.
Pathway Analysis
Pathway enrichment analysis was performed using LRpath (41) using P values and fold-change for all 19,607 transcripts. We tested for enrichment of Gene Ontology (GO) terms and Kyoto Encyclopedia of Genes and Genomes (KEGG) pathways for the rat. LRpath allows both unidirectional and directional analyses. For unidirectional analysis, LRpath identifies gene sets that show enrichment among genes with smaller P values, without distinguishing the up- and downregulated genes; for directional analysis, LRpath identifies enrichment for up- and downregulated genes separately, using both P values and direction of fold-change between the test group and the reference group.
Since LRpath returns thousands of pathway names and associated enrichment scores, it is often difficult to determine how many distinctive biological themes are represented by, say, the top 100 significant pathways. To address this we used GOrilla (14) to visualize the pathways with enrichment P < 0.001 as well as their known parent-child relationships. This allowed us to recognize discrete gene ontology clusters formed by the significant pathways that represent similar concepts.
RESULTS
Global Patterns: Robust Effects of All Three Factors
A PCA of the 19,607 transcripts separates the 48 samples into eight clusters in the PC1-PC2 space, and they correspond remarkably well to the eight known groups, as shown by the colored ellipsoids (Fig. 1). The eight clusters occupy mostly nonoverlapping zones in the PC1-PC2 space. While a few of the clusters are close to each other, most are “coherent” and have gaps of varying sizes to the nearest neighboring cluster. This pattern is consistent with the regression results described below showing that there are statistically robust differential expression for many genes for each of the three factors.
The eight clusters form a well-proportioned convex cube, indicating that the line, age, and exercise effects are comparable in magnitude at the transcriptome-wide level. However, the effects are not strictly additive, i.e., independent of each other. If they were, all six faces would be formed by parallel edges of equal lengths, and the opposing faces would form parallel planes. On the contrary, the observed hexahedron contains unparalleled faces and unparalleled edges, and in most faces, the opposing edges are of unequal length, indicating that the effect of one factor often depends on the specific combination of the other two factors. This is a classic example of statistical interaction. The strata-specific contrasts can also be seen in Fig. 2, where we varied the line widths to be proportional to the genomic distance. Our simultaneous analyses of the three factors thus revealed both main effects and their interactions. In the following we will describe the analysis of the three factors, the pathway-level signals, and between-factor interactions.
Between-line Differences (HCR vs. LCR)
For each gene we assessed the overall “line effect,” as defined by the gene expression differences between HCR and LCR, combining Old-Young and Rest-Exhausted groups. In the graphic representation (Fig. 1) this corresponds to the distance between the center of the HCR face (the back plane of the cube) to the center of the LCR face (front plane). The effect reflects the transcriptomic consequence after >30 generations of divergent selection for aerobic running capacity.
The fold change and P value for 19,607 genes are provided in Supplemental File S1, which contains results for all three overall main effects and the 12 stratified analysis that we will describe below. In all, 2,838 transcripts are significantly different between HCR and LCR at BH-FDR < 0.05. Adding the criterion of at least 50% fold-change on the linear scale resulted in 127 genes, as shown in the heatmap in Fig. 3 (described in more details below).
Fig. 3.
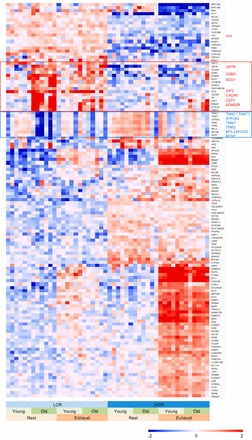
Expression patterns for genes with the largest HCR-LCR differences. Shown is the heatmap for 127 genes with the largest overall “line” effect, defined as false discovery rate (FDR) < 0.05 and > 50% fold-change in either direction in the comparison of 24 HCR and 24 LCR animals. The color scale of (−2, 2) is for log2 expression levels, corresponding to 0.25-fold to 4-fold in the linear scale. Every gene is median centered across the 48 samples. Expression values >4-fold or <0.25-fold are truncated to 4- and 0.25-fold, respectively. The 48 samples are ordered by the 8 groups as indicated at bottom. The 127 genes are ordered by unsupervised hierarchical clustering. Similar results for Age and Exercise effects are showing in Supplemental Figs. S4 and S5.
The pathway enrichment odds ratio, P value, and FDR for 4,146 GO and KEGG terms are included in Supplemental File S2, for all main-effect and interaction analyses. At the pathway level, the line effect implicates 289 GO or KEGG terms at BH-FDR < 0.05. Such a long list of biological terms would be difficult to interpret if presented as a table. But since many of the GO terms are related concepts, we used GOrilla to display the hierarchical structure of the most significant terms (P < 0.001), and this led to a much smaller number of clusters of related pathways. Figure 4 shows the GO biological processes affected, highlighting fatty acid oxidation, carboxylic acid metabolic process, and mitochondrial respiratory chain as major gene sets showing higher expression in HCR than in LCR. We extracted the most representative pathway clusters from Supplemental File S2 and displayed them in Supplemental Table S1 (for both log P values and odds ratios).
Fig. 4.
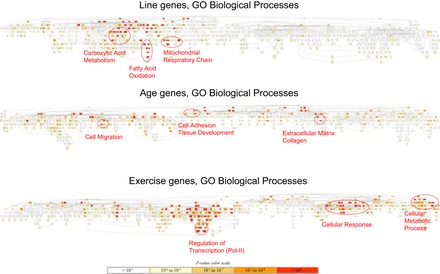
Biological processes affected by the line, age, and exercise main effects. Shown are the hierarchical structure of Gene Ontology (GO) terms for biological processes that satisfy P < 10−3 in the enrichment analysis by GOrilla. Colored in red are the most significant GO terms. Clusters of related terms are highlighted by the red ovals.
The line genes shown in Fig. 3 were ordered by unsupervised clustering, with the top portion showing genes with higher expression in LCR, and lower portion showing those higher in HCR. Immediately notable in this heatmap is that not all genes are uniform among the HCRs or among the LCRs. Rather, there is strong heterogeneity between the old and young animals and/or between the Rest and Exhausted groups, a direct demonstration of the interaction effects. For example, the lowest ⅓ of the heatmap are genes with higher expression in HCR, but their differences are mainly driven by the exhausted animals, both old and young.
The between-group heterogeneity as shown in Fig. 3 motivated us to analyze the HCR-LCR line effects separately within each of the four age-exercise combinations. Across the four strata, Old-Rest has the largest gene-level contrasts, while Young-Rest has the smallest (Fig. 2 and Supplemental Fig. S2a). This can be interpreted from two perspectives. First, the HCR-LCR difference at rest is age dependent: the lengths of edge 6 and edge 8, defined as Euclidean distance over all measured genes, are 36.6 and 29.2, respectively, indicating a stronger between-line difference in the old animals (Supplemental Fig. S2a). Compared with Rest, this age dependence of line effect is much reduced at Exhausted: the lengths of edge 4 and edge 2 are 32.9 and 33.4, respectively, nearly the same between the old and young animals. From the second but equivalent perspective, the HCR-LCR difference for young animals depends on the exercise state: it is greater at Exhausted (edge 4 vs. edge 8, 32.9 vs. 29.2), but it is reversed for old animals, for which the HCR-LCR difference is greater at Rest (edge 2 vs. edge 6, 33.4 vs. 36.6). At the pathway level the patterns are largely consistent across the four strata (Supplemental Table S1, Supplemental File S2), although the magnitude of enrichment can be different in different strata.
For example, we took the between-line differences in the young animals at rest (edge 8, or E8) as the baseline Line effect between HCR and LCR, and ask how such baseline HCR-LCR differences are affected by the other two factors (as represented by edge 6, edge 4, and edge 2). The comparison of per-gene fold-change between E8 and E6, E4, and E2 in qqplot shows that the line difference in the young rest animals (E8) has smaller fold-changes (Supplemental Fig. S3a), and fewer significant genes (Supplemental Fig. S3b) than in any of the other three strata that involve age (E6), exercise (E4), or both (E2). This suggests that aging and exercise would augment the overall HCR-LCR line difference at the gene level. However, the analogous comparison at the pathway level shows that baseline differences in the young rest animals (E8) have larger pathway odds ratios (Supplemental Fig. S3c) and more significant terms (Supplemental Fig. S3d) than the other three comparisons (E6, E4, E2). Thus the baseline HCR-LCR differences demonstrate more concentrated pathway effects, which then become more diffused in aged animals or after exercise.
Some notable genes are significantly different between the lines (Fig. 3, Supplemental File S1). Both H19 and insulin-like growth factor 2 (IGF2) are reduced by > 50% in the HCR vs. LCR in both old and young and both Exhausted and Rest groups. H19 is highly imprinted: it is expressed from the maternal allele in embryos but is silenced in all tissues in adult animals with the exception of skeletal muscle (22). Disruption of H19 in myoblasts reduces differentiation in vitro, and knockout of H19 reduces the repair of skeletal muscle following injury (13) and this appears to be dependent on two conserved microRNAs, miR-675-3p and miR-675-5p, expressed from exon 1 of H19 (13). Female rats were used in the present study, but we have observed similar reduction in IGF2 and H19 mRNA in male rats (not shown). Aldo-keto reductase family 1, member B10 (AKR1B10) is also expressed lower in HCR compared with LCR, especially following exercise, with a more than twofold difference for both old and young. AKR1B10 has been implicated in cancer cell growth and the reduction of lipid peroxidation via its NAD(P)H-dependent aldo-keto reductase. It promotes lipid synthesis and helps to protect cancer cells against apoptosis and oxidative stress, specifically lipid peroxidation (48). The HCR has a higher preference to use fatty acids as fuel during exercise compared with the LCR, and potentially the partitioning of lipid to storage or oxidation by AKR1B10 could influence fuel utilization.
While most of the line genes are not changed during aging, an interesting subset of them shows age-dependent changes in LCR but has little or no change in HCR. The genes upregulated in older LCR include proteases (GZMC and CST7, highlighted in Fig. 3 and Supplemental Fig. S4) as well as metabolism/inflammatory receptors and downstream factors (OSTN, IGF2, SCD1, EDA2R, and CXCR6). The OSTN/Musclin gene is of particular interest: it produces the secreted protein Musclin, which is enriched in fast-twitch, glycolytic muscle and increases lipolysis in adipose tissue by interaction with the atrial natriuretic peptide receptor (42). Disruption of the OSTN gene in mice reduces musclin secretion and results in reduced mitochondrial biogenesis and lower exercise tolerance, which can be reversed by administration of recombinant Musclin protein (44). The reason for baseline HCR/LCR difference in expression of OSTN/MUSCLIN and its age-dependent increase in LCR is unclear but could be related to age-dependent changes in fiber types or a compensatory change due to disrupted musclin signaling.
Transcripts associated with tropomyosin dominate the cluster of line genes downregulated in aged LCR but less affected in aged HCR (Fig. 3) and include troponin subunits (TNNC1, TNNT, TNNT1) and proteins associated with stimulation-induced calcium release and activation of the muscle contractile apparatus (ATP2A2, TPM3, MYL3, MYOZ2, and MYH7). Age-related decline in skeletal muscle contractile activity and in stimulation-associated calcium release is a hallmark feature of the sarcopenia of aging (45). As will be seen below, cell-cell interaction and focal adhesion complex pathways also show decline with age, with a greater effect in the LCR than HCR during the same chronological age span.
Many genes that capture the intrinsic physiological difference between HCR and LCR in our dataset are consistent with the reported molecular markers of aerobic capacity. For example (the statistics for these results have been extracted from Supplemental File S1 and included in Supplemental Table S2), carnitine palmitoyltransferase 1 (CPT1) is a key regulatory enzyme in fatty acid oxidation. In our study, CPT1A (P = 0.004) and CPT1B (P = 9.1E-7) show higher expression in HCR than LCR. Hénique et al. (19) reported that overexpression of a mutant CPT1 in mouse tibialis anterior induced tissue remodeling that mimicked exercise-induced oxidative phenotype, with increased percentage of oxidative fibers, higher glycogen content, and higher capillary-to-fiber density. A similar trend is seen for Sirtuin 1 (SIRT1), which is the mammalian ortholog of the yeast NAD+-dependent protein deacetylase Sir2 (silent information regulator 2). While SIRT1 is not on the microarray we used, all the other six SIRT genes, SIRT2–SIRT7, are more highly expressed in HCR than LCR, and three of them are significant: SIRT3 (P = 0.0085), SIRT4 (P = 0.0009), SIRT5 (P = 1.1E-5). SIRT1 is a metabolic sensor and regulator in skeletal muscle. A SIRT1 transgenic mouse model exhibits a fast-to-slow muscle fiber shift, increased expression of PGC-1α, higher oxidative metabolism and mitochondrial biogenesis, and increased expression of utrophin (UTRN) (8). These are HCR-like traits, as we found that UTRN is higher in HCR than LCR (P = 2.5E-7) and is decreased with age (P = 0.00016). In contrast, dystrophin (DMD) is increased with age (P = 3.7E-12). PGC-1α (PPARGC1A) is higher in HCR, but without reaching statistical significance (P = 0.077). However, PPARA, PPARD, PPARG, and PPARGC1B are all increased in HCR. Of these, PPARA (P = 4.4E-7) and PPARD (P = 0.0034) are significantly higher in HCR and are significantly decreased with age (PPARA, P = 2.9E-4; PPARD, P = 3.6E-5).
For mitochondrial function, the HCR-LCR difference is highly coherent: 50 of 51 transcripts for the NADH dehydrogenase (Ubiquinone) complex proteins (gene symbol NDUF*) are higher in HCR; nearly half of them (24/51) show P < 0.001. Intravenous injection of recombinant mitochondrial transcription factor A (TFAM) improved mitochondrial respiration in mouse brain, heart, and muscle (47). We found that TFAM is higher in HCR (P = 0.0039), as well as in older age (P = 0.0019). Last, disruption of the nuclear factor erythroid 2-like 2 (Nrf2 or NFE2L2) leads to accelerated apoptosis and skeletal muscle degeneration (32). Our study showed that NFE2L2 is expressed higher in HCR (P = 0.00096).
Age-related Effects (Old vs. Young)
The Old-Young main effect, assessed by combining HCR-LCR and Exhausted-Rest conditions, corresponds to the distance between the center of the Old face (left plane of the cube) to the center of the Young face (right plane). The effect size reflects the transcriptomic changes during the aging process, which is defined in our study over a specific span of chronological age (from 31.6 ± 2.6 wk to 98.9 ± 3.1 wk) for both HCR and LCR. This is different from the alternative study design that relies on biological age, as measured by some biological markers. In all, 2,561 genes are significantly difference between Old and Young at BH-FDR < 0.05 (Supplemental File S1). Adding the criterion of at least 60% difference on the linear scale reduced this number to 123. The expression values for these 123 genes over 48 animals are shown in the heatmap in Supplemental Fig. S4. At the very top are genes with the highest differential expression in older animals than the young: keratocan (KERA), angiopoietin-like 7 (ANGPTL7), chondroadherin (CHAD), and fibromodulin (FMOD), which are all related to extracellular matrix.
As in Fig. 3, we observed strong group-specific effects. For example, the lower ⅓ of the heatmap are genes with higher expression in older animals, but more than half of these genes showed a particularly strong effect in the LCR animals at rest. Motivated as before, we analyzed the Old-Young difference separately for each of the four line-exercise combinations. Across the four strata, LCR-Rest has the largest age contrast, whereas HCR-Rest has the smallest (Fig. 2 and Supplemental Fig. S2b). At Rest, the Old-Young effect is line dependent: the lengths of edge 5 and edge 7 are 31.0 and 39.1, respectively, indicating a stronger age difference in the LCR animals (Supplemental Fig. S2b). This line dependence of age effect is much reduced when measured at exhausted: the lengths of edge 1 and edge 3 are 32.4 and 33.8, respectively. In an alternative view, for HCR the Old-Young difference is slightly greater for exhausted animals (edge 1 vs. edge 5, 32.4 vs. 31.0), but conversely, for LCR the age difference is greater for Rest animals (edge 3 vs. edge 7, 33.8 vs. 39.1). In all, these results show that LCR has a stronger aging effect than HCR, especially at rest.
For the age effect, old rats consistently show downregulation in extracellular matrix, collagen, and cell adhesion pathways compared with the young (Fig. 4). Furthermore, aging in LCR (E3 and E7) results in more significant enrichment for these pathways compared with HCR (E1 and E5) (Supplemental Table S1). We also compared the pathway signals between line and age. The top pathways affected by the baseline line effect (E8) are not significantly affected by the age effect, whereas the top age pathways are moderately affected by the E8 baseline line effect (Fig. 5A, Supplemental Table S1) and not affected by the exercise effect (Supplemental Table S1).
Fig. 5.
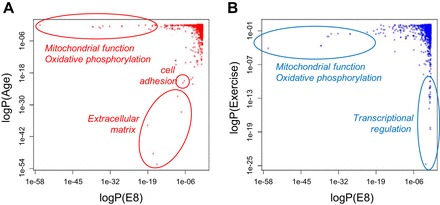
Comparison of most significant pathways among line, age, and exercise effects. Shown are scatter plots of logP values for 4,146 GO and KEGG terms for E8 (line effect for the rest young animals) vs. Age effect (A) and E8 vs. Exercise effect (B). Notable top pathways are highlighted.
For the aging effect, we conducted a systematic comparison with a meta-analysis of gene expression changes associated with aging in human skeletal muscle (43). Of the 957 genes published in that study, there is no overall concordance of aging effect as seen in our study (Supplemental Fig. S6). However, growth arrest and DNA damage-inducible alpha (GADD45A) is significantly increased with age in both studies (P = 0.00096 in our study). The transferrin receptor (TFRC) is significantly decreased in both (P = 4.9E-15 in our study), consistent with a third study reporting that it is downregulated during aging and is related to the rise of nonheme iron in the skeletal muscle of aging rats (11). A notable discrepancy is seen for the D site of albumin promoter (albumin D-box) binding protein (DBP), which is significantly increased in our study (P = 1.3E-8), but moderately decreased in Su et al. (43).
Autophagy-related genes, such as the microtubule-associated protein 1 light chain 3 alpha and beta (MAP1LC3A and MAP1LC3B) and the lysosomal-associated membrane protein 1 (LAMP1), are reduced with age in mouse EDL (23). We found that all three of these genes are significantly higher in HCR (MAP1LC3A, P = 4.3E-06; MAP1LC3B, P = 7.5E-05; LAMP1, P = 2.7E-05; Supplemental Table S2), consistent with HCR's apparent younger biological age. However, other autophagy genes such as Beclin 1 (BECN1) and autophagy related 7 (ATG7) are not significantly changed for either the line or the age effect (Supplemental File S1). Autophagy is critical for the removal of damaged proteins and the metabolic health of skeletal muscle. Part of the autophagic process is the turnover of mitochondria, resulting in improved mitochondrial function (38, 39). It is stimulated by exercise (16, 49). Sarcopenia of aging involves an imbalance between protein synthesis and autophage-mediated protein turnover (15).
Exercise Effects (Exhausted vs. Rest)
We assessed the Exhausted-Rest main effect, averaged over the HCR-LCR and Old-Young conditions. This corresponds to the distance between the center of the Exhausted face (top plane of the cube) to the center of the Rest face (bottom plane). The effect size reflects the transcriptomic response after a single bout of endurance run. In all, 1,715 transcripts are significantly difference at BH-FDR < 0.05 (Supplemental File S1). Adding the criterion of at least 50% difference on the linear scale reduced this number to 102. The expression values for these 102 genes over 48 animals are shown in the heatmap in Supplemental Fig. S5. The lower half of the heatmap is for genes with increased expression at exhaustion, and these are mainly driven by the intense effects in HCRs, for both old and young.
We analyzed the Exhausted-Rest difference separately for each of the four line-age combinations. Across the four strata, HCR-Young (E10) has the largest contrasts, whereas LCR-Young has the smallest. At Young age, the exercise effect is line dependent: the lengths of edge 10 and edge 12 are 38.0 and 28.4, respectively, indicating a larger exercise difference in the HCR animals (Fig. 2 and Supplemental Fig. S2c), which likely reflects the stronger exercise-related stimulus in the HCR due to their longer running distance and duration. This line dependence of exercise effect is much reduced when measured in old animals: the lengths of edge 9 and edge 11 are 33.1 and 32.5, respectively. In an alternative view, the age dependence of exercise effect varies by line: in HCR the impact of exercise is greater for young animals (edge 10 vs. edge 9, 38.0 vs. 33.1); but conversely, in LCR the exercise difference is greater for old animals (edge 11 vs. edge 12, 32.5 vs. 28.4).
For the exercise effect, exhausted rats consistently show upregulated transcriptional regulation and cellular response pathways compared with rats at rest (Fig. 4). These pathway effects are stronger for the young (E10, E12) than for the old rats (E9, E11) (Supplemental Table S1). We compared the pathway signals between exercise and the other factors. Some of the top line pathways (e.g., mitochondrial respiratory chain) are moderately significant for the exercise effect (Fig. 5B and Supplemental Table S1). Conversely, the top exercise pathways are not affected by line (Fig. 5B and Supplemental Table S1), but some (e.g., negative regulation of cellular metabolic processes) are moderated affected by age (Supplemental Table S1).
Previous studies have shown that the matrix metallopeptidases (MMPs) are important for skeletal muscle remodeling (50) and are increased after intense exercise training (12). Our study showed that at least two of the MMPs are significantly decreased with age (MMP2, P = 8.9E-11; MMP14, P = 6.4E-07; Supplemental Table S2). A previous study found that the Toll-like receptor 4 (TLR4) was downregulated after muscle exercise (30), and another found that TLR4 is increased in older humans but unchanged by exercise (17). Our study found that TLRs were not significantly altered by exercise, but many were consistently lower in older rats: of the 12 TLRs, the six with the smallest P values all show reduced levels with age (the 4 most significant TLRs are: P = 0.00011, 0.00020, 0.00047, 0.012 for TLR4, TLR5, TLR3, and TLR7, respectively).
Interaction Effects
Other than stratified analyses, we performed regression analysis again in a “full model” (see materials and methods), incorporating the three main effects as well as the three two-way interaction effects. The summary statistics (effect size and P values) are provided in Supplemental File S3. One way to make the best use of these data is to be cautious when interpreting a gene with a significant main effect if it also has a significant interaction effect: the latter means that the main effect is uneven across the four strata and warrants closer evaluation within each strata. To facilitate this type of data mining, we not only curated the 12 stratified analyses but also calculated the two-way interaction effects within each strata (formed by the third factor) and provide summary statistics in the last six columns of Supplemental Files S1 and S2. At the threshold of P < 0.001, the number of significant interaction genes are 15, 67, 141, 113, 79, and 60 genes for the top, bottom, left, right, front, and back analysis, respectively, with the middle two comparisons showing the largest effect. At the threshold of FDR < 0.1 the trend is similar, with 0, 2, 56, 64, 1, 1 genes in the six comparisons, again with the left-Old and right-Young showing the greatest number of significant interactions.
DISCUSSION
In this study we analyzed the effects of line, age, and exercise on rat skeletal muscle gene expression levels. The designation of the three factors represents a simplified view of the complex underlying phenotypes. For example, the two lines are divergent in blood pressure, body mass index, lung capacity, lipid and glucose metabolism, etc. Thus “line” represents many such correlated traits. Likewise “age” is a surrogate binary variable for many age-related factors.
Our results show that the HCR-LCR difference is most prominent in the mitochondrial and oxidative phosphorylation pathways during both exercise and rest. Genes in these pathways are expressed significantly higher in HCR, as has been previously reported (24). We have recently found that the upregulation of these pathways increases the capacity for nonglucose fuel utilization in the HCR rats, delaying the “lactate threshold” associated with glycolysis-mediated ATP production (33).
The old-young difference is driven by the extracellular matrix, collagen, and adhesion pathways. The effects are more pronounced in LCRs than HCRs, during both exercise and rest (Supplemental Table S1, Supplemental Fig. S2b). This reflects a relative slowing of aging in HCR and is consistent with the reported longevity difference between HCR and LCR (27). The collagen-related pathways are downregulated in the old rats compared with the young rats. This finding is similar to those from a previous meta-analysis across humans and rodents showing that collagen gene sets show lower expression with older age (10). Between the exhausted and rest rats, the difference is greatest for the young HCRs, and smallest for young LCRs (Supplemental Fig. S2C). These differences in HCR and LCR may simply be attributable to the longer running distance in the HCRs (37).
The gene and pathway results in Supplemental Files S1–S3 can be used as a reference resource for further exploration. First, one can look up specific genes or pathways of interest. For example, we highlighted CPT1, SIRT, UTRN, DMD, PGC-1α, TFAM, NFE2L2, and NDUF genes for their reported line effects; MAP1LC3A, LAMP1, and other autophagy-related genes in aging; and MMP and TLR genes for exercise effects (see results above and Supplemental Table S2).
Second, one can compare any two of the four stratified line effects to find the genes or pathways that are different between HCR and LCR either consistently across strata or inconsistently depending on age or exercise. The comparison among E2-E4-E6-E8 described earlier (Supplemental Fig. S3) is one such example. Together, these examples illustrate the abundant connections between our study and prior literature and the value of our new results as a reference resource for systematic analyses of aging and exercise effects in human and rodent models.
Since we focused on a fast-twitch muscle (i.e., EDL) and a single bout of endurance run, future studies are needed to expand the research to slow-twitch muscles, other organ systems such as heart and liver, and to long-term exercise training, including high-intensity runs and resistance training. Furthermore, we expect that such a factorial study design can be extended to studying the epigenomic changes, the metabolome, and additional experimental factors such as caloric restriction.
GRANTS
This work was supported by a New Scholar in Aging award (J. Z. Li) from the Ellison Medical Foundation, National Institutes of Health (NIH) Office of Research Infrastructure Programs Grant P40OD021331 (to L. G. Koch and S. L. Britton), the Michigan Nutrition Obesity Research Center (P30 DK-089503), and NIH Grant RO1 DK-099034.
DISCLOSURES
No conflicts of interest, financial or otherwise, are declared by the author(s).
AUTHOR CONTRIBUTIONS
Y.-y.R., L.G.K., S.L.B., N.R.Q., M.K.T., C.F.B., and J.Z.L. conception and design of research; Y.-y.R., L.G.K., S.L.B., N.R.Q., M.K.T., and C.F.B. performed experiments; Y.-y.R., C.F.B., and J.Z.L. analyzed data; Y.-y.R., C.F.B., and J.Z.L. interpreted results of experiments; Y.-y.R. and J.Z.L. prepared figures; Y.-y.R. and J.Z.L. drafted manuscript; Y.-y.R., L.G.K., S.L.B., C.F.B., and J.Z.L. edited and revised manuscript; Y.-y.R., L.G.K., S.L.B., N.R.Q., M.K.T., C.F.B., and J.Z.L. approved final version of manuscript.
Supplementary Material
ACKNOWLEDGMENTS
We thank Drs. Katherine Overmyer and Charles Evans for assistance in performing the tissue dissection and for helpful discussions. We thank Lori Heckenkamp and Shelby Raupp for expert care of the rat colony and the Department of Anesthesiology, University of Michigan, for support.
Footnotes
The online version of this article contains supplemental material.
REFERENCES
- 1.Barbato JC, Koch LG, Darvish A, Cicila GT, Metting PJ, Britton SL. Spectrum of aerobic endurance running performance in eleven inbred strains of rats. J Appl Physiol 85: 530–536, 1998. [DOI] [PubMed] [Google Scholar]
- 2.Blair SN, Kampert JB, Kohl HW 3rd, Barlow CE, Macera CA, Paffenbarger RS Jr, Gibbons LW. Influences of cardiorespiratory fitness and other precursors on cardiovascular disease and all-cause mortality in men and women. JAMA 276: 205–210, 1996. [PubMed] [Google Scholar]
- 3.Blair SN, Kohl HW 3rd, Paffenbarger RS Jr, Clark DG, Cooper KH, Gibbons LW. Physical fitness and all-cause mortality A prospective study of healthy men and women. JAMA 262: 2395–2401, 1989. [DOI] [PubMed] [Google Scholar]
- 4.Bouchard C, Rankinen T, Chagnon YC, Rice T, Perusse L, Gagnon J, Borecki I, An P, Leon AS, Skinner JS, Wilmore JH, Province M, Rao DC. Genomic scan for maximal oxygen uptake and its response to training in the HERITAGE Family Study. J Appl Physiol 88: 551–559, 2000. [DOI] [PubMed] [Google Scholar]
- 5.Bray MS. Genomics, genes, and environmental interaction: the role of exercise. J Appl Physiol (1985) 88: 788–792, 2000. [DOI] [PubMed] [Google Scholar]
- 7.Bye A, Hoydal MA, Catalucci D, Langaas M, Kemi OJ, Beisvag V, Koch LG, Britton SL, Ellingsen O, Wisloff U. Gene expression profiling of skeletal muscle in exercise-trained and sedentary rats with inborn high and low V̇o2 max. Physiol Genomics 35: 213–221, 2008. [DOI] [PMC free article] [PubMed] [Google Scholar]
- 8.Chalkiadaki A, Igarashi M, Nasamu AS, Knezevic J, Guarente L. Muscle-specific SIRT1 gain-of-function increases slow-twitch fibers and ameliorates pathophysiology in a mouse model of Duchenne muscular dystrophy. PLoS Genet 10: e1004490, 2014. [DOI] [PMC free article] [PubMed] [Google Scholar]
- 9.Church TS, Cheng YJ, Earnest CP, Barlow CE, Gibbons LW, Priest EL, Blair SN. Exercise capacity and body composition as predictors of mortality among men with diabetes. Diabetes Care 27: 83–88, 2004. [DOI] [PubMed] [Google Scholar]
- 10.de Magalhaes JP, Curado J, Church GM. Meta-analysis of age-related gene expression profiles identifies common signatures of aging. Bioinformatics 25: 875–881, 2009. [DOI] [PMC free article] [PubMed] [Google Scholar]
- 11.DeRuisseau KC, Park YM, DeRuisseau LR, Cowley PM, Fazen CH, Doyle RP. Aging-related changes in the iron status of skeletal muscle. Exp Gerontol 48: 1294–1302, 2013. [DOI] [PMC free article] [PubMed] [Google Scholar]
- 12.Deus AP, Bassi D, Simoes RP, Oliveira CR, Baldissera V, Marqueti Rde C, Araujo HS, Arena R, Borghi-Silva A. MMP(-2) expression in skeletal muscle after strength training. Int J Sports Med 33: 137–141, 2012. [DOI] [PubMed] [Google Scholar]
- 13.Dey BK, Pfeifer K, Dutta A. The H19 long noncoding RNA gives rise to microRNAs miR-675-3p and miR-675-5p to promote skeletal muscle differentiation and regeneration. Genes Dev 28: 491–501, 2014. [DOI] [PMC free article] [PubMed] [Google Scholar]
- 14.Eden E, Navon R, Steinfeld I, Lipson D, Yakhini Z. GOrilla: a tool for discovery and visualization of enriched GO terms in ranked gene lists. BMC Bioinformatics 10: 48, 2009. [DOI] [PMC free article] [PubMed] [Google Scholar]
- 15.Fan J, Kou X, Jia S, Yang X, Yang Y, Chen N. Autophagy as a potential target for sarcopenia. J Cell Physiol 231: 1450–1459, 2016. [DOI] [PubMed] [Google Scholar]
- 16.Fritzen AM, Madsen AB, Kleinert M, Treebak JT, Lundsgaard AM, Jensen TE, Richter EA, Wojtaszewski J, Kiens B, Frosig C. Regulation of autophagy in human skeletal muscle: effects of exercise, exercise training and insulin stimulation. J Physiol 594: 745–761, 2016. [DOI] [PMC free article] [PubMed] [Google Scholar]
- 17.Ghosh S, Lertwattanarak R, Garduno Jde J, Galeana JJ, Li J, Zamarripa F, Lancaster JL, Mohan S, Hussey S, Musi N. Elevated muscle TLR4 expression and metabolic endotoxemia in human aging. J Gerontol A Biol Sci Med Sci 70: 232–246, 2015. [DOI] [PMC free article] [PubMed] [Google Scholar]
- 18.Gulati M, Pandey DK, Arnsdorf MF, Lauderdale DS, Thisted RA, Wicklund RH, Al-Hani AJ, Black HR. Exercise capacity and the risk of death in women: the St James Women Take Heart Project. Circulation 108: 1554–1559, 2003. [DOI] [PubMed] [Google Scholar]
- 19.Hénique C, Mansouri A, Vavrova E, Lenoir V, Ferry A, Esnous C, Ramond E, Girard J, Bouillaud F, Prip-Buus C, Cohen I. Increasing mitochondrial muscle fatty acid oxidation induces skeletal muscle remodeling toward an oxidative phenotype. FASEB J 29: 2473–2483, 2015. [DOI] [PubMed] [Google Scholar]
- 20.Howlett RA, Gonzalez NC, Wagner HE, Fu Z, Britton SL, Koch LG, Wagner PD. Selected contribution: skeletal muscle capillarity and enzyme activity in rats selectively bred for running endurance. J Appl Physiol (1985) 94: 1682–1688, 2003. [DOI] [PubMed] [Google Scholar]
- 21.Howlett RA, Kirkton SD, Gonzalez NC, Wagner HE, Britton SL, Koch LG, Wagner PD. Peripheral oxygen transport and utilization in rats following continued selective breeding for endurance running capacity. J Appl Physiol (1985) 106: 1819–1825, 2009. [DOI] [PMC free article] [PubMed] [Google Scholar]
- 22.Ideraabdullah FY, Vigneau S, Bartolomei MS. Genomic imprinting mechanisms in mammals. Mutat Res 647: 77–85, 2008. [DOI] [PMC free article] [PubMed] [Google Scholar]
- 23.Kim YA, Kim YS, Oh SL, Kim HJ, Song W. Autophagic response to exercise training in skeletal muscle with age. J Physiol Biochem 69: 697–705, 2013. [DOI] [PubMed] [Google Scholar]
- 24.Kivelä R, Silvennoinen M, Lehti M, Rinnankoski-Tuikka R, Purhonen T, Ketola T, Pullinen K, Vuento M, Mutanen N, Sartor MA, Reunanen H, Koch LG, Britton SL, Kainulainen H. Gene expression centroids that link with low intrinsic aerobic exercise capacity and complex disease risk. FASEB J 24: 4565–4574, 2010. [DOI] [PMC free article] [PubMed] [Google Scholar]
- 25.Koch LG, Britton SL. Artificial selection for intrinsic aerobic endurance running capacity in rats. Physiol Genomics 5: 45–52, 2001. [DOI] [PubMed] [Google Scholar]
- 26.Koch LG, Britton SL, Wisloff U. A rat model system to study complex disease risks, fitness, aging, and longevity. Trends Cardiovasc Med 22: 29–34, 2012. [DOI] [PMC free article] [PubMed] [Google Scholar]
- 27.Koch LG, Kemi OJ, Qi N, Leng SX, Bijma P, Gilligan LJ, Wilkinson JE, Wisloff H, Hoydal MA, Rolim N, Abadir PM, van Grevenhof EM, Smith GL, Burant CF, Ellingsen O, Britton SL, Wisloff U. Intrinsic aerobic capacity sets a divide for aging and longevity. Circ Res 109: 1162–1172, 2011. [DOI] [PMC free article] [PubMed] [Google Scholar]
- 28.Kokkinos P, Myers J, Kokkinos JP, Pittaras A, Narayan P, Manolis A, Karasik P, Greenberg M, Papademetriou V, Singh S. Exercise capacity and mortality in black and white men. Circulation 117: 614–622, 2008. [DOI] [PubMed] [Google Scholar]
- 29.Lakka TA, Venalainen JM, Rauramaa R, Salonen R, Tuomilehto J, Salonen JT. Relation of leisure-time physical activity and cardiorespiratory fitness to the risk of acute myocardial infarction. N Engl J Med 330: 1549–1554, 1994. [DOI] [PubMed] [Google Scholar]
- 30.Liao P, Zhou J, Ji LL, Zhang Y. Eccentric contraction induces inflammatory responses in rat skeletal muscle: role of tumor necrosis factor-alpha. Am J Physiol Regul Integr Comp Physiol 298: R599–R607, 2010. [DOI] [PubMed] [Google Scholar]
- 31.Myers J, Prakash M, Froelicher V, Do D, Partington S, Atwood JE. Exercise capacity and mortality among men referred for exercise testing. N Engl J Med 346: 793–801, 2002. [DOI] [PubMed] [Google Scholar]
- 32.Narasimhan M, Hong J, Atieno N, Muthusamy VR, Davidson CJ, Abu-Rmaileh N, Richardson RS, Gomes AV, Hoidal JR, Rajasekaran NS. Nrf2 deficiency promotes apoptosis and impairs PAX7/MyoD expression in aging skeletal muscle cells. Free Radic Biol Med 71: 402–414, 2014. [DOI] [PMC free article] [PubMed] [Google Scholar]
- 33.Overmyer KA, Evans CR, Qi NR, Minogue CE, Carson JJ, Chermside-Scabbo CJ, Koch LG, Britton SL, Pagliarini DJ, Coon JJ, Burant CF. Maximal oxidative capacity during exercise is associated with skeletal muscle fuel selection and dynamic changes in mitochondrial protein acetylation. Cell Metab 21: 468–478, 2015. [DOI] [PMC free article] [PubMed] [Google Scholar]
- 34.Perusse L, Tremblay A, Leblanc C, Bouchard C. Genetic and environmental influences on level of habitual physical activity and exercise participation. Am J Epidemiol 129: 1012–1022, 1989. [DOI] [PubMed] [Google Scholar]
- 35.Prud'homme D, Bouchard C, Leblanc C, Landry F, Fontaine E. Sensitivity of maximal aerobic power to training is genotype-dependent. Med Sci Sports Exerc 16: 489–493, 1984. [DOI] [PubMed] [Google Scholar]
- 36.R Development Core Team. R: A Language and Environment for Statistical Computing. Vienna, Austria: R Foundation for Statistical Computing, 2010. [Google Scholar]
- 37.Ren YY, Overmyer KA, Qi NR, Treutelaar MK, Heckenkamp L, Kalahar M, Koch LG, Britton SL, Burant CF, Li JZ. Genetic analysis of a rat model of aerobic capacity and metabolic fitness. PLoS One 8: e77588, 2013. [DOI] [PMC free article] [PubMed] [Google Scholar]
- 38.Romanello V, Sandri M. Mitochondrial quality control and muscle mass maintenance. Front Physiol 6: 422, 2015. [DOI] [PMC free article] [PubMed] [Google Scholar]
- 39.Sanchez AM, Bernardi H, Py G, Candau RB. Autophagy is essential to support skeletal muscle plasticity in response to endurance exercise. Am J Physiol Regul Integr Comp Physiol 307: R956–R969, 2014. [DOI] [PubMed] [Google Scholar]
- 40.Sandvik L, Erikssen J, Thaulow E, Erikssen G, Mundal R, Rodahl K. Physical fitness as a predictor of mortality among healthy, middle-aged Norwegian men. N Engl J Med 328: 533–537, 1993. [DOI] [PubMed] [Google Scholar]
- 41.Sartor MA, Leikauf GD, Medvedovic M. LRpath: a logistic regression approach for identifying enriched biological groups in gene expression data. Bioinformatics 25: 211–217, 2009. [DOI] [PMC free article] [PubMed] [Google Scholar]
- 42.Sierra A, Subbotina E, Zhu Z, Gao Z, Koganti SR, Coetzee WA, Goldhamer DJ, Hodgson-Zingman DM, Zingman LV. Disruption of ATP-sensitive potassium channel function in skeletal muscles promotes production and secretion of musclin. Biochem Biophys Res Commun 471: 129–134, 2016. [DOI] [PMC free article] [PubMed] [Google Scholar]
- 43.Su J, Ekman C, Oskolkov N, Lahti L, Strom K, Brazma A, Groop L, Rung J, Hansson O. A novel atlas of gene expression in human skeletal muscle reveals molecular changes associated with aging. Skelet Muscle 5: 35, 2015. [DOI] [PMC free article] [PubMed] [Google Scholar]
- 44.Subbotina E, Sierra A, Zhu Z, Gao Z, Koganti SR, Reyes S, Stepniak E, Walsh SA, Acevedo MR, Perez-Terzic CM, Hodgson-Zingman DM, Zingman LV. Musclin is an activity-stimulated myokine that enhances physical endurance. Proc Natl Acad Sci USA 112: 16042–16047, 2015. [DOI] [PMC free article] [PubMed] [Google Scholar]
- 45.Suetta C, Frandsen U, Jensen L, Jensen MM, Jespersen JG, Hvid LG, Bayer M, Petersson SJ, Schroder HD, Andersen JL, Heinemeier KM, Aagaard P, Schjerling P, Kjaer M. Aging affects the transcriptional regulation of human skeletal muscle disuse atrophy. PLoS One 7: e51238, 2012. [DOI] [PMC free article] [PubMed] [Google Scholar]
- 46.Sui X, LaMonte MJ, Laditka JN, Hardin JW, Chase N, Hooker SP, Blair SN. Cardiorespiratory fitness and adiposity as mortality predictors in older adults. JAMA 298: 2507–2516, 2007. [DOI] [PMC free article] [PubMed] [Google Scholar]
- 47.Thomas RR, Khan SM, Smigrodzki RM, Onyango IG, Dennis J, Khan OM, Portelli FR, Bennett JP Jr. RhTFAM treatment stimulates mitochondrial oxidative metabolism and improves memory in aged mice. Aging (Albany NY) 4: 620–635, 2012. [DOI] [PMC free article] [PubMed] [Google Scholar]
- 48.Tondera D, Czauderna F, Paulick K, Schwarzer R, Kaufmann J, Santel A. The mitochondrial protein MTP18 contributes to mitochondrial fission in mammalian cells. J Cell Sci 118: 3049–3059, 2005. [DOI] [PubMed] [Google Scholar]
- 49.Vainshtein A, Tryon LD, Pauly M, Hood DA. Role of PGC-1alpha during acute exercise-induced autophagy and mitophagy in skeletal muscle. Am J Physiol Cell Physiol 308: C710–C719, 2015. [DOI] [PMC free article] [PubMed] [Google Scholar]
- 50.Vu TH, Werb Z. Matrix metalloproteinases: effectors of development and normal physiology. Genes Dev 14: 2123–2133, 2000. [DOI] [PubMed] [Google Scholar]
- 51.Wisloff U, Najjar SM, Ellingsen O, Haram PM, Swoap S, Al-Share Q, Fernstrom M, Rezaei K, Lee SJ, Koch LG, Britton SL. Cardiovascular risk factors emerge after artificial selection for low aerobic capacity. Science 307: 418–420, 2005. [DOI] [PubMed] [Google Scholar]
Associated Data
This section collects any data citations, data availability statements, or supplementary materials included in this article.