

ABSTRACT
Structural disruption of the gut microbiota and impaired goblet cell function are collateral etiologic factors in enteric diseases. Low, moderate, or high doses of a Bacillus licheniformis-B. subtilis mixture (BLS mix) were orally administered to piglets of genotype MUC4 that are supposed to be F4-expressing enterotoxigenic Escherichia coli strain (F4+ ETEC) F4ab/ac receptor negative (i.e., MUC4-resistant piglets) for 1 week before F4+ ETEC challenge. The luminal contents were collected from the mucosa of the colon on day 8 after F4+ ETEC challenge. The BLS mix attenuated E. coli-induced expansion of Bacteroides uniformis, Eubacterium eligens, Acetanaerobacterium, and Sporobacter populations. Clostridium and Turicibacter populations increased following F4+ ETEC challenge in pigs pretreated with low-dose BLS mix. Lactobacillus gasseri and Lactobacillus salivarius populations increased after administration of BLS mix during E. coli infection. The beneficial effects of BLS mix were due in part to the expansion of certain Clostridium, Lactobacillus, and Turicibacter populations, with a corresponding increase in the number of goblet cells in the ileum via upregulated Atoh1 expression, in turn increasing MUC2 production and thus preserving the mucus barrier and enhancing host defenses against enteropathogenic bacteria. However, excessive BLS mix consumption may increase the risk for enteritis, partly through disruption of colonic microbial ecology, characterized by expansion of Proteobacteria and impaired goblet cell function in the ileum. Our findings suggest that oral administration of BLS mix reprograms the gut microbiota and enhances goblet cell function to ameliorate enteritis.
IMPORTANCE The present study is important for improving our understanding of the protective role of probiotics against Escherichia coli infection in piglets. Structural disruption of the gut microbiota and impaired goblet cell function are collateral etiologic factors in enteric diseases. In this study, low, moderate, or high doses of a Bacillus licheniformis-B. subtilis mixture (BLS mix) were orally administered to MUC4-resistant piglets for 1 week before the F4-expressing ETEC strain (F4+ ETEC) challenge. Our findings suggest that oral administration of BLS mix reprograms the gut microbiota and enhances goblet cell function to ameliorate enteritis.
KEYWORDS: Bacillus licheniformis, Bacillus subtilis, Escherichia coli, gut microbiota, goblet cell, pig
INTRODUCTION
Susceptibility to enterotoxigenic Escherichia coli (ETEC) expressing the F4 fimbriae, mainly F4ab and F4ac, is dominantly inherited in neonatal and postweaning piglets (1). ETEC-related postweaning diarrhea (PWD) in piglets is an important cause of economic losses in swine farming (2). The F4 fimbria-mediated initial anchor to the F4 receptors on the intestinal brush border allows for ETEC colonization of the porcine intestine (3). Delivery of heat-labile (LT) and/or heat-stable (ST) enterotoxins and release of lipopolysaccharide (LPS) to the intestine are critical virulence traits for the onset of the diarrhea. Moreover, ETEC and other diarrheagenic E. coli strains (e.g., enteropathogenic E. coli [EPEC] and verocytotoxigenic E. coli [VTEC]) may obtain additional virulence factors via horizontal gene transfer (4, 5). Formation of attachment and effacing (A/E) lesions on intestinal cells is related to the presence of intimin (eae gene) secreted by EPEC/ETEC (6). Binding of intimin to translocated intimin receptor (Tir) that was inserted into host epithelial cell membrane contributes to bacterial intimate attachment to the host cell (2). In pigs, some ETEC strains of O149 serotype that cause PWD possess additional genes that encode Shiga toxin 2e (Stx2e) (7). In practice, breeding programs with F4 receptor-negative pigs are feasible ways for controlling F4-expressing (F4+) ETEC-related diarrhea, and a polymorphism in the mucin 4 gene (MUC4) has been developed to allow genotyping for determination of ETEC F4ab/ac receptor resistance or susceptibility. However, susceptibility toward ETEC F4ab/ac is not governed only by the MUC4 gene in pigs, since positive adhesion of F4ab/ac ETEC occurs in more than 30% of pigs of genotype MUC4 that are supposed to be ETEC F4ab/ac receptor negative (i.e., MUC4 resistant) and more receptors for F4 fimbriae have been discovered (8, 9). We recently found that an F4+ ETEC hybrid expressing virulence factors STb, LT, Stx2e, attaching and effacing intimin (eae), translocated intimin receptor (tir), escV, and E. coli-secreted protein A (espA) can also cause enteritis and/or fever in MUC4-resistant piglets (10). The exact mode of action of F4+ ETEC in this regard remains largely unknown.
Host-microbe interactions play vital roles in maintaining physiologic and immunologic intestinal homeostasis. F4+ ETEC challenge results in increased coliform shedding and reduced Lactobacillus and Bifidobacterium counts in the feces of newly weaned pigs (11). Moreover, culture or targeted molecular biology-based analyses provide an incomplete profile of the microbiota. Next-generation high-throughput sequencing of PCR amplicons from the 16S rRNA genes has been used for high-resolution surveys of microbiota communities, and this technological development has facilitated detailed analysis of the microbiota structure (12). The microbial ecosystem of the swine gut changes across growth stages, and these variations in the gut microbiota are driven by a variety of factors, including exogenous bacteria (13). The complete profile of ETEC-induced alterations in the intestinal microbiota of pigs and the potential contribution of these alterations to the development of diarrhea still remain largely unexplored, however.
It has become increasingly evident that both specific intestinal bacterial species and the microbiota community as a whole can exert either pathogenic effects that facilitate disease progression or probiotic effects that enhance intestinal health. In swine, litters from sows fed Bacillus subtilis (3.75 × 10⁵ CFU/g feed) exhibit greater weaning weight (14). Oral supplementation with B. subtilis spores increases the abundance of Lactobacillus species in the colon of pigs (14). Our previous studies using an E. coli model showed that pretreatment with certain probiotics, such as Lactobacillus rhamnosus or various Bacillus strains, ameliorates infectious enteritis or diarrhea in newly weaned piglets; however, there is a risk that high-dose probiotic pretreatment may negate the preventative effects (10, 15).
The mucus layer overlying the epithelium, produced by secretory goblet cells (GCs), separates the vast majority of the commensal microbiota from the intestinal epithelial cell (IEC) layer and is an important mediator of interactions between the microbiota and IECs. In the intestine, the transcriptional activation of the atonal homolog 1 gene (Atoh1) promotes the secretory GC lineage (16). There is a very high diversity of mucosa-associated microbiota in weaned pigs, and pyrosequencing analysis of the 16S rRNA gene amplicon revealed that 132 and 198 operational taxonomic units (OTUs) were assigned in the mucosa of the ileum and the colon, respectively (17).
In the present study, we examined the effects of a selected Bacillus licheniformis-B. subtilis mixture (BLS mix) on the gut microbiota and GC function. We also evaluated the fate of GCs affected by BLS mix via regulation of antagonistic interplay between Notch/Hes1 and Atoh1 in the small intestine of newly weaned MUC4-resistant piglets following F4+ ETEC challenge.
RESULTS
Clinical status.
Before E. coli challenge, all pigs had a normal rectal temperature of 39.3 ± 0.29°C. At 48 h after E. coli challenge, a rapid increase in rectal temperature to 40.2 ± 0.31°C was measured in E. coli-challenged pigs compared with that of pigs in the CONT group (who received oral administration of sterile physiological saline) (P = 0.022) (see Fig. S1 in the supplemental material). The MDBE pigs (who received oral administration of a moderate-dose probiotic mixture [7.8 × 10⁸ CFU/day] and oral challenge with F4+ ETEC) and HDBE pigs (who received oral administration of a high-dose probiotic mixture [3.9 × 10⁹ CFU/day] and oral challenge with F4+ ETEC) also showed a rectal temperature of >40°C at 72 h after E. coli challenge, while the CONT pigs and LDBE pigs (who received oral administration of a low-dose probiotic mixture [3.9 × 10⁸ CFU/day] and oral challenge with F4+ ETEC) still had a normal rectal temperature after E. coli challenge. The rectal temperature of ETEC group pigs (who received oral administration of sterile physiological saline and oral challenge with F4+ ETEC [1 × 10¹⁰ CFU/day]) and of MDBE and HDBE pigs remained higher than that of CONT (P = 0.039, P = 0.041, and P = 0.003, respectively) and LDBE (P = 0.010, P = 0.013, and P < 0.001, respectively) pigs until 144 h after challenge.
The effects of oral administration of different doses of BLS mix on diarrhea scores of newly weaned pigs before and after E. coli challenge are shown in Fig. S2 and Table S1 in the supplemental material. During week 1 (prior to the E. coli challenge), 2 pigs each in the CONT and HDBE groups and 1 pig each in the ETEC and MDBE groups exhibited naturally acquired severe diarrhea lasting for 1 day due to weaning (environmental, psychological, and dietary) stress; however, only 1 pig in the LDBE group had mild diarrhea by day 4. During week 2, 1 pig in the ETEC group and 2 pigs in the MDBE group exhibited mild diarrhea lasting for 1 day following E. coli challenge. In the HDBE group, 1 pig and 2 pigs exhibited mild and severe diarrhea lasting for 1 day, respectively (Table S1). The diarrhea score distributions in week 1 and week 2 for the 5 groups were unaffected by the challenge (Fig. S2). When presented as pig-days with diarrhea, no difference in incidence of diarrhea was found among the 5 groups (Table S1).
In the first 2 weeks following the challenge, the average daily weight gain and feed intake were lower in ETEC pigs than in CONT pigs (P = 0.011 and P = 0.018, respectively), but there were no differences in average daily weight gain in the LDBE, MDBE, or HDBE pigs compared with the CONT pigs and the average daily feed intake was higher in the LDBE, MDBE, and HDBE pigs than in the ETEC pigs (Table S2).
Characterization of the colonic microbiota of pigs.
The raw data set consisted of 2,590,014 reads. After quality trimming and chimera checking, a total of 1,463,870 high-quality 16S rRNA gene reads with a median read length of 272 bp were obtained from each sample, with an average of 672 ± 39 OTUs and 48,796 ± 10,127 reads per sample. This sequencing depth almost reflected the total microbial species richness, and the majority of OTUs were present at low abundance, as shown by the Shannon diversity, rarefaction, and rank abundance curves (Fig. S3). The numbers of OTUs observed and the Shannon index values did not differ among the five groups.
Sixteen phyla, including one candidate division (TM7), were identified in the colonic microbiota of all samples (Fig. 1A). The colonic microbiota was dominated by Bacteroidetes and Firmicutes populations (regardless of treatment), which constituted >52% and 27% of the total abundance, respectively. Other represented phyla included the Spirochaetae, Tenericutes, and Proteobacteria, with relative abundances in the colonic microbiota of >1% of the total abundance (Table S3).
FIG 1.

Colonic microbiota profile of F4+ ETEC-infected pigs pretreated with BLS mix. The MUC4-resistant pigs received sterile physiological saline orally (CONT), received sterile physiological saline orally followed by F4+ ETEC (1.0 × 10¹⁰ CFU/day, per os [p.o.]) challenge (ETEC), were pretreated with a low dose of BLS mix (3.9 × 10⁸ CFU/day, p.o.) for 1 week followed by F4+ ETEC challenge (LDBE), were pretreated with a moderate dose of BLS mix (7.8 × 10⁸ CFU/day, p.o.) for 1 week followed by F4+ ETEC challenge (MDBE), or were pretreated with a high dose of BLS mix (3.9 × 10⁹ CFU/day, p.o.) for 1 week followed by F4+ ETEC (HDBE). The colonic contents from the indicated pigs were collected on day 15 after weaning (1 week after F4+ ETEC challenge), and high-throughput sequencing analysis of the PCR-amplified 16S rRNA gene V4 region was performed. (A) Colonic microbiota profiles shown at the phylum level. Stacked bars show the combined phylum-level relative abundance of the colonic microbiota per animal. (B) Histograms based on the relative abundance of OTUs per animal. Colors are assigned for all phyla detected. The heat map shows genera (as identified by comparing the 16S rRNA gene sequences against the Silva (SSU117/119) database via the Ribosomal Database Project (RDP) naïve Bayesian classifier at a bootstrap cutoff of 80%) with a relative abundance greater than 0.1% of the total abundance per animal in CONT (C), ETEC (E), LDBE (L), MDBE (M), and HDBE (H) groups. The relative abundance of each genus is indicated by a color gradient from blue (low abundance) to red (high abundance). Genera are clustered to the left based on relative abundance. A letter (C, E, L, M, or H) plus a digit (1 to 6) represents an individual animal in the corresponding groups.
In total, usable sequences from the colonic microbiota were classified into 120 genera, including 105, 106, 108, 100, and 114 genera in the CONT, ETEC, LDBE, MDBE, and HDBE pigs, respectively. The 13 most abundant genera (with an average relative abundance of >1%) accounted for 64% of the total abundance and included Prevotella, Prevotella uncultured, Ruminococcaceae uncultured, RC9 gut group, S24-7 “norank” (sequences that could be assigned to the family and species levels with no rank at the genus level), Parabacteroides, Spirochaetae, Phascolarctobacterium, Faecalibacterium, Ruminococcaceae incertae sedis, Subdoligranulum, Treponema, and Oscillospira classifications based on taxonimic assignment by comparing the 16S rRNA gene sequences against the Silva (SSU117/119) database via the Ribosomal Database Project (RDP) naïve Bayesian classifier at a bootstrap cutoff of 80% (Table S3).
A heat map-based analysis of the 42 colonic genera from the 1,046 filtered OTUs that had relative abundances greater than 0.001 (i.e., the read number of an OTU divided by the total number of reads should provide a value of >0.001) indicated that there may be differences in the colonic microbial genera between individual pigs (Fig. 1B).
BLS mix pretreatment affected the community structure of the colonic microbiota during E. coli infection.
To measure the degree of similarity between microbial communities, beta diversity metrics were calculated. Principal-component analysis (PCA) based on OTU abundance and principal-coordinate analysis (PCoA) based on unweighted UniFrac distance metrics were performed to provide an overview of the similarities or differences between each individual animal on the basis of their colonic microbiota composition and the treatments (Fig. 2).
FIG 2.

Phylogenetic differences in colonic microbiota in response to F4+ ETEC infection and BLS mix intervention. Two-dimensional OTU abundance-based principal-component analysis (PCA) (A) and unweighted UniFrac distance metric-based principal-coordinate analysis (PCoA) (B) were performed to compare phylogenetic differences of the colonic microbiota of piglets challenged with F4+ ETEC and pretreated with BLS mix. Each point corresponds to an individual animal and each color to a different treatment (see Fig. 1B legend for details). The percentage of variation explained by plotted principal components or principal coordinates is indicated in the axis labels.
Despite large interindividual variations, PCA separated ETEC pigs from CONT pigs (Fig. 2A). Scores for pigs pretreated with BLS mix were distributed between those for CONT pigs and ETEC pigs, suggesting that BLS mix administration shifted the overall structure of the F4+ ETEC-disrupted colonic microbiota toward that of CONT pigs. The PCA scores of LDBE and MDBE pigs were close to those of CONT pigs, whereas the PCA scores of HDBE pigs, with the exception of pig H2, were separated from those of CONT pigs.
Unweighted UniFrac distances take into account the presence/absence of bacterial taxa. PCoA1 based on unweighted UniFrac distances, accounting for 26.89% of total variance, predominantly reflected F4+ ETEC and high-dose BLS mix treatment-related changes in the colonic microbiota composition, as PCoA1 separated HDBE and ETEC pigs from CONT, LDBE, and MDBE pigs (Fig. 2B). PCoA scores of LDBE and MDBE (but not HDBE) pigs were close to those of CONT pigs, indicating that low-dose and moderate-dose (rather than high-dose) BLS mix administration attenuated F4+ ETEC-induced disruption of the colonic microbiota.
The structures of the sample communities were altered by treatments (P < 0.05), as determined by unweighted UniFrac distances. However, the comparison R value (0.221) in the ANOSIM test and the R2 value (0.213) in the ADONIS test were low, indicating that the degree of separation was limited.
BLS mix pretreatment altered the colonic microbiota during E. coli infection.
At the phylum level, the proportion of Proteobacteria in the colonic microbiota of HDBE (but not LDBE or MDBE) pigs was higher than that of CONT pigs (P = 0.040). The abundance of Tenericutes was lower (P = 0.006) in ETEC pigs, even in pigs pretreated with BLS mix.
The Clostridia, as a phylogenetic class, was abundant in the colonic microbiota, and the proportion of Clostridia species in MDBE and HDBE (but not LDBE) pigs was lower (P = 0.018 and P = 0.043, respectively) than that in ETEC pigs (Fig. 3B). The abundance of the class Negativicutes was higher (P = 0.04) in the colonic microbiota of MDBE pigs than in that of ETEC pigs.
FIG 3.

BLS mix pretreatment altered the colonic microbiota during F4+ ETEC infection. The MUC4-resistant pigs received sterile physiological saline orally (CONT group), received sterile physiological saline orally followed by F4+ ETEC (1.0 × 10¹⁰ CFU/day, p.o.) challenge (ETEC), were pretreated with a low dose of BLS mix (3.9 × 10⁸ CFU/day, p.o.) for 1 week followed by F4+ ETEC challenge (LDBE), were pretreated with a moderate dose of BLS mix (7.8 × 10⁸ CFU/day, p.o.) for 1 week followed by F4+ ETEC challenge (MDBE), or were pretreated with a high dose of BLS mix (3.9 × 10⁹ CFU/day, p.o.) for 1 week followed by F4+ ETEC (HDBE). Differences in relative abundance of colonic microbiota from the five indicated treatment groups are shown at the phylum (A), class (B), family (C), genus (D), and species (E) levels. At the genus level (D), colors are assigned for each genus detected differentially, and stacked bars show the combined relative abundance of each genus. Data are pooled for each given treatment and are represented as means ± standard errors of the mean (SEM) (n = 6 per group). *, P < 0.05; **, P < 0.01.
The abundances of distinct bacterial families differed among the five groups. Compared with either CONT or ETEC pigs, MDBE pigs had a higher abundance of Lactobacillaceae (P = 0.043 and P = 0.034, respectively) (Fig. 3C). The proportion of Clostridiaceae in the colonic microbiota of LDBE pigs (but not MDBE or HDBE pigs) was higher than that of CONT and ETEC pigs (P = 0.041 and P = 0.023, respectively).
A total of 12 genera exhibiting differential abundances were identified among the five groups; these genera belonged to the orders Bacteroidales, Lactobacillales, Clostridiales, and Erysipelotrichales (Fig. 3D; see Table S4 in the supplemental material). The genus Lactobacillus was enriched in MDBE pigs compared with that in ETEC pigs (P = 0.034). The LDBE pigs had a higher abundance of Clostridium than did CONT or ETEC pigs (P = 0.041 and P = 0.023, respectively). Of the members of the Clostridiales, Acetanerobacterium (0.0017% ± 0.0008% versus 0%) and Sporobacter (0.0039% ± 0.0012% versus 0%) were more abundant in ETEC pigs than in CONT pigs (P = 0.035 and P = 0.014, respectively). LDBE (but not MDBE or HDBE) pigs had a higher abundance of Turicibacter (P = 0.002) than did ETEC pigs.
Because of the relatively short average read length, only a small number of sequences (26.33%) were classified at the species level, and some species exhibited differential abundances (Fig. 3E). Compared with the proportions in CONT pigs, the proportions of Bacteroides uniformis and Eubacterium eligens were higher (P = 0.029 and P = 0.020, respectively) in ETEC pigs, but this was not the case in pigs pretreated with BLS mix. Compared with the abundances in ETEC pigs, the abundances of Lactobacillus gasseri and Lactobacillus salivarius were higher in MDBE pigs but not in LDBE and HDBE pigs (P = 0.036 and P = 0.029, respectively). The proportion of Streptococcus hyointestinalis was higher in the colonic microbiota of LDBE pigs than in ETEC pigs (P = 0.022).
Quantitative PCR (qPCR) analysis of colonic total bacterial loads and Lactobacillus abundance.
Compared with that in ETEC pigs, the total abundance of bacterial 16S rRNA genes increased in LDBE and MDBE pigs (P = 0.021 and P = 0.015, respectively) but not in HDBE pigs (Fig. 4A). In contrast, the total bacterial 16S rRNA gene abundance was lower in HDBE pigs than in CONT, LDBE, and MDBE pigs (P = 0.005, P < 0.001, and P < 0.001). Similarly, the absolute abundances of colonic lactobacilli decreased in HDBE pigs compared with those in CONT, LDBE, and MDBE pigs (P = 0.001, P = 0.002 and P < 0.001) (Fig. 4B), whereas the absolute lactobacillus levels increased in MDBE pigs compared with ETEC pigs (P < 0.001).
FIG 4.

Quantification of bacterial loads and lactobacilli abundance in colonic contents. The colonic contents from animals in the indicated groups were collected on day 15 after weaning (1 week after F4+ ETEC challenge). Total bacterial (A) and lactobacillus (B) copy numbers were determined by qPCR analysis. Results are presented as log10 copies/g colonic contents. Data are presented as means ± SEM (n = 6 per group). *, P < 0.05; **, P < 0.01; ***, P < 0.001.
BLS mix consumption increased Lactobacillus counts but decreased coliform counts in the large bowel during E. coli infection.
The excretion of viable BLS mix spores in feces of pigs was measured on days 9, 12, and 14 (after withdrawal of BLS mix spores). In LDBE pigs, viable BLS mix spores were detected from day 9 to day 14, ranging from 5.45 × 10⁶ ± 2.85 × 10⁶ CFU g−1 of feces (mean ± SD) to 5.25 × 10⁴ ± 1.05 × 10⁴ CFU g−1 of feces. On day 9, 8.03 × 10⁶ ± 2.33 × 10⁶ and 3.60 × 10⁷ ± 1.02 × 10⁷ BLS mix spores g−1 of feces were found in MDBE and HDBE pigs, respectively, and decreases in viable BLS mix spore counts in MDBE and HDBE pigs were observed on days 12 (8.75 × 10⁵ ± 7.87 × 10⁵ versus 2.62× 10⁶ ± 2.27 × 10⁶ spores g−1 of feces) and 14 (2.08 × 10⁵ ± 1.62 × 10⁵ versus 7.83× 10⁵ ± 9.95 × 10⁴ spores g−1 of feces). Viable BLS mix spores in feces from CONT and ETEC pigs remained culture negative until the end of the experiment on day 14.
Prior to F4+ ETEC challenge, HDBE pigs had lower (P = 0.011) fecal Lactobacillus counts 7 days after BLS mix pretreatment than CONT pigs (Fig. 5A). On day 9, fecal Lactobacillus counts were higher in MDBE pigs than in either CONT or ETEC pigs (P = 0.035 and P < 0.001, respectively). In contrast, fecal coliform counts decreased in MDBE piglets 12 days after BLS mix pretreatment compared with that in CONT (P = 0.021) or ETEC (P = 0.010) pigs (Fig. 5B).
FIG 5.

Culture-based enumeration of lactobacilli and coliforms in the fecal and intestinal microbiota. Fresh fecal samples from animals of the indicated groups were collected on days 1, 4, 7, 9, and 12 after weaning, and the contents of the midjejunum, distal ileum, cecum, and midcolon were collected on day 15 after weaning (1 week after F4+ ETEC challenge). The numbers of lactobacilli (A and C) and coliforms (B and D) in the fecal and intestinal contents were monitored using culture-based methods. Results are presented as log10 CFU/g feces or contents. All counts were performed in triplicate. Data are presented as means ± SEM for each time point and contents of each intestinal segment (n = 6 per group). Mean values at the same time point without a common superscript letter differ significantly (P < 0.05). *, P < 0.05; **, P < 0.01, ***, P < 0.001.
On day 15 (1 week after F4+ ETEC challenge), Lactobacillus counts in the ileal contents from HDBE pigs (but not LDBE or MDBE pigs) were lower than those from CONT or ETEC pigs (P = 0.005 and P = 0.006, respectively) (Fig. 5C). In the colonic contents, Lactobacillus counts were higher in MDBE pigs than in CONT or ETEC pigs (P = 0.016 and P = 0.008, respectively). In contrast, coliform counts were lower in the cecal and colonic contents from MDBE pigs (P = 0.003 and P = 0.006, respectively) than in those from CONT pigs (Fig. 5D). Coliform counts in the ileal and colonic contents from MDBE pigs were also lower than those from ETEC pigs (P = 0.012 and P = 0.006, respectively).
The pH values of the jejunum, ileum, cecum, and colon contents of the five groups were unchanged on day 15 (data not shown).
Moderate-dose BLS mix consumption ameliorated E. coli-induced decreases in the number of ileal GCs via increasing Atoh1 mRNA expression.
No differences were observed among the five groups with respect to the number of GCs in the jejunum (Fig. 6A). However, the number of ileal GCs was lower in ETEC pigs than in CONT pigs (P = 0.027), whereas the number of GCs in MDBE pigs was higher than that in either CONT or ETEC pigs (P = 0.049 and P < 0.001, respectively).
FIG 6.

Orally administered BLS mix ameliorates the F4+ ETEC-induced decrease in the number of ileal goblet cells via increasing Atoh1 expression. The MUC4-resistant pigs received sterile physiological saline orally (CONT), received sterile physiological saline orally followed by F4+ ETEC (1.0 × 10¹⁰ CFU/day, p.o.) challenge (ETEC), were pretreated with a low dose of BLS mix (3.9 × 10⁸ CFU/day, p.o.) for 1 week followed by F4+ ETEC challenge (LDBE), were pretreated with a moderate dose of BLS mix (7.8 × 10⁸ CFU/day, p.o.) for 1 week followed by F4+ ETEC challenge (MDBE), or were pretreated with a high dose of BLS mix (3.9 × 10⁹ CFU/day, p.o.) for 1 week followed by F4+ ETEC (HDBE). Jejunal and ileal tissues were collected from animals from the indicated groups 1 week after F4+ ETEC challenge. (A) Numbers of goblet cells in the jejunum and ileum tissues determined by alcian blue/periodic acid-Schiff (AB-PAS) staining. The left panels show representative photomicrographs of AB-PAS-stained tissues. Scale bars, 50 μm. The right panels are histograms showing the numbers of goblet cells in the jejunum and ileum tissues collected from animals from the indicated groups. (B) Relative expression of mRNA for the MUC2, Atoh1, and Hes1 genes analyzed by quantitative real-time PCR. Data are presented as means ± SEM for each tissue (n = 6 per group). *, P < 0.05; **, P < 0.01; ***, P < 0.001.
Compared with that in either CONT or ETEC pigs, the expression levels of MUC2 (P = 0.003 and P < 0.001, respectively) and Atoh1 (P = 0.047 and P = 0.015, respectively) mRNA in the ileum of MDBE pigs were upregulated (Fig. 6B). The expression of Atoh1 mRNA was lower (P = 0.016) in ileal tissues from HDBE pigs than in those from CONT pigs. No changes were observed among the five groups with respect to Hes1 mRNA expression in the small intestine (Fig. 6B).
DISCUSSION
This study was a further analysis of samples collected during experiments performed in previous works (10, 18). The incidence of diarrhea in newly weaned MUC4-resistant pigs was unaffected following F4+ ETEC challenge or probiotic BLS mix treatment. However, oral inoculation of those pigs with F4+ ETEC resulted in enteritis in the small intestine and excessive systemic inflammatory responses characterized by an increase in production of the proinflammatory cytokine tumor necrosis factor alpha (TNF-α) and poor clinical outcomes with fever, depression, anorexia, and weight loss (10). Abnormal changes in the gut microbiota after weaning increase susceptibility to enteric pathogen infections and may predispose the host to enteric diseases. The mucus layer produced by GCs separates the bacteria from direct contact with the host epithelium, and the gut microbiota also influences mucus permeability. The use of probiotics is regarded as a rational microbiota-targeted strategy for managing enteric pathogen infections by boosting the growth of natural “competitors” in the gut microbiota. Probiotic BLS mix treatment had a dose effect on the clinical symptoms. Oral administration of BLS mix improved growth performance, which was characterized by an increase in average daily weight gain and a higher average daily feed intake. Administration of a low-dose BLS mix, but not a moderate- or high-dose BLS mix, to pigs ameliorated fever and enteritis by F4+ ETEC.
Alpha diversity is unaffected by BLS mix pretreatment during E. coli infection. Despite a large intragroup variation due to the small sample size, we revealed different patterns of gut microbiota in pigs following E. coli challenge and BLS mix supplementation. Although F4+ ETEC infection induces distinct changes in microbiota structure, recovery of the colonic microbial ecology by administration of low- or moderate-dose BLS mix results in a return to a common coordinate space shared by untreated control animals. Consistent with a previous study examining fecal bacterial diversity in swine (19), the luminal microbiota of the colons of pigs at 5 weeks of age is dominated by Bacteroidetes, Firmicutes, Spirochaetae, Tenericutes, and Proteobacteria populations. In humans, the gut microbiota can be influenced by age, physiologic variations, and geography (20). Indeed, an increased Firmicutes-to-Bacteroidetes ratio in the gut microbiota was also found in advanced-age pigs (21). An increased ratio of Firmicutes to Bacteroidetes divisions has been associated with improved energy-harvesting capacity (22). However, travelers who develop diarrhea have a signature dysbiotic gut microbiome profile characterized by a high Firmicutes-to-Bacteroidetes ratio (23).
Treatment with the growth-promoting antibiotic chlortetracycline results in a decrease in the abundance of Turicibacter species belonging to the phylum Firmicutes in the ileal microbiota of pigs (24). In contrast, Turicibacter abundance was shown to decrease in dogs with inflammatory bowel disease (25), indicating that some Turicibacter species may have a favorable effect on gut health. The increased abundance of Turicibacter species in pigs pretreated with low-dose BLS mix during F4+ ETEC infection in the present study may have been a consequence of BLS mix treatment, which contributed to defense against enteropathogenic bacteria.
Some members of the Firmicutes phylum generate butyrate from acetate, which in turn is used by the gut epithelium, whereas members of Bacteroidetes in general possess a greater number of glycan-degrading enzymes than members of Firmicutes and signal the host to produce mucosal glycans that the Bacteroidetes can utilize (26). Expanded abundance of Bacteroidetes (Prevotellaceae) and TM7 bacteria increases the risk of colitis in mice (27). Moreover, oral administration of Bacteroides uniformis CECT 7771 increases the production of TNF-α by dendritic cells in response to LPS stimulation in mice (28). The orally administered BLS mix attenuates F4+ ETEC-induced increases in the abundance of B. uniformis and Eubacterium eligens, which belong to the phyla Bacteroidetes and Firmicutes, respectively. It is difficult to determine whether dysbiosis of the gut microbiota drives and/or is a consequence of disease development. The results of the present study clearly indicate that enteritis induced by F4+ ETEC is closely associated with gut microbiota dysbiosis rather than simply expansion of a particular pathogen. Manipulation of the intestinal microbiota via the probiotic BLS mix thus holds great promise for controlling enteric infections.
In the present study, an increased abundance of Lactobacillaceae populations, driven by increases in the proportion of lactic acid-producing Lactobacillus species, mainly L. gasseri and L. salivarius, was observed following administration of a moderate-dose BLS mix rather than a low- or high-dose BLS mix during F4+ ETEC infection. Certain probiotic Lactobacillus strains are known to exhibit attributes related to immune modulation, colonization resistance, intestinal barrier homeostasis, and pathogen antagonism (29). In pigs, administration of L. salivarius UCC118 attenuates the incidence and duration of diarrhea induced by Salmonella enterica serovar Typhimurium (30). Production of the bacteriocin Abp 118 by L. salivarius leads to a reduction in the proportion of species of the genus Bacteroides in the microbiota of pigs (31). However, our previous studies demonstrated that excessive consumption of the probiotic L. rhamnosus GG may disturb the established microbial ecosystem and induce a strong proinflammatory response in weaned pigs (11, 15).
Clostridia were the most prominent spore-forming bacteria of the phylum Firmicutes indigenous to the colonic microbiota of pigs in the present study. Although Clostridia species are traditionally associated with pathogenicity, recent research has shown that some members of the Clostridia can be beneficial to host health. Precision microbiome reconstitution with a human-derived Clostridium scindens strain was shown to restore bile acid-mediated resistance to Clostridium difficile in mice (32). A combination of 17 strains within the Clostridia, including some strains from the human microbiota, synergistically assist in the accumulation of CD4+ FOXP3+ regulatory T (Treg) cells in the colon lamina propria in germfree mice and also ameliorate colitis and allergic diarrhea (33). Dietary supplementation with Bacillus coagulans increases populations of Clostridium lituseburense in elderly volunteers (34). Interestingly, administration of low-dose BLS mix increases the proportion of species within the Clostridium genus of the family Clostridiaceae. It appears that orally administered BLS mix ameliorates F4+ ETEC-induced enteritis in part through increases in the abundance of various Clostridium species, which in turn leads to an increase in the percentage of CD4+ FOXP3+ Treg cells in MUC4-resistant pigs following F4+ ETEC infection (10). As such, the effects of the BLS mix defined probiotic in ameliorating E. coli-induced enteritis are not solely restricted to the gut microbiota and the probiotics, as various Clostridium species appear to play a pivotal role in initiating the BLS mix-mediated signaling cascade that leads to activation of Treg cells. Further work is needed to determine which probiotic Clostridium species in the pig microbiota could be exploited for tailored manipulation of intestinal immune disorders and as a robust therapeutic option for individuals at risk of enteric infection.
Increases in the abundance of members of the Ruminococcaceae within the class Clostridia have been observed in inflamed colonic tissues of patients with colitis (35). We consistently found increases in the proportions of species within the genera Acetanaerobacterium and Sporobacter of the family Ruminococcaceae in pigs challenged with F4+ ETEC but not in pigs pretreated with BLS mix. Enrichment of Acetanaerobacterium in the fecal microbiota of premenopausal women is associated with high enterolactone production, which is negatively correlated with adiposity (36) and contributes to metabolic syndrome (37). These findings suggest that both Acetanaerobacterium and Sporobacter may play a detrimental role in gut health.
In pigs, the ileal mucosa harbors greater bacterial diversity than the lumen and has a makeup similar to that of the mucosa of the large intestine, suggesting that mucosal microbes of the ileum serve as an inoculum for the large intestine (12). High-dose BLS mix treatment increases the abundance of members of the phylum Proteobacteria during F4+ ETEC infection, raising the possibility that excessive BLS mix treatment increases the risk for enteritis. It has been reported that mice harboring high levels of Proteobacteria and TM7 bacteria have a transmissible thin and easily penetrable mucus layer (38). High levels of Proteobacteria, especially enterobacterial species such as E. coli, may contribute to a thinner and more penetrable mucus layer, increasing the risk of chronic colitis (39). Research involving murine colitis models and patients with ulcerative colitis indicate that MUC2, the major mucin secreted by the intestinal epithelium, is degraded by ETEC via a secreted serine protease, EatA (40), enabling the bacteria to penetrate the normally impenetrable mucus layer and reach the epithelium, triggering an inflammatory response (41).
In mice, interleukin-10 (IL-10) aids in preserving the mucus barrier in the intestine and alleviates colitis by preventing the misfolding of MUC2 and maintaining mucin production by GCs (42). Increased secretion of granular MUC2 by GCs in mice lacking the Tata element modulatory factor (TMF/ARA160) facilitates the growth of beneficial Lactobacillus species and uncultured members of the Ruminococcaceae and Roseburia, thereby endowing these mice with a transmissible reduced sensitivity to induced colitis (43). In the present study, administration of moderate-dose BLS mix increased the expression of MUC2 mRNA in the ileum, facilitating expansion of Lactobacillus populations and in turn enhancing the mucus barrier and activating the intestinal immune response to F4+ ETEC challenge. Nevertheless, there is a risk that excessive expansion of Lactobacillus populations may negate the preventative effects, thus decreasing the prophylactic benefits against potential enteric pathogens (15, 44). Our data suggest that a BLS mix regulates synergetic signals resulting from the specific alterations in the intestinal microbiota and mucus production, thus inducing an immune response and inflammation.
The mucus layer produced by GCs separates the luminal microbiota from direct contact with epithelial cells and serves as the “gatekeeper” of the intestinal mucosal immune system (45). The number of GCs transiently increases in the jejunum of germfree mice conventionalized with fecal microbiota derived from conventionally raised mice (46). The number of GCs decreased in the ileum of pigs infected with F4+ ETEC but not in pigs pretreated with BLS mix. In addition, administration of the moderate-dose BLS mix increased the number of GCs in the ileum during F4+ ETEC infection. Consistent with our results, B. subtilis pretreatment reduces the severity of Citrobacter rodentium-induced diarrhea in mice, partly through inhibition of GC loss in the colon (47). Furthermore, Bacteroides thetaiotaomicron increases the number of GCs and the expression of mucin genes in gnotobiotic rats, whereas Faecalibacterium prausnitzii diminishes this effect in a process involving acetate and butyrate metabolism (48). However, increased GC hyperplasia and mucus production may also be an indicator of inflammation (49). In the jejunum, no difference was found in the counts of GCs, regardless of treatment. The low-pH environment in the jejunum may not be conducive to F4+ ETEC colonization. In this study, the count of coliform bacteria in the ileum was 10 times higher than that in the jejunum, and high-dose BLS mix supplementation decreased the number of lactobacilli in the ileum. The microbiota disturbance may amplify the difference in GC responses to F4+ ETEC challenge and BLS mix intervention in the ileum. Investigation of the jejunal or ileal microbiota profile is necessary in future studies to better understand the relevance of gut microbiota change and GC function to F4+ ETEC challenge. In germfree mice, the mucus layer of the small intestine fails to detach from the GCs, as they cannot shed the metalloprotease meprin β into the luminal mucus to cleave and release MUC2 mucin (50), indicating that the gut microbiota is important for the formation of a normal mucus barrier. In pigs pretreated with high-dose BLS mix, MUC2 mucin anchored to GCs may fail to release into the lumen due to decreased bacterial counts, thus weakening the mucus barrier. Our data indicate that the increase in numbers of GCs may constitute part of an innate defense mechanism in response to the exogenous addition of bacteria and that the gut microbiota may be a determinant for modifying the GCs. However, the primary results of this study require further confirmation with analysis of goblet cell function and bacterial diversity in the same intestine sites, considering that location-specific microbial communities vary along the intestinal tract of pigs (17).
In general, Atoh1 and Notch/Hes play opposing roles in promoting the differentiation of secretory versus absorptive epithelial cells. Notch activation in differentiating progenitors directs expression of Hes proteins that repress Atoh1 and therefore allow differentiation into absorptive enterocytes, whereas inhibition of Notch/Hes signaling allows for expression of Atoh1, which directs secretory lineage commitment and differentiation (16). Administration of moderate-dose BLS mix upregulated Atoh1 mRNA expression in the ileum, whereas high-dose BLS mix treatment inhibited Atoh1 expression. However, it has also been reported that the expression of Hes1 and Atoh1 is lower in conventionalized mice than in germfree mice (51). Further research is needed to confirm how changes in the gut microbiota associated with administration of the probiotic BLS mix mediate GC fate via Hes1/Atoh1 interplay.
In conclusion, oral administration of the probiotic BLS mix enables deliberate reprogramming of the gut microbiota, characterized by increased populations of certain Clostridium, Lactobacillus, and Turicibacter species in the mucosa of the colon, with a corresponding increase in the number of GCs in the ileum as a result of upregulation of Atoh1 expression (Fig. 7). Upregulated Atoh1 expression in turn increases MUC2 production in the ileum, thus preserving the mucus barrier and enhancing the host defense against enteropathogenic bacteria. However, excessive consumption of BLS mix may increase the risk of enteritis, in part through disruption of colonic microbial ecology, which is characterized by expanded representation of Proteobacteria species accompanied by impaired GC function in the ileum. The benefit and cost of a given antibiotic alternative for a desired outcome must be weighed. Probiotic BLS mix serves as an important strategy and alternative to antibiotics for controlling enteric pathogen infection in weaned pigs with minimized costs under commercial growth conditions, considering the development of antibiotic-resistant pathogens associated with enteric diseases, as well as increases in the antibiotic resistance gene pool in the swine microbiome (52). It is also important to note that the complex diversity and unknown functional interactions between the gut microbiota impede the effort to clearly explain how E. coli and probiotic BLS mix exert detrimental/beneficial effects by affecting the gut microbiota and result in some inconsistency between the gut microbiota changes and clinical symptoms. Our findings may facilitate the identification and development of probiotic strains for use in preventing enteric infections.
FIG 7.
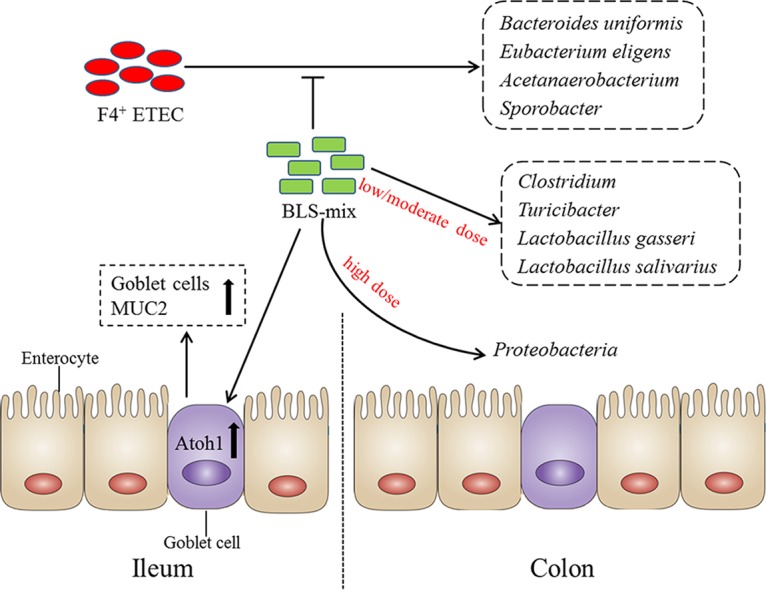
A proposed model for the BLS mix reprogramming of the colonic microbiota and regulating the ileal goblet cell function. In this proposed model, F4+ ETEC induced an increase in the populations of Bacteroides uniformis, Eubacterium eligens, Acetanaerobacterium, and Sporobacter in the colonic mucosa of MUC4-resistant weaned pigs; however, administration of BLS mix attenuated this increase. Orally fed low-dose BLS mix increased the Clostridium and Turicibacter populations following F4+ ETEC challenge. Lactobacillus gasseri and L. salivarius populations increased after administration of moderate-dose BLS mix during E. coli infection. The beneficial effects of BLS mix were due in part to expansion of certain Clostridium, Lactobacillus, and Turicibacter populations, with a corresponding increase in the number of goblet cells in the ileum via upregulated Atoh1 expression, in turn increasing MUC2 production, thus preserving the mucus barrier and enhancing host defenses against enteropathogenic bacteria. However, excessive BLS mix consumption may increase the risk for enteritis, partly through disruption of colonic microbial ecology, characterized by expansion of Proteobacteria and impaired goblet cell function in the ileum.
MATERIALS AND METHODS
Ethics statement.
All animals were treated in strict accordance with the Guidelines for Laboratory Animal Use and Care from the Chinese Center for Disease Control and Prevention and the Rules for Medical Laboratory Animals (1998) from the Chinese Ministry of Health, under protocol CAU-AEC-2013-073, approved by the Animal Ethics Committee of the China Agricultural University. All surgeries were performed under sodium pentobarbital anesthesia, and every effort was made to minimize suffering.
Animals.
A total of 30 MUC4-resistant crossbred (Landrace × Large White) piglets of mixed gender were used in this study (10). These piglets weaned at 21 days of age and weighed 7.10 ± 0.74 kg. Prior to the start of the trial, no clinical signs of diarrhea or other diseases were observed in any of the piglets. The pigs were weighed before the start of the trial (day 0), at day 8 (prechallenge), and at day 15 (when sacrificed). The individual feed intake of each pig was recorded.
Bacterial strains.
The probiotic mixture BioPlus YC, containing B. licheniformis (DSM 5749) and B. subtilis (DSM 5750) at a minimum concentration of 3.2 × 10⁹ viable spores/g, was kindly provided by Chr. Hansen A/S (Hørsholm, Denmark).
The F4-expressing ETEC strain (F4+ ETEC; serotype O149:K91, K88ac) was obtained from the China Veterinary Culture Collection Center and grown in Luria-Bertani medium (Oxoid, Basingstoke, England). The previous work demonstrated that this strain was positive for virulence factors STb, LT, Stx2e, attaching and effacing intimin (eae), translocated intimin receptor (tir), escV, and E. coli-secreted protein A (espA) (10).
Experimental design.
The experimental model and treatment regimens have been described in detail elsewhere (10, 18). In brief, on the day of weaning (day 0), the pigs were divided into five groups of six animals per group and each group received a different treatment, as follows: (i) CONT group, oral administration of sterile physiological saline; (ii) ETEC group, oral administration of sterile physiological saline and oral challenge with F4+ ETEC (1 × 10¹⁰ CFU/day); (iii) LDBE group, oral administration of low-dose probiotic mixture (3.9 × 10⁸ CFU/day) and oral challenge with F4+ ETEC; (iv) MDBE group, oral administration of moderate-dose probiotic mixture (7.8 × 10⁸ CFU/day) and oral challenge with F4+ ETEC; and (v) HDBE group, oral administration of high-dose probiotic mixture (3.9 × 10⁹ CFU/day) and oral challenge with F4+ ETEC.
Clinical examinations.
The health of each animal was closely monitored throughout the experiment. Rectal temperature and severity of diarrhea were measured as previously described (10).
Sampling of fecal and intestinal lumen contents.
For microbial culturing, fresh fecal samples were collected from all animals on days 1, 4, 7, 9, and 12. The lumen content from the midjejunum, distal ileum, cecum, and midcolon were immediately collected after sacrifice. For quantitative PCR (qPCR) analysis and high-throughput 16S rRNA gene sequencing analysis, the transverse colon segments were harvested immediately after euthanasia and tied off with string ligatures. All luminal contents were placed in cryovials without preservative, immediately snap-frozen in liquid nitrogen, and then stored in their original tubes at −80°C until DNA extraction.
Genomic DNA extraction and purification.
Total genomic DNA was extracted from 200 mg of colonic contents using a QIAamp DNA stool minikit (Qiagen, Hilden, Germany) according to the manufacturer's instructions, with slight modifications. Briefly, to ensure proper lysis of bacteria, the initial heating step was supplemented with three 5-min cycles of heating at 95°C. Subsequent procedures were performed according to the manufacturer's protocol. DNA was stored at −20°C until further use.
16S rRNA gene sequencing.
Genomic DNA was amplified by a two-step PCR enrichment of the 16S rRNA gene V4 hypervariable region-encoding sequences from each sample with primers 515F/806R (Table 1), which were modified by the addition of barcodes for multiplexing using a HotStarTaq Plus master mix kit (Qiagen) according to a custom Illumina preparation protocol. Amplicons generated from each sample were excised from 1.5% agarose gels and subsequently purified using an AxyPrep DNA gel extraction kit (Axygen Biosciences, Union City, CA) and quantified using a QuantiFluor ST fluorometer (Promega, Madison, WI). A composite sample library for sequencing was created by combining equimolar ratios of amplicons from the individual samples; the composite sample library was cleaned using an UltraClean-htp 96-well PCR cleanup kit (Mo Bio Laboratories, Carlsbad, CA). Pooled amplicons were paired-end sequenced (PE 2 × 250) using an Illumina MiSeq platform according to standard protocols.
TABLE 1.
Sequences of oligonucleotides used in this study, lengths of the respective PCR products, and gene accession numbers
| Gene type and/or producta | Primer |
Product size (bp) | Accession no. | |
|---|---|---|---|---|
| Directionb | Sequence (5′→3′) | |||
| Bacterial genes | ||||
| V4 region of 16S rRNA gene | F | GTGCCAGCMGCCGCGGTAA | 254 | NR_102804 |
| R | GGACTACHVGGGTWTCTAAT | |||
| Total bacteria | F | ACTCCTACGGGAGGCAGCAG | 197 | NR_074891 |
| R | ATTACCGCGGCTGCTGG | |||
| Lactobacilli | F | GCAGCAGTAGGGAATCTTCCA | 145 | NC_004567 |
| R | GCATTYCACCGCTACACATG | |||
| Pig genes | ||||
| Hes1 | F | GAGAGGCGGCAAAGGTATCC | 76 | NM_001195231 |
| R | TTGGGGATGAGGAAGGCAAAA | |||
| Atoh1 | F | GGAAGGTGACAGAAACTCGGA | 105 | XM_003129319 |
| R | GCAGAAGGGAAAAGGTTGCG | |||
| MUC2 | F | ACCCGCACTACGTCACCTTC | 150 | BX671371 |
| R | GGCAGGACACCTGGTCATTG | |||
| GAPDH | F | CCAGAACATCATCCCTGCTT | 229 | NM_001206359 |
| R | GTCCTCAGTGTAGCCCAGGA | |||
| β-Actin | F | CTCTTCCAGCCCTCCTTCCT | 103 | XM_003357928 |
| R | GCGTAGAGGTCCTCCTGATGT | |||
| HPRT | F | GTGATAGATCCATTCCTATGACTGTAGA | 104 | U69731 |
| R | TGAGAGATCATCTCCACCAATTACTT | |||
Hes1, hairy/enhancer of split 1; Atoh1, atonal homolog 1; MUC2, mucin 2; GADPH, glyceraldehyde-3-phosphate dehydrogenase; HPRT, hypoxanthine phosphoribosyl-transferase.
F, forward; R, reverse.
Phylotype analysis.
Raw fastq files were demultiplexed and quality filtered using the Quantitative Insights Into Microbial Ecology (QIIME) pipeline (53) with the following criteria: (i) the 250-bp reads were truncated at any site receiving an average quality score of <20 over a 50-bp sliding window, and the truncated reads that were shorter than 50 bp were discarded; (ii) there were exact barcode matching and a maximum of two nucleotide mismatches to primer sequences; (iii) there were no ambiguous bases; and (iv) only sequences that overlapped more than 10 bp were assembled according to their overlap sequence. Reads that could not be assembled were discarded.
Chimeras were checked and excluded against the Silva Gold reference database (release 115; https://www.arb-silva.de/) using the Uchime algorithm (version 4.2.40; http://drive5.com/usearch/manual/uchime_algo.html). The resulting high-quality reads were clustered into OTUs using a closed-reference OTU picking protocol with application of Usearch 6.1 methodology (version 6.1.544; http://qiime.org/) to search sequences against a subset of the Silva 16S sequence database filtered at a pairwise distance of 97% sequence identity. The most abundant sequences from each OTU were selected as representative sequences and assigned to taxonomic classification against the Silva (SSU117/119) database, clustered at a bootstrap cutoff of 80% via the Ribosomal Database Project (RDP) naive Bayesian classifier (version 2.2; http://sourceforge.net/projects/rdp-classifier). Alpha diversity metrics (Shannon and Simpson), richness (ACE and Chao1), and Good's coverage and rarefaction were calculated to assess bacterial diversity using the mothur program (version 1.31.2; http://www.mothur.org/wiki/Main_Page). A heat map was generated on the basis of relative OTU abundance using R software (version 3.2.1; https://www.r-project.org/). Phylogenetic beta diversity distances, including unweighted and weighted UniFrac, Bray-Curtis distances, and Abund_Jaccard distances, were measured using QIIME. Principal-component analysis (PCA) and principal-coordinate analysis (PCoA) based on unweighted UniFrac distances were performed to visualize the similarities or dissimilarities of variables that best represented the pairwise distances between sample groups. Before computation of beta diversity distances, samples were randomly subsampled down to the lowest number of reads.
Quantification of total bacteria and lactobacilli by qPCR.
Quantification of colonic total bacterial and Lactobacillus 16S rRNA genes was performed using an ABI 7500 real-time PCR system (Applied Biosystems, Foster City, CA). Each reaction mixture (20 μl) contained 2 μl of DNA template (100 ng of DNA), 1 μl of each primer (0.5 pmol/μl, final concentration), 6 μl of distilled water (dH2O), and 10 μl of SYBR Premix DimerEraser (TakaRa Biotechnology Inc., Dalian, China). Initial denaturation (30 s, 95°C, 1 cycle) was followed by 30 to 40 cycles of denaturation at 95°C for 15 s, annealing at 62°C for 30 s, and extension at 72°C for 30 s. In the melting curve stage, the reaction conditions included 1 cycle of 95°C for 15 s and 1 cycle of 60°C for 1 min. Product specificity was confirmed by a stepwise increase of the temperature from 52 to 95°C with a plate read every 0.5°C (at a rate of 0.5°C per 10 s). Amplicon size was verified by agarose gel electrophoresis. Primer sequences for total bacteria and lactobacilli are listed in Table 1. Bacterial DNA standards consisted of serial 10-fold dilutions (ranging from 100 to 1010 gene copies μl−1) of known amounts of purified PCR amplicons, which were amplified from PCRs using genomic DNA from colonic contents and the same primers listed in Table 1. R2 values for the standard curves were >0.99. Slope values for total bacteria and lactobacilli were −3.41 and −3.36, respectively, giving estimated amplification efficiencies of 96.5% and 98.4%, respectively. Samples, standards, and nontemplate controls were run in triplicate.
Bacterial enumeration.
One gram of fresh fecal sample or gastrointestinal contents from each animal was homogenized in 9 ml of sterile saline solution, and serial dilutions were then plated on eosin-methylene blue (EMB) selective agar plates for coliform culture and de Man, Rogosa, and Sharpe (MRS) agar plates for Lactobacillus culture (Beijing Land Bridge Technology Co., Beijing, China). EMB agar plates were incubated for 24 h at 37°C under aerobic conditions, whereas MRS agar plates were incubated under anaerobic conditions for 48 h at 37°C. For the analysis of spore count, the fecal samples were stored at −20°C. The number of viable B. subtilis and B. licheniformis spores in fecal samples was determined by plate count in tryptone soy agar (Beijing Aoboxing Bio-tech Co., Beijing, China) with incubation for 24 h at 37°C under aerobic conditions, after heat treatment at 80°C for 15 min. Results are expressed as log10 CFU/g feces or colonic contents. All counts were performed in triplicate.
Alcian blue/periodic acid-Schiff staining and subsequent quantification.
For mucin-containing GC analysis, proximal, middle, and distal segments of the jejunum and ileum were rinsed with phosphate-buffered saline (PBS) immediately after they were opened and then segmentally divided and immersed in 4% paraformaldehyde for a minimum of 24 h. Jejunal and ileal tissues were then embedded in paraffin wax and cut into 3-μm-thick sections. Subsequently, representative sections were stained with alcian blue (AB) for acidic mucin at pH 2.5 or periodic acid-Schiff (PAS) stain for neutral mucin detection (Solarbio, Beijing, China), as described by the manufacturer. For quantification of AB/PAS staining, each segment was visualized and photographed using an Olympus BX41 microscope (Olympus, Tokyo, Japan) equipped with a Canon EOS 550D camera head (Canon, Tokyo, Japan). Positively stained GCs and other absorptive epithelial cells were counted in a blind manner in a total of 10 crypts per piglet. Results are presented as the average ratio of GC count to the count of GCs plus other absorptive epithelial cells from the sections of proximal, middle, and distal jejunum or ileum.
Quantitative real-time PCR.
Total RNA was extracted from jejunal and ileal tissue samples using TRIzol reagent (Invitrogen). Quantitative real-time PCR was performed using SYBR Premix DimerEraser (TaKaRa Biotechnology Inc.) on an ABI 7500 real-time PCR system (Applied Biosystems). Primer sequences are listed in Table 1. A nontemplate control of nuclease-free water was included in each run.
Relative quantification of mRNA expression was assessed by normalizing the cycle threshold (CT) values of the target genes to the geometric mean of the CT values of three selected housekeeping genes, those encoding glyceraldehyde-3-phosphate dehydrogenase (GAPDH), β-actin, and hypoxanthine phosphoribosyl-transferase (HPRT). Results are presented as fold change using the 2−ΔΔCT method (10).
Statistical analysis.
Statistical predictors of community composition were tested using analysis of similarity (ANOSIM) and a permutational multivariate analysis of variance (ADONIS) test implemented in QIIME based on the unweighted and weighted UniFrac, Bray-Curtis distances, and Abund_Jaccard distances. P values were calculated using 999 permutations. By this procedure, we determined community similarity on the basis of those taxa that were highly represented in each of the samples.
The SAS statistical software package, version 9.3 (SAS Institute Inc., Cary, NC), was used for statistical analysis. For data of relative abundance of taxa at the phylum, class, family, genus, and species levels from 16S rRNA gene sequencing, normal distribution and homogeneity of variance were tested with the UNIVARIATE (Shapiro-Wilk test) and HOVTEST procedures. Nonnormally distributed data were analyzed using the PROC GLIMMIX procedure through Poisson or negative binomial distributions that were fitted to the data. Normalized data were tested with a mixed general linear model using PROC MIXED procedures. Differences between the least-square means were compared using Tukey's honestly significant difference post hoc test with multiple testing corrections applied according to the Benjamini-Hochberg's false discovery rate (q value), based on global P values of the variables compared. A P value of <0.05 with a q value of <0.05 was considered indicative of significance.
Statistical evaluation of the incidence of diarrhea was performed using Pearson's chi-square test. The nonparametric Friedman's test using procedure FREQ was carried out to compare nonnormally distributed and repeated-measure diarrhea scores. Data from rectal temperature, culture-dependent bacterium enumeration, qPCR, and real-time PCR were analyzed using the PROC MIXED procedure. This statistical model included the effects of treatment, litter, and sampling time, different intestinal sections, interactions between treatment, and sampling time, or different intestinal sections and the random within-treatment effect in the pigs. In addition, a repeated-measure analysis with a first-order autoregressive covariance structure was conducted to determine the effects of treatment on fecal bacterium counts over time within a pig. Differences between the least-square means were compared using Tukey's honestly significant difference post hoc test and were considered significant when the P value was <0.05.
Analysis for the normal distribution and comparisons of the goblet cell counts were carried out using the UNIVARIATE and PROC GLIMMIX procedures, as described above.
Accession number(s).
The raw 16S rRNA gene sequences have been deposited in the NCBI Sequence Read Archive database (accession number SRR2177683).
Supplementary Material
ACKNOWLEDGMENTS
We declare that no authors had any conflicts of interest.
This work was supported by grants from the National Natural Science Foundation of China (project no. 31372493 and 31472242) and the Special Fund for Agro-Scientific Research in the Public Interest (China; project no. 201403054).
Footnotes
Supplemental material for this article may be found at https://doi.org/10.1128/AEM.02747-16.
REFERENCES
- 1.Schroyen M, Stinckens A, Verhelst R, Niewold T, Buys N. 2012. The search for the gene mutations underlying enterotoxigenic Escherichia coli F4ab/ac susceptibility in pigs: a review. Vet Res 43:70. doi: 10.1186/1297-9716-43-70. [DOI] [PMC free article] [PubMed] [Google Scholar]
- 2.Croxen MA, Finlay BB. 2010. Molecular mechanisms of Escherichia coli pathogenicity. Nat Rev Microbiol 8:26–38. doi: 10.1038/nrmicro2265. [DOI] [PubMed] [Google Scholar]
- 3.Moonens K, Van den Broeck I, Okello E, Pardon E, De Kerpel M, Remaut H, De Greve H. 2015. Structural insight in the inhibition of adherence of F4 fimbriae producing enterotoxigenic Escherichia coli by llama single domain antibodies. Vet Res 46:14. doi: 10.1186/s13567-015-0151-x. [DOI] [PMC free article] [PubMed] [Google Scholar]
- 4.Dutta S, Pazhani GP, Nataro JP, Ramamurthy T. 2015. Heterogenic virulence in a diarrheagenic Escherichia coli: evidence for an EPEC expressing heat-labile toxin of ETEC. Int J Med Microbiol 305:47–54. doi: 10.1016/j.ijmm.2014.10.006. [DOI] [PubMed] [Google Scholar]
- 5.Nyholm O, Heinikainen S, Pelkonen S, Hallanvuo S, Haukka K, Siitonen A. 2015. Hybrids of shigatoxigenic and enterotoxigenic Escherichia coli (STEC/ETEC) among human and animal isolates in Finland. Zoonoses Public Health 62:518–524. doi: 10.1111/zph.12177. [DOI] [PubMed] [Google Scholar]
- 6.Comery R, Thanabalasuriar A, Garneau P, Portt A, Boerlin P, Reid-Smith RJ, Harel J, Manges AR, Gruenheid S. 2013. Identification of potentially diarrheagenic atypical enteropathogenic Escherichia coli strains present in Canadian food animals at slaughter and in retail meats. Appl Environ Microbiol 79:3892–3896. doi: 10.1128/AEM.00182-13. [DOI] [PMC free article] [PubMed] [Google Scholar]
- 7.Fairbrother JM, Nadeau É, Gyles CL. 2005. Escherichia coli in postweaning diarrhea in pigs: an update on bacterial types, pathogenesis, and prevention strategies. Anim Health Res Rev 6:17–39. doi: 10.1079/AHR2005105. [DOI] [PubMed] [Google Scholar]
- 8.Jensen GM, Frydendahl K, Svendsen O, Jorgensen CB, Cirera S, Fredholm M, Nielsen JP, Moller K. 2006. Experimental infection with Escherichia coli O149:F4ac in weaned piglets. Vet Microbiol 115:243–249. doi: 10.1016/j.vetmic.2006.01.002. [DOI] [PubMed] [Google Scholar]
- 9.Rasschaert K, Verdonck F, Goddeeris BM, Duchateau L, Cox E. 2007. Screening of pigs resistant to F4 enterotoxigenic Escherichia coli (ETEC) infection. Vet Microbiol 123:249–253. doi: 10.1016/j.vetmic.2007.02.017. [DOI] [PubMed] [Google Scholar]
- 10.Zhou D, Zhu YH, Zhang W, Wang ML, Fan WY, Song D, Yang GY, Jensen BB, Wang JF. 2015. Oral administration of a select mixture of Bacillus probiotics generates Tr1 cells in weaned F4ab/acR− pigs challenged with an F4+ ETEC/VTEC/EPEC strain. Vet Res 46:95. doi: 10.1186/s13567-015-0223-y. [DOI] [PMC free article] [PubMed] [Google Scholar]
- 11.Li XQ, Zhu YH, Zhang HF, Yue Y, Cai ZX, Lu QP, Zhang L, Weng XG, Zhang FJ, Zhou D, Yang JC, Wang JF. 2012. Risks associated with high-dose Lactobacillus rhamnosus in an Escherichia coli model of piglet diarrhoea: intestinal microbiota and immune imbalances. PLoS One 7:e40666. doi: 10.1371/journal.pone.0040666. [DOI] [PMC free article] [PubMed] [Google Scholar]
- 12.Looft T, Allen HK, Cantarel BL, Levine UY, Bayles DO, Alt DP, Henrissat B, Stanton TB. 2014. Bacteria, phages and pigs: the effects of in-feed antibiotics on the microbiome at different gut locations. ISME J 8:1566–1576. doi: 10.1038/ismej.2014.12. [DOI] [PMC free article] [PubMed] [Google Scholar]
- 13.Kim HB, Isaacson RE. 2015. The pig gut microbial diversity: understanding the pig gut microbial ecology through the next generation high throughput sequencing. Vet Microbiol 177:242–251. doi: 10.1016/j.vetmic.2015.03.014. [DOI] [PubMed] [Google Scholar]
- 14.Baker AA, Davis E, Spencer JD, Moser R, Rehberger T. 2013. The effect of a Bacillus-based direct-fed microbial supplemented to sows on the gastrointestinal microbiota of their neonatal piglets. J Anim Sci 91:3390–3399. doi: 10.2527/jas.2012-5821. [DOI] [PubMed] [Google Scholar]
- 15.Zhu YH, Li XQ, Zhang W, Zhou D, Liu HY, Wang JF. 2014. Dose-dependent effects of Lactobacillus rhamnosus on serum interleukin-17 production and intestinal T-cell responses in pigs challenged with Escherichia coli. Appl Environ Microbiol 80:1787–1798. doi: 10.1128/AEM.03668-13. [DOI] [PMC free article] [PubMed] [Google Scholar]
- 16.Noah TK, Shroyer NF. 2013. Notch in the intestine: regulation of homeostasis and pathogenesis. Annu Rev Physiol 75:263–288. doi: 10.1146/annurev-physiol-030212-183741. [DOI] [PubMed] [Google Scholar]
- 17.Mann E, Schmitz-Esser S, Zebeli Q, Wagner M, Ritzmann M, Metzler-Zebeli BU. 2014. Mucosa-associated bacterial microbiome of the gastrointestinal tract of weaned pigs and dynamics linked to dietary calcium-phosphorus. PLoS One 9:e86950. doi: 10.1371/journal.pone.0086950. [DOI] [PMC free article] [PubMed] [Google Scholar]
- 18.Yang GY, Zhu YH, Zhang W, Zhou D, Zhai CC, Wang JF. 2016. Influence of orally fed a select mixture of Bacillus probiotics on intestinal T-cell migration in weaned MUC4 resistant pigs following Escherichia coli challenge. Vet Res 47:71. doi: 10.1186/s13567-016-0355-8. [DOI] [PMC free article] [PubMed] [Google Scholar]
- 19.Kim HB, Borewicz K, White BA, Singer RS, Sreevatsan S, Tu ZJ, Isaacson RE. 2012. Microbial shifts in the swine distal gut in response to the treatment with antimicrobial growth promoter, tylosin. Proc Natl Acad Sci U S A 109:15485–15490. doi: 10.1073/pnas.1205147109. [DOI] [PMC free article] [PubMed] [Google Scholar]
- 20.Yatsunenko T, Rey FE, Manary MJ, Trehan I, Dominguez-Bello MG, Contreras M, Magris M, Hidalgo G, Baldassano RN, Anokhin AP, Heath AC, Warner B, Reeder J, Kuczynski J, Caporaso JG, Lozupone CA, Lauber C, Clemente JC, Knights D, Knight R, Gordon JI. 2012. Human gut microbiome viewed across age and geography. Nature 486:222–227. doi: 10.1038/nature11053. [DOI] [PMC free article] [PubMed] [Google Scholar]
- 21.Niu Q, Li P, Hao S, Zhang Y, Kim SW, Li H, Ma X, Gao S, He L, Wu W, Huang X, Hua J, Zhou B, Huang R. 2015. Dynamic distribution of the gut microbiota and the relationship with apparent crude fiber digestibility and growth stages in pigs. Sci Rep 5:9938. doi: 10.1038/srep09938. [DOI] [PMC free article] [PubMed] [Google Scholar]
- 22.Turnbaugh PJ, Ley RE, Mahowald MA, Magrini V, Mardis ER, Gordon JI. 2006. An obesity-associated gut microbiome with increased capacity for energy harvest. Nature 444:1027–1031. doi: 10.1038/nature05414. [DOI] [PubMed] [Google Scholar]
- 23.Youmans BP, Ajami NJ, Jiang ZD, Campbell F, Wadsworth WD, Petrosino JF, DuPont HL, Highlander SK. 2015. Characterization of the human gut microbiome during travelers' diarrhea. Gut Microbes 6:110–119. doi: 10.1080/19490976.2015.1019693. [DOI] [PMC free article] [PubMed] [Google Scholar]
- 24.Rettedal E, Vilain S, Lindblom S, Lehnert K, Scofield C, George S, Clay S, Kaushik RS, Rosa AJ, Francis D, Brozel VS. 2009. Alteration of the ileal microbiota of weanling piglets by the growth-promoting antibiotic chlortetracycline. Appl Environ Microbiol 75:5489–5495. doi: 10.1128/AEM.02220-08. [DOI] [PMC free article] [PubMed] [Google Scholar]
- 25.Rossi G, Pengo G, Caldin M, Palumbo Piccionello A, Steiner JM, Cohen ND, Jergens AE, Suchodolski JS. 2014. Comparison of microbiological, histological, and immunomodulatory parameters in response to treatment with either combination therapy with prednisone and metronidazole or probiotic VSL#3 strains in dogs with idiopathic inflammatory bowel disease. PLoS One 9:e94699. doi: 10.1371/journal.pone.0094699. [DOI] [PMC free article] [PubMed] [Google Scholar]
- 26.Mahowald MA, Rey FE, Seedorf H, Turnbaugh PJ, Fulton RS, Wollam A, Shah N, Wang C, Magrini V, Wilson RK, Cantarel BL, Coutinho PM, Henrissat B, Crock LW, Russell A, Verberkmoes NC, Hettich RL, Gordon JI. 2009. Characterizing a model human gut microbiota composed of members of its two dominant bacterial phyla. Proc Natl Acad Sci U S A 106:5859–5864. doi: 10.1073/pnas.0901529106. [DOI] [PMC free article] [PubMed] [Google Scholar]
- 27.Elinav E, Strowig T, Kau AL, Henao-Mejia J, Thaiss CA, Booth CJ, Peaper DR, Bertin J, Eisenbarth SC, Gordon JI, Flavell RA. 2011. NLRP6 inflammasome regulates colonic microbial ecology and risk for colitis. Cell 145:745–757. doi: 10.1016/j.cell.2011.04.022. [DOI] [PMC free article] [PubMed] [Google Scholar]
- 28.Gauffin Cano P, Santacruz A, Moya A, Sanz Y. 2012. Bacteroides uniformis CECT 7771 ameliorates metabolic and immunological dysfunction in mice with high-fat-diet induced obesity. PLoS One 7:e41079. doi: 10.1371/journal.pone.0041079. [DOI] [PMC free article] [PubMed] [Google Scholar]
- 29.Zhang W, Zhu YH, Yang JC, Yang GY, Zhou D, Wang JF. 2015. A selected Lactobacillus rhamnosus strain promotes EGFR-independent Akt activation in an enterotoxigenic Escherichia coli K88-infected IPEC-J2 cell model. PLoS One 10:e0125717. doi: 10.1371/journal.pone.0125717. [DOI] [PMC free article] [PubMed] [Google Scholar]
- 30.Casey PG, Gardiner GE, Casey G, Bradshaw B, Lawlor PG, Lynch PB, Leonard FC, Stanton C, Ross RP, Fitzgerald GF, Hill C. 2007. A five-strain probiotic combination reduces pathogen shedding and alleviates disease signs in pigs challenged with Salmonella enterica serovar Typhimurium. Appl Environ Microbiol 73:1858–1863. doi: 10.1128/AEM.01840-06. [DOI] [PMC free article] [PubMed] [Google Scholar]
- 31.Riboulet-Bisson E, Sturme MH, Jeffery IB, O'Donnell MM, Neville BA, Forde BM, Claesson MJ, Harris H, Gardiner GE, Casey PG, Lawlor PG, O'Toole PW, Ross RP. 2012. Effect of Lactobacillus salivarius bacteriocin Abp118 on the mouse and pig intestinal microbiota. PLoS One 7:e31113. doi: 10.1371/journal.pone.0031113. [DOI] [PMC free article] [PubMed] [Google Scholar]
- 32.Buffie CG, Bucci V, Stein RR, McKenney PT, Ling L, Gobourne A, No D, Liu H, Kinnebrew M, Viale A, Littmann E, van den Brink MR, Jenq RR, Taur Y, Sander C, Cross JR, Toussaint NC, Xavier JB, Pamer EG. 2015. Precision microbiome reconstitution restores bile acid mediated resistance to Clostridium difficile. Nature 517:205–208. doi: 10.1038/nature13828. [DOI] [PMC free article] [PubMed] [Google Scholar]
- 33.Atarashi K, Tanoue T, Oshima K, Suda W, Nagano Y, Nishikawa H, Fukuda S, Saito T, Narushima S, Hase K, Kim S, Fritz JV, Wilmes P, Ueha S, Matsushima K, Ohno H, Olle B, Sakaguchi S, Taniguchi T, Morita H, Hattori M, Honda K. 2013. Treg induction by a rationally selected mixture of Clostridia strains from the human microbiota. Nature 500:232–236. doi: 10.1038/nature12331. [DOI] [PubMed] [Google Scholar]
- 34.Nyangale EP, Farmer S, Keller D, Chernoff D, Gibson GR. 2014. Effect of prebiotics on the fecal microbiota of elderly volunteers after dietary supplementation of Bacillus coagulans GBI-30, 6086. Anaerobe 30:75–81. doi: 10.1016/j.anaerobe.2014.09.002. [DOI] [PubMed] [Google Scholar]
- 35.Lavelle A, Lennon G, O'Sullivan O, Docherty N, Balfe A, Maguire A, Mulcahy HE, Doherty G, O'Donoghue D, Hyland J, Ross RP, Coffey JC, Sheahan K, Cotter PD, Shanahan F, Winter DC, O'Connell PR. 2015. Spatial variation of the colonic microbiota in patients with ulcerative colitis and control volunteers. Gut 64:1553–1561. doi: 10.1136/gutjnl-2014-307873. [DOI] [PMC free article] [PubMed] [Google Scholar]
- 36.Hullar MA, Lancaster SM, Li F, Tseng E, Beer K, Atkinson C, Wahala K, Copeland WK, Randolph TW, Newton KM, Lampe JW. 2015. Enterolignan-producing phenotypes are associated with increased gut microbial diversity and altered composition in premenopausal women in the United States. Cancer Epidemiol Biomarkers Prev 24:546–554. doi: 10.1158/1055-9965.EPI-14-0262. [DOI] [PMC free article] [PubMed] [Google Scholar]
- 37.Xu C, Liu Q, Zhang Q, Gu A, Jiang ZY. 2015. Urinary enterolactone is associated with obesity and metabolic alteration in men in the US National Health and Nutrition Examination Survey 2001-10. Br J Nutr 113:683–690. doi: 10.1017/S0007114514004115. [DOI] [PubMed] [Google Scholar]
- 38.Jakobsson HE, Rodriguez-Pineiro AM, Schutte A, Ermund A, Boysen P, Bemark M, Sommer F, Backhed F, Hansson GC, Johansson ME. 2015. The composition of the gut microbiota shapes the colon mucus barrier. EMBO Rep 16:164–177. doi: 10.15252/embr.201439263. [DOI] [PMC free article] [PubMed] [Google Scholar]
- 39.Carvalho FA, Koren O, Goodrich JK, Johansson ME, Nalbantoglu I, Aitken JD, Su Y, Chassaing B, Walters WA, Gonzalez A, Clemente JC, Cullender TC, Barnich N, Darfeuille-Michaud A, Vijay-Kumar M, Knight R, Ley RE, Gewirtz AT. 2012. Transient inability to manage proteobacteria promotes chronic gut inflammation in TLR5-deficient mice. Cell Host Microbe 12:139–152. doi: 10.1016/j.chom.2012.07.004. [DOI] [PMC free article] [PubMed] [Google Scholar]
- 40.Kumar P, Luo Q, Vickers TJ, Sheikh A, Lewis WG, Fleckenstein JM, Payne SM. 2014. EatA, an immunogenic protective antigen of enterotoxigenic Escherichia coli, degrades intestinal mucin. Infect Immun 82:500–508. doi: 10.1128/IAI.01078-13. [DOI] [PMC free article] [PubMed] [Google Scholar]
- 41.Johansson ME, Gustafsson JK, Holmen-Larsson J, Jabbar KS, Xia L, Xu H, Ghishan FK, Carvalho FA, Gewirtz AT, Sjovall H, Hansson GC. 2014. Bacteria penetrate the normally impenetrable inner colon mucus layer in both murine colitis models and patients with ulcerative colitis. Gut 63:281–291. doi: 10.1136/gutjnl-2012-303207. [DOI] [PMC free article] [PubMed] [Google Scholar]
- 42.Hasnain SZ, Tauro S, Das I, Tong H, Chen AC, Jeffery PL, McDonald V, Florin TH, McGuckin MA. 2013. IL-10 promotes production of intestinal mucus by suppressing protein misfolding and endoplasmic reticulum stress in goblet cells. Gastroenterology 144:357–368. doi: 10.1053/j.gastro.2012.10.043. [DOI] [PubMed] [Google Scholar]
- 43.Bel S, Elkis Y, Elifantz H, Koren O, Ben-Hamo R, Lerer-Goldshtein T, Rahimi R, Ben Horin S, Nyska A, Shpungin S, Nir U. 2014. Reprogrammed and transmissible intestinal microbiota confer diminished susceptibility to induced colitis in TMF−/− mice. Proc Natl Acad Sci U S A 111:4964–4969. doi: 10.1073/pnas.1319114111. [DOI] [PMC free article] [PubMed] [Google Scholar]
- 44.Ling Z, Liu X, Jia X, Cheng Y, Luo Y, Yuan L, Wang Y, Zhao C, Guo S, Li L, Xu X, Xiang C. 2014. Impacts of infection with different toxigenic Clostridium difficile strains on faecal microbiota in children. Sci Rep 4:7485. doi: 10.1038/srep07485. [DOI] [PMC free article] [PubMed] [Google Scholar]
- 45.Birchenough GM, Johansson ME, Gustafsson JK, Bergstrom JH, Hansson GC. 2015. New developments in goblet cell mucus secretion and function. Mucosal Immunol 8:712–719. doi: 10.1038/mi.2015.32. [DOI] [PMC free article] [PubMed] [Google Scholar]
- 46.El Aidy S, Merrifield CA, Derrien M, van Baarlen P, Hooiveld G, Levenez F, Dore J, Dekker J, Holmes E, Claus SP, Reijngoud DJ, Kleerebezem M. 2013. The gut microbiota elicits a profound metabolic reorientation in the mouse jejunal mucosa during conventionalisation. Gut 62:1306–1314. doi: 10.1136/gutjnl-2011-301955. [DOI] [PubMed] [Google Scholar]
- 47.Jones SE, Knight KL. 2012. Bacillus subtilis-mediated protection from Citrobacter rodentium-associated enteric disease requires espH and functional flagella. Infect Immun 80:710–719. doi: 10.1128/IAI.05843-11. [DOI] [PMC free article] [PubMed] [Google Scholar]
- 48.Wrzosek L, Miquel S, Noordine ML, Bouet S, Joncquel Chevalier-Curt M, Robert V, Philippe C, Bridonneau C, Cherbuy C, Robbe-Masselot C, Langella P, Thomas M. 2013. Bacteroides thetaiotaomicron and Faecalibacterium prausnitzii influence the production of mucus glycans and the development of goblet cells in the colonic epithelium of a gnotobiotic model rodent. BMC Biol 11:61. doi: 10.1186/1741-7007-11-61. [DOI] [PMC free article] [PubMed] [Google Scholar]
- 49.Trompette A, Gollwitzer ES, Yadava K, Sichelstiel AK, Sprenger N, Ngom-Bru C, Blanchard C, Junt T, Nicod LP, Harris NL, Marsland BJ. 2014. Gut microbiota metabolism of dietary fiber influences allergic airway disease and hematopoiesis. Nat Med 20:159–166. doi: 10.1038/nm.3444. [DOI] [PubMed] [Google Scholar]
- 50.Schüttea A, Ermunda A, Becker-Paulyb C, Johanssona MEV, Rodriguez-Pineiroa AM, Bäckhedc F, Müllerd S, Lottaze D, Bondf JS, Hansson GC. 2014. Microbial-induced meprin β cleavage in MUC2 mucin and a functional CFTR channel are required to release anchored small intestinal mucus. Proc Natl Acad Sci U S A 111:12396–12401. doi: 10.1073/pnas.1407597111. [DOI] [PMC free article] [PubMed] [Google Scholar]
- 51.Becker S, Oelschlaeger TA, Wullaert A, Vlantis K, Pasparakis M, Wehkamp J, Stange EF, Gersemann M. 2013. Bacteria regulate intestinal epithelial cell differentiation factors both in vitro and in vivo. PLoS One 8:e55620. doi: 10.1371/journal.pone.0055620. [DOI] [PMC free article] [PubMed] [Google Scholar]
- 52.Looft T, Johnson TA, Allen HK, Bayles DO, Alt DP, Stedtfeld RD, Sul WJ, Stedtfeld TM, Chai B, Cole JR, Hashsham SA, Tiedje JM, Stanton TB. 2012. In-feed antibiotic effects on the swine intestinal microbiome. Proc Natl Acad Sci U S A 109:1691–1696. doi: 10.1073/pnas.1120238109. [DOI] [PMC free article] [PubMed] [Google Scholar]
- 53.Caporaso JG, Kuczynski J, Stombaugh J, Bittinger K, Bushman FD, Costello EK, Fierer N, Pena AG, Goodrich JK, Gordon JI, Huttley GA, Kelley ST, Knights D, Koenig JE, Ley RE, Lozupone CA, McDonald D, Muegge BD, Pirrung M, Reeder J, Sevinsky JR, Turnbaugh PJ, Walters WA, Widmann J, Yatsunenko T, Zaneveld J, Knight R. 2010. QIIME allows analysis of high-throughput community sequencing data. Nat Methods 7:335–336. doi: 10.1038/nmeth.f.303. [DOI] [PMC free article] [PubMed] [Google Scholar]
Associated Data
This section collects any data citations, data availability statements, or supplementary materials included in this article.