

Abstract
Spinal muscular atrophy (SMA), traditionally described as a predominantly childhood form of motor neurone disease, is the leading genetic cause of infant mortality. Although motor neurones are undoubtedly the primary affected cell type, the severe infantile form of SMA (Type I SMA) is now widely recognised to represent a multisystem disorder where a variety of organs and systems in the body are also affected. Here, we report that the spleen is disproportionately small in the ‘Taiwanese’ murine model of severe SMA (Smn −/− ;SMN2 tg/0), correlated to low levels of cell proliferation and increased cell death. Spleen lacks its distinctive red appearance and presents with a degenerated capsule and a disorganised fibrotic architecture. Histologically distinct white pulp failed to form and this was reflected in an almost complete absence of B lymphocytes necessary for normal immune function. In addition, megakaryoctyes persisted in the red pulp. However, the vascular density remained unchanged in SMA spleen. Assessment of the spleen in SMA patients with the infantile form of the disease indicated a range of pathologies. We conclude that development of the spleen fails to occur normally in SMA mouse models and human patients. Thus, further analysis of immune function is likely to be required to fully understand the full extent of systemic disease pathology in SMA.
Keywords: SMN, megakaryocytes, patients, immunity, organ pathology
Introduction
A significant depletion of the cell‐ubiquitous survival of motor neurone (SMN) protein causes spinal muscular atrophy (SMA). Homozygous deletion or mutation of the telomeric SMN1 gene results in a complete failure of functional protein production, and cell and embryonic survival is only assured by the production of SMN protein by a centromeric copy gene: SMN2 (Monani et al. 1999). Due to alternative splicing of exon 7, SMN2 produces only ~ 10% fully functional SMN protein (Monani et al. 2000). This small amount of SMN protein is sufficient to ensure cell and embryonic survival but is insufficient to prevent disease (Monani et al. 1999).
SMA is the most common inherited cause of infant mortality with a pan‐ethnic incidence of ~ 1 in 11 000 live births (Sugarman et al. 2012). The disease is primarily characterised by degeneration of α‐motor neurones in the ventral horn of the spinal cord, with relative sparing of other cholinergic neuronal populations (Powis & Gillingwater, 2016). Skeletal muscle atrophy and weakness is generalised in the infantile phenotype but more severely affects proximal muscles in the intermediate and milder phenotypes. However, mounting evidence from patients and animal models suggests that SMA is a multisystem disorder, at least in the most severe phenotypes with prenatal or early infantile onset of involvement (SMA types 0 and 1; Hamilton & Gillingwater, 2013; Shababi et al. 2014). For example, in the more severe murine models of SMA with juvenile lethality, pathological changes have been reported in skeletal muscle (Mutsaers et al. 2011), selected brain regions such as the hippocampus (Wishart et al. 2010), glial cells (Hunter et al. 2014; Rindt et al. 2015), bone (Shanmugarajan et al. 2009), heart (Shababi et al. 2010),vasculature (Somers et al. 2012, 2016), lung (Schreml et al. 2013), and pancreas (Bowerman et al. 2012), with additional recent reports noting defects in testis (Ottesen et al. 2016) and the gastrointestinal tract (Sintusek et al. 2016). In human subjects, similar defects have been shown in muscle (Martínez‐Hernández et al. 2009), brain (Ito et al. 2004), heart (Rudnik‐Schoneborn et al. 2008), vasculature (Araujo et al. 2009; Rudnik‐Schoneborn et al. 2010; Somers et al. 2016), and pancreas (Bowerman et al. 2012).
Preliminary reports have suggested that there may be growth retardation phenotypes in lymphoid tissues from SMA mice, including thymus and spleen (Dachs et al. 2011). Given the importance of SMN for vascular development (Somers et al. 2012, 2016), and the dependence on normal vascularity for development of the spleen, we were keen to determine the extent to which the spleen is affected in SMA, as well as the extent to which splenic pathology can be considered a downstream consequence of defective vascular development and maturation.
The spleen fulfils two major functional roles; first, to filter blood by removing senescent red blood cells in a macrophage‐filled, sieve‐like network of open sinusoids (Terada et al. 2010); secondly, as a secondary lymphoid organ responsible for the generation of an immune response and innate immunity (Mebius & Kraal, 2005; Cesta, 2006). This immune response arises in the white pulp compartment of the spleen, where T‐cell zones and B‐cell follicles initiate antigen‐specific responses necessary to combat blood‐borne infections (Bronte & Pittet, 2013). The first crucial stage of white pulp development is the accumulation of B‐cells around the splenic vasculature (Neely & Flajnik, 2015), but as there are no afferent lymph vessels present in the spleen, influx of leukocytes occurs directly from the blood (Bronte & Pittet, 2013). Without this aggregation of B‐cells, no functional white pulp will form (Myers et al. 2013), while the continued presence of B‐cells supports white pulp maintenance (Wang et al. 2011).
Here, we report that the spleen appears relatively normal at birth in SMA mice (a pre‐symptomatic time‐point) but then fails to match whole animal growth over the immediate post‐natal period as the disease manifests and progresses. It fails to develop a normal cellular architecture, has significantly decreased cell density, and fails to develop segmented red and white pulp areas. This decreased size and cell density correlate with reduced levels of cell proliferation and increased cell death. Significantly, there is an almost complete failure of B‐cell accumulation, and relative levels of circulating lymphocytes are decreased. In addition, unusually high concentrations of megakaryocytes are present in the red pulp. Moreover, postmortem examination of the spleen in a cohort of SMA type I patients who died from a variety of causes reveals a range of pathologies, some of which also suggest abnormal development or acquired splenic dysfunction.
Materials and methods
Mice
‘Taiwanese’ (Smn −/− ;SMN2 tg/0) model of severe SMA and littermate, heterozygous, control Smn +/− ; SMN2 tg/0 (Jackson laboratory stock number 5058) mice were maintained in the animal care facility at Edinburgh University (Riessland et al. 2010; Wishart et al. 2014). Mice were retrospectively genotyped using standard PCR protocols (JAX® Mice Resources). The day of birth is designated as P0. All animal experiments were performed under appropriate personal and project licences granted by the UK Home Office, following internal ethical committee approval from the University of Edinburgh.
Tissue collection
Spleens from SMA and control littermates were harvested from mice sacrificed at P0, P5, and P8 (pre‐, mid‐ and late‐symptomatic, respectively; Hunter et al. 2016) by overdose of anaesthetic (intra‐peritoneal injection of pentobarbital) in accordance with guidelines from the UK Home Office. Spleens were promptly dissected and fixed in 4% paraformaldehyde (PFA) in 0.1 m phosphate‐buffered saline (PBS) for 3 h. Spleens were weighed post‐fixation, and prepared for cryosectioning in 30% sucrose solution in 0.1 m PBS, embedded in OCT at −35°C, sectioned at 8 μm and stored at −20 °C before staining.
Quantitative fluorescent Western blotting
Spleens were harvested from mice sacrificed at P8 (late‐symptomatic) by overdose of anaesthetic and stored at −80 °C. Total protein was isolated and homogenised in 40 μL of RIPA buffer (Pierce, Cat. No. 89900) with 2.5% proteinase inhibitor cocktail (Thermo Scientific, Cat. No. 1861278). Protein concentrations were determined using a BCA assay kit (Pierce, Cat. No. 23225). Protein was separated by SDS‐polyacrylamide gel electrophoresis on precast NuPage 4–12% Bis‐Tris gradient gels (Thermo Fisher Scientific, Cat. No. NP0323) and transferred to a nitrocellulose membrane using the iBlot® 2 Gel Transfer Device (Thermo Fisher Scientific, Cat. No. IB2001) and transfer stack (Thermo Fisher Scientific, Cat. No. IB23002). Membranes were blocked using SEA Block (Thermo Fisher Scientific, Cat. No. 37527) and incubated with anti‐SMN antibody (BD Biosciences, Cat. No. 610646) overnight. Membranes were incubated for 1.5 h in donkey anti‐mouse IgG H&L AlexaFluor 790 secondary (ab186699). Blots were imaged using an Odyssey Infrared Imaging System (LI‐COR Biosciences). Total protein was measured by incubating a separately electrophoresed gel in Instant Blue (Expedeon, Cat. No. ISB1) for 1 h and scanning on the Odyssey Infrared Imaging System. SMN protein levels were normalised to total protein levels using image studio Software (LI‐COR Biosciences).
Histological staining
Standard haematoxylin and eosin (Cardiff et al. 2014) and Picro Sirius Red staining (Junqueira et al. 1979) were performed on sections to observe the basic architecture of the spleen.
Immunohistochemistry
Sections of spleens were air‐dried for 30 min and blocked in standard blocking solution [0.4% bovine serum albumin (BSA), 1% Triton X‐100 in 0.1 m PBS] for 45 min at room temperature. Sections were then incubated in primary antibodies overnight at 4 °C: PECAM‐1 (R&D Systems Cat. No. AF3628; 1 : 750); biotinylated CD45R (Life Technologies Cat. No. RM2615; 1 : 200); CD41 (AbD Serotec Cat. No. MCA2245GA; 1 : 1000); Ki67 (Abcam Cat. No. ab16667); and TUNEL in situ cell death kit (Roche Diagnostics Cat. No. 11684795910). Sections were washed and incubated with secondary antibodies for 1 h at 4 °C: Donkey anti‐goat Cy3 (Abcam Cat. No. AB6949; 1 : 250), streptavidin conjugated AlexaFluor 488 (Life Technologies Cat. No. S‐11223; 1 : 200), Goat anti‐rat AlexaFluor 488 (Abcam Cat. No. ab150157; 1 : 200), and goat anti‐rabbit AlexaFluor 568 (Abcam Cat. No. ab175471). Sections were washed and cover‐slipped in MOWIOL mounting media containing DAPI.
White blood cell differential
P8 control and SMA mice were culled using termination by exsanguination. Under isofluorane‐induced terminal anaesthesia the thoracic cavity was opened and cardiac puncture to the left ventricle quickly performed. Blood was withdrawn using a 30‐gauge 0.3‐mL insulin syringe with one drop of blood used to make a blood smear (left to air‐dry) and the remaining placed in a 1.5‐mL tube with 0.5 m EDTA as an anticoagulant (1 : 20 ratio with blood) and inverted to mix well. Samples on ice were immediately taken for white blood cell (WBC) differential analysis at the Veterinary Pathology Unit, University of Edinburgh. Results are expressed as a percentage per 1000 mL of blood.
Imaging and quantification
Microscopy was performed in the Microscope and Histology Core Facility at the University of Aberdeen. Fluorescent‐stained slides were viewed using a Zeiss Imager M2 microscope with Zeiss Apotome, and images were captured with a Zeiss Mrm digital camera. For nuclear imaging and analysis of cell density, a Zeiss confocal LSM710 microscope and imagej were used. Cell density was calculated using DAPI labelling and counted using a systematic, random methodology, based on Mayhew & Sharma (1984). Spleens were embedded without specific alignment, and a grid overlay was placed over a randomly oriented section. From the top left, every 3rd grid square was counted (whole nucleus within or touching top and right‐hand edges counted, but not counted if touching bottom or left‐hand edges of sampling box). Proliferating cells were counted using a modification of this method, separating data into central and peripheral zones of the spleen. Full grid squares within 100 μm of the edge of the spleen were counted as peripheral; full grid squares more than 100 μm from the edge were counted as central. Data is expressed as cells per unit area (PUA).
Quantification of relative vessel area was achieved using imagej. PECAM‐1‐stained images were converted to binary, and the number of white (PECAM‐1‐positive) pixels were counted as a percentage of the total area. This was performed in 10 fields per spleen from six spleens (n = 3 for each genotype).
SMA patient autopsies
Data on type I SMA human subjects were obtained from review of research documentation obtained at the time of autopsy and from analysis of patient tissues obtained postmortem. Prior to initiation of any studies, written informed consent was obtained from the parents to perform a research autopsy under IRB 8751, reviewed and approved by the University of Utah Institutional Review Board. Autopsies were performed in collaboration with pathologists at each of the US institutions involved in this multicentre study (Primary Children's Medical Center and the Medical Examiner's Office, Salt Lake City, UT, USA; Cook Children's Medical Center, Ft Worth, TX, USA; Children's Hospital of Atlanta Scottish Rite, Atlanta, GA, USA).
Statistical analysis
Analysis and statistical tests were carried out using GraphPad prism software (GraphPad Software Inc.). All data are presented as mean ± SEM. Unless stated otherwise, statistical tests were unpaired, two‐tailed t‐tests, with significance considered to be P < 0.05.
Results
The spleen fails to develop correctly in severe SMA mice
On initial inspection at birth (P0), there were no gross differences in the form or size of the spleen between SMA and control littermate mice. However, by P5, dramatic differences were present, which further increased by P8, when the spleen was very small and pale in appearance (Fig. 1A). We confirmed disease‐indicative, low SMN protein levels in SMA spleen by Western blot at P8 (Fig. 1B). Quantification confirmed these qualitative observations, as after birth the spleen failed to increase in size in SMA mice and was significantly smaller at both P5 (mid‐symptomatic in terms of neuromuscular pathology: ~ 87%: P < 0.01) and P8 (late symptomatic: ~ 94%: P < 0.0001) compared with control, age‐matched littermates (Fig. 1C). Importantly, the SMA spleen was disproportionately small, weighing only 0.1% (n = 3; 0.1 ± 0.002%) compared with 0.6% (n = 3; 0.6% ± 0.034) of total body weight in control mice at P8 (Fig. 1D).
Figure 1.
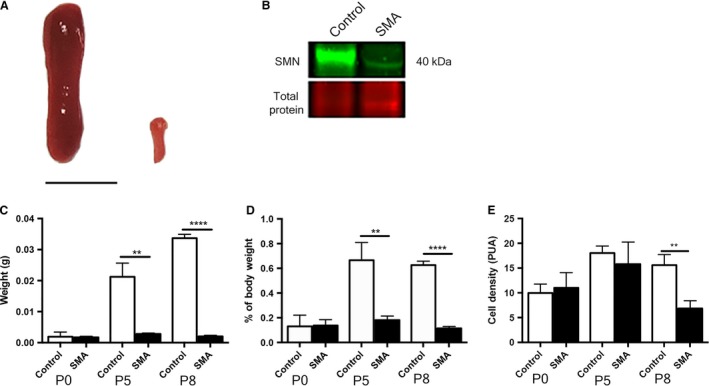
Spinal muscular atrophy (SMA) spleen is disproportionately small and disorganised. (A) Spleen from control (left) and late symptomatic (P8) SMA (right) mice. SMA spleen appears dramatically smaller and pale in comparison with control spleen. Scale bar: 5 mm.(B) Quantitative Western blot of SMN protein (green) displays a significant reduction of SMN (~ 40 kDa) in late‐symptomatic (P8) SMA spleens (P < 0.0001; ~ 39%) compared with controls. (C) Spleen weights at pre‐ (P0), mid‐ (P5), and late‐symptomatic (P8) time points. SMA spleens are significantly smaller than control spleens at both P5 (**P < 0.005) and P8 (****P < 0.0001). (D) As a percentage of total body weight, spleens are significantly smaller at both p5 (**P < 0.05) and P8 (****P < 0.0001). (E) Quantification shows a significantly reduced density of cells in the SMA spleen (**P < 0.01).
To further investigate the basis of this postnatal developmental phenotype, cell density was measured by counting DAPI‐stained cell nuclei. Cell density increased in control spleens from birth to P5 and was then maintained at a relatively consistent level until P8 (P0 9.96 ± 1.03 PUA, n = 3; P5 18.03 ± 0.82 PUA, n = 3). SMA spleen showed a similar pattern until P5, with no significant differences from control (P0 11.0 ± 1.77 PUA, n = 3; P5 15.8 ± 2.57 PUA, n = 3), but by P8, the cell density in the spleen was significantly reduced (<50%) (6.83 ± 0.91 cells per unit area: PUA, n = 3; P8 P < 0.005) compared with control littermates (15.58 ± 1.22 PUA; n = 3; P8) (Fig. 1E).
In summary, the spleen appeared normal at birth in SMA mice but then failed to grow and develop correctly, lacking the internal organisation observed in the spleen from healthy control animals.
Altered proliferation and cell death profiles underlie decreased spleen size
Given the significant difference in size and cell density between control and SMA spleens, we sought to further investigate this by analysing the distribution of proliferating and apoptotic cells. In the pre‐symptomatic spleen (P0), numbers of proliferating cells in both control and SMA spleens were relatively high and were evenly distributed throughout the spleen (Fig. 2A). By the mid‐symptomatic stage (P5) there were significantly greater numbers of proliferating cells in the periphery of the SMA spleen (18.67 ± 0.5 PUA; n = 3; P5 P < 0.001) compared with the periphery of control spleen (15.0 ± 0.71 PUA, n = 3; P5) (Fig. 2B). Conversely, at this point proliferation in the centre was dramatically reduced in control and SMA spleens (control: 3.0 ± 0.69, n = 3; SMA; 3.67 ± 1.04, n = 3; P5). Interestingly, at P8 there was a significant decrease in proliferating cell numbers in both the centre and periphery of the SMA spleen (Fig. 2C) (centre: P < 0.0001; 0.88 ± 0.35, n = 3; P8; periphery: P < 0.005; 5.88 ± 0.53, n = 3; P8), compared with the control spleen (centre: 8.44 ± 0.92, n = 3; P8; periphery; 9.0 ± 0.74, n = 3; P8). The general pattern suggests that proliferation falls dramatically in the late symptomatic SMA spleen.
Figure 2.

Cell proliferation and cell death are altered in the spinal muscular atrophy (SMA) spleen. Cell proliferation marker Ki67 (red) and cell death marker TUNEL (green) staining of pre‐, mid‐ and late‐symptomatic mice. (A) At the pre‐symptomatic stage (P0) cell proliferation is occurring uniformly throughout splenic tissue in both control and SMA mice.(B) At the mid‐symptomatic stage (P5) there is a significant increase in cell proliferation in the periphery of the SMA spleen (***P < 0.005). (C) At the late‐symptomatic stage (P8) cell proliferation is significantly reduced both centrally (****P < 0.0001) and peripherally (**P < 0.01) in SMA mice. Scale bar: 100 μm. (D) At birth (P0), apoptosis is largely restricted to the periphery of the spleen in both control and SMA mice. This continues into the mid‐symptomatic stage (P5, E); however, there is a significant increase in cell death in the periphery of the SMA spleen (****P < 0.0001), particularly around the splenic capsule. By the late‐symptomatic stage (P8, F) there is no difference in occurrence of cell death between the control and SMA spleens. Scale bar: 50 μm.
On initial observation of the pre‐symptomatic spleen (P0), cell death was more prevalent at the periphery of the spleen in both control and SMA mice, however, there was no significant difference between the two (Fig. 2D). By the mid‐symptomatic (P5) stage there were ~ 7× more apoptotic cells at the periphery of the SMA spleen (Fig. 2E) (**** P < 0.0001; 2.62 ± 0.31 PUA, n = 3; P5) compared with the control spleen (0.36 ± 0.27 PUA, n = 3). The apoptotic cells appeared to be confined to the extreme periphery and were likely capsule cells. Finally, by late‐symptomatic stage (P8) cell death occurred more uniformly throughout the splenic tissue in both control and SMA spleens (Fig. 2F), with no significant differences. In summary, cell death was variable but relatively low throughout all regions, and also in both SMA and control spleens. The exception was at P5, where there was a dramatic increase in cell death in peripheral cells in SMA spleen.
Morphologically distinct white pulp fails to develop and ultimately the spleen begins to degenerate in SMA mice
Next, we used haematoxylin and eosin‐stained histological preparations from SMA and control mouse spleen to assess cellular morphology. At P0 the white pulp had not aggregated in control spleen and there were no clear differences between control and SMA spleen (data not shown). In control spleen at P8, as expected, clearly differentiated islands of white pulp surrounding central arterioles within a mass of red pulp were present, and the surrounding capsule and centrally projecting fingers of trabeculae were well developed (Fig. 3A). However, in SMA spleen the appearance was strikingly different. Here, the tissue appeared homogeneous, with no apparent segregation of white pulp, and an overall appearance most closely resembling red pulp (Fig. 3D). This suggests either a failure to develop, or incomplete migration and segregation of cells into red and white pulp areas. In addition, no clear capsule was observed surrounding the SMA spleen (Fig. 3E), which may account for its very fragile nature at dissection. To further examine this, we used Picro Sirius Red to stain the collagen fibres, which are a major constituent of the capsule and trabeculae. Control spleen had a well developed and organised fibrous framework, as predicted (Fig. 3C), whereas SMA spleen showed almost no collagen where the capsule should be present and a highly disorganised internal arrangement (Fig. 3F). This indicates the presence of fibrosis and degenerative processes within the spleen of SMA mice.
Figure 3.
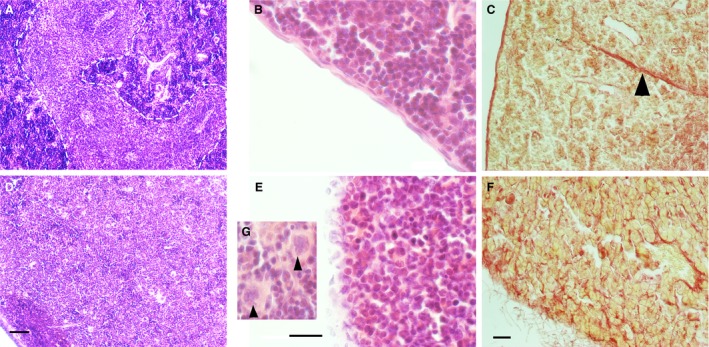
A morphologically distinct white pulp fails to develop and the spleen begins to degenerate in spinal muscular atrophy (SMA) mice. H&E staining of late‐symptomatic (P8) spleens. (A) In the control spleen, white pulp (dotted line) is clearly separated from red pulp. (D) In the SMA spleen, red and white pulp are undiscernible from one another, and there is an accumulation of large cells with lobulated nuclei (arrowhead, G). Scale bar: 50 μm. (B) Control spleen displays an intact splenic capsule, whereas the SMA spleen lacks a smooth and organised capsule‐like structure, instead presenting apparent dissociation of capsular cells (E). Scale bar: 20 μm. (C, F) Picro Sirius Red staining of the collagen component of the splenic capsule and trabeculae (arrowhead) in the control and late‐symptomatic (P8) spleen. The splenic capsule and trabeculae are intact in the control spleen (C); however, the SMA spleen lacks trabeculae and shows dissociation of the capsule (F). Scale bar: 50 μm.
Vascular density is not affected in the SMA spleen
To further understand the aetiology of the aberrant lymphoid tissue development in SMA spleen, we turned our attention to its vascular supply. As a blood filter, the vascular development within the spleen is critical for proper function (Cesta, 2006). We carried out PECAM‐1 (an endothelial cell marker) immunohistochemistry on spleens from P0, P5, and P8 mice. Initial qualitative observations showed no apparent difference in either the form or density of the vascular component in SMA mice (Fig. 4). Quantitative assessment of the vasculature at each time point confirmed that there were no differences between SMA and control spleens (SMA P0, 4.94% ± 0.66; control P0, 6.39% ± 0.57; SMA P5, 5.21% ± 0.29; control P5, 4.63% ± 0.77; SMA P8, 5.92% ± 0.42; control P8, 6.38% ± 0.29) (Fig. 4). Thus, the defects observed in the spleen of SMA mice are unlikely to represent a secondary consequence of vascular defects previously reported elsewhere in the body (Somers et al. 2012, 2016).
Figure 4.

The intrinsic vasculature of the spleen is unaltered in spinal muscular atrophy (SMA). Endothelial cell marker PECAM‐1‐stained vasculature throughout spleens of pre‐, mid‐ and late‐symptomatic mice. Distribution of vasculature appears uniform throughout the tissue of both control and SMA tissue. Analysis of fractional vessel area indicates no change during development and no significant differences between control and SMA at any time point. Scale bar: 50 μm.
Developing B‐cell follicles are absent in SMA spleen
To further investigate the apparent failure of white pulp aggregation in SMA spleen, we next examined B‐cell lymphocytes, which are necessary for normal immune functions of the spleen. CD45R (a pan B‐cell marker) in conjunction with PECAM‐1 (as above) immunohistochemistry showed regular accumulations of brightly stained B‐cells in control animals, indicative of developing white pulp from P5 onwards (Fig. 5). Significantly, these were not present in SMA spleen, where only diffuse, homogeneously distributed and poorly stained B‐cells were present. We next carried out a white blood cell differential blood analysis. This revealed a significantly lower percentage (**P < 0.01) of circulating lymphocytes in the SMA mouse (31.7% ± 2.77, n = 4) compared with control mice (55.25% ± 3.96, n = 4) (Fig. 5). Taken together these findings reveal a striking absence of resident lymphocytes (B‐cell follicles) in the spleen and a similar reduction in circulating lymphocytes in SMA mice.
Figure 5.

B‐cells fail to accumulate in spinal muscular atrophy (SMA) spleen and circulating lymphocyte count is reduced. B‐cell marker CD45R (green) demonstrates clusters of B‐cells have begun forming follicles in mid‐ (P5)‐ and late‐symptomatic (P8) control spleens, but not in mid‐ to late‐symptomatic SMA spleens where B‐cells are absent. Circulating lymphocyte counts were significantly decreased in SMA mice (SMA n = 4, control n = 4; ** P < 0.005). Scale bar: 100 μm.
Megakaryocyte populations are increased in SMA spleen
Further examination of haematoxylin and eosin‐stained histological preparations from SMA and control mouse spleen revealed the presence of many large cells with lobulated nuclei (Fig. 3G), which we suspected to be megakaryocytes. We sought to confirm this by performing immunohistochemical staining with antibodies against CD41 (a megakaryocyte cell and platelet marker) in control and late‐symptomatic mice (Fig. 6A,B). We identified megakaryocytes by co‐staining with a DAPI nuclear stain (Fig. 6A,B, inset), as platelets do not contain nuclei. Quantitative analysis revealed significantly greater numbers (****P < 0.0001) of megakaryocytes in late symptomatic P8 SMA spleen (5.9 ± 0.56, n = 3: mean ± SEM; p8) than in control spleens (1.13 ± 0.18 PUA, n = 3; p8) (Fig. 6C).
Figure 6.
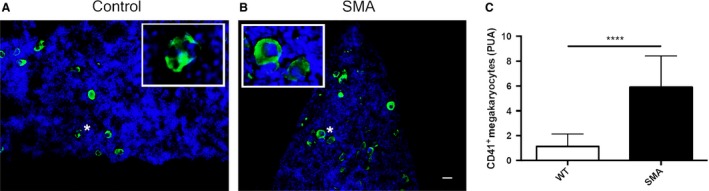
Megakaryocytes persist in spinal muscular atrophy (SMA) spleen but platelet numbers are unaltered. CD41‐stained cells in P8 spleens from control (A) and SMA (B) mice. There are significantly greater numbers of positively stained CD41+ nucleated megakaryocytes (inset) PUA present in the late‐symptomatic (P8) SMA spleen compared with the control spleen (C). (****P < 0.0001). Scale bar: 25 μm.
Preliminary observations of spleen abnormalities in SMA type I patients
We were keen to establish whether any of the defects found in mouse models were present in human SMA patients. Autopsy samples collected from severe SMA patients (n = 9, SMA type I) aged 6–60 months, revealed that 56% (five of nine) of patients demonstrated abnormal splenic pathology, either grossly or upon further examination of tissues via light microscopy (Table 1). Observed changes included gross defects such as increased white pulp, small accessory spleens, congestion and presence of erythroid precursors in the red pulp. These findings confirm that abnormalities in the spleen occur in at least a subset of patients with SMA type I.
Table 1.
SMA Type I routine spleen autopsy results
| Age (months) | Abnormalities |
|---|---|
| 6 | Accessory spleen |
| 14 | Congested red pulp |
| 16 | Accessory spleen |
| 21 | None |
| 28 | Increased white pulp and erythroid precursors |
| 33 | None |
| 35 | None |
| 45 | Congested red pulp |
| 60 | None |
Discussion
Given the historical context of SMA as a clinically defined motor neurone disease, most previous research has understandably focused on key pathological events surrounding motor neurone loss and muscle atrophy. However, as the protein product of the SMN gene is expressed ubiquitously in all cells and tissues of the body, we should perhaps not be surprised that depletion of SMN in SMA results in pathologies affecting other organ and tissue systems (Hamilton & Gillingwater, 2013; Shababi et al. 2014). Here, we extend these findings to reveal significant defects in the gross anatomy and cellular composition of the spleen, in an established mouse model of severe SMA. The spleen was disproportionately small and had a disturbed architecture; the most notable changes being failed B‐cell aggregation in white pulp and an abnormal amount of megakaryocytes present in red pulp. In contrast, the basic vasculature of the spleen appeared to be unaffected. The defects described here reflect failed post‐natal development of the spleen, resulting in a grossly deficient and defective organ at postnatal day 10, when these mice display severe neuromuscular pathology. Importantly, a range of pathologies were also seen at autopsy in severe SMA patients.
We have previously reported significant depletion of capillary beds in skeletal muscle and spinal cord of SMA mice and human SMA patients (Somers et al. 2012, 2016), resulting in functionally significant tissue hypoxia (Somers et al. 2016). We expected to find a similar pathology in the spleen of SMA mice but were surprised to find that although the spleen was small and pale in appearance, the density of the intrinsic vasculature remained unchanged. However, it should be noted that the vascular development of the spleen is significantly different to that in muscle and spinal cord. In most organs, vessel ingrowth determines organ growth, whereas in muscle and central nervous system, the vasculature grows into expanding organ systems (Crivellato et al. 2007; Ramasamy et al. 2015). As the SMA spleen is approximately 20 times smaller, in absolute terms, than the control spleen at late stages, this could reflect decreased angiogenesis, which then fails to drive organ expansion. Equally, low numbers of lymphocytes are present in the spleen at birth, whereas high levels of proliferating B‐ and T‐cells are present to form a functioning white pulp capable of providing immune responses (Loder et al. 1999; Le Campion et al. 2002). Therefore, it is unsurprising that the late‐symptomatic SMA spleen with no white pulp has significantly fewer proliferating cells, especially centrally, where white pulp should be developing. The increased levels of cell proliferation in the periphery of the SMA spleen at P5 suggest an attempt to maintain normal splenic growth; however, this is countered by a simultaneous increase in cell death at the periphery. Interestingly, cell death appears to occur largely in the splenic capsule of the mid‐symptomatic SMA spleen, an area we have shown to be fibrotic and degenerative. The subsequent decrease in cell proliferation both centrally and peripherally at P8 in the SMA spleen correlates with our reports of small spleen size and decreased cell density.
The decrease in circulating lymphocytes coupled with the failure of B‐cells to accumulate and form a functional white pulp in SMA mice, suggests a developmental defect in the immune system. B‐cells are generated in bone marrow and must travel via the circulatory system to the spleen and through the T‐cell zone, where they communicate with activated T‐cells and subsequently mature (Forster et al. 1999; Mebius & Kraal, 2005). Vascular endothelial cells in the spleen are critical for this lymphocyte homing behaviour from high endothelial venules (Czompoly et al. 2011; Lee et al. 2014), and a subtle defect in the endothelial cells could lie at the root of this. However, the decrease in numbers of circulating lymphocytes in the blood suggests that B‐cells may simply not be present in sufficient numbers to aggregate in the spleen. The spleen should normally contain approximately 25% of the total number of lymphocytes (Nolte et al. 2002) and the absence of B‐cell lymphocytes in the SMA spleen may be an indicator of a more widespread defect in the immune system.
In the red pulp, we observed an increase in the number of megakaryocytes in SMA spleen. This evidence of extra‐medullary haematopoiesis is suggestive of a secondary response to a systemic change, most likely hypoxia (Kim, 2010), and we have previously reported significant hypoxia in these mice at P5 (Somers et al. 2016). Extra‐medullary haematopoiesis, as suggested by the increase in red pulp megakaryocytes, has been linked to a loss of splenic architecture (Franke et al. 2013) and may be responsible for the generally disorganised splenic microstructure in SMA.
We were interested to determine whether any changes in gross morphology were present in the spleen of severe SMA patients, which the mice used in this study most closely model (Hsieh‐Li et al. 2000). When data from routine autopsies were reviewed, we found that the majority showed some gross or micro‐anatomical pathology. The fact that these abnormalities include both what could be termed developmental and degenerative pathologies, suggests that the human spleen is a focus of previously undescribed pathology in severe patients and warrants further investigation. Given that the majority of the defects we have observed in the mouse model would not be observable at routine autopsy, it is perhaps not surprising that several patient spleens have a ‘normal’ macroscopic appearance. However, the variability of both patient age and observed splenic abnormalities, including absence in some cases, suggests that further studies are required to examine potential parallels with observations from the SMA mouse model.
In summary, we show that SMN depletion leads to specific, yet varied defects in the gross and microanatomy of the spleen in a mouse model of severe SMA. Further, a range of splenic defects were present in severe SMA patients. This is likely to lead to a significantly compromised immune system in SMA that may have important implications for the broader spectrum of pathology that occurs in the disease.
Funding
S.H.P. received an Anatomical Society PhD Studentship award for A.K.T. T.H.G. received an Anatomical Society PhD Studentship award for R.A.P. and funding from the SMA Trust (UK SMA Research Consortium), Euan MacDonald Centre for Motor Neurone Disease Research, and Muscular Dystrophy UK. K.J.S received funding for pathologic studies in human subjects from NICHD grant R01‐HD054599.
Acknowledgements
The authors would like to acknowledge the Microscopy and Histology Core Facility at the University of Aberdeen for the use of their facilities; members of the Gillingwater lab at Edinburgh University for tissue collection and guidance; and the Anatomical Society for funding this research. We are forever grateful to the patients and families who supported these efforts by participating in research studies.
References
- Araujo A, Araujo M, Swoboda KJ (2009) Vascular perfusion abnormalities in infants with spinal muscular atrophy. J Pediatr 155, 292–294. [DOI] [PMC free article] [PubMed] [Google Scholar]
- Bowerman M, Swoboda KJ, Michalski JP, et al. (2012) Glucose metabolism and pancreatic defects in spinal muscular atrophy. Ann Neurol 72, 256–268. [DOI] [PMC free article] [PubMed] [Google Scholar]
- Bronte V, Pittet MJ (2013) The spleen in local and systemic regulation of immunity. Immunity 39, 806–818. [DOI] [PMC free article] [PubMed] [Google Scholar]
- Cardiff RD, Miller CH, Munn RJ (2014) Manual hematoxylin and eosin staining of mouse tissue sections. Cold Spring Harb Protoc 2014, 655–658. [DOI] [PubMed] [Google Scholar]
- Cesta MF (2006) Normal structure, function, and histology of the spleen. Toxicol Pathol 34, 455–465. [DOI] [PubMed] [Google Scholar]
- Crivellato E, Nico B, Ribatti D (2007) Contribution of endothelial cells to organogenesis: a modern reappraisal of an old Aristotelian concept. J Anat 211, 415–427. [DOI] [PMC free article] [PubMed] [Google Scholar]
- Czompoly T, Labadi A, Kellermayer Z, et al. (2011) Transcription factor Nk2–3 controls the vascular identity and lymphocyte homing in the spleen. J Immunol 186, 6981–6989. [DOI] [PubMed] [Google Scholar]
- Dachs E, Hereu M, Piedrafita L, et al. (2011) Defective neuromuscular junction organization and postnatal myogenesis in mice with severe spinal muscular atrophy. J Neuropathol Exp Neurol 70, 444–461. [DOI] [PubMed] [Google Scholar]
- Forster R, Schubel A, Breitfeld D, et al. (1999) CCR7 coordinates the primary immune response by establishing functional microenvironments in secondary lymphoid organs. Cell 99, 23–33. [DOI] [PubMed] [Google Scholar]
- Franke K, Kalucka J, Mamlouk S, et al. (2013) HIF‐1α is a protective factor in conditional PHD2‐deficient mice suffering from severe HIF‐2α‐induced excessive erythropoiesis. Blood 121, 1436–1445. [DOI] [PMC free article] [PubMed] [Google Scholar]
- Hamilton G, Gillingwater TH (2013) Spinal muscular atrophy: going beyond the motor neuron. Trends Mol Med 19, 40–50. [DOI] [PubMed] [Google Scholar]
- Hsieh‐Li HM, Chang JG, Jong YJ, et al. (2000) A mouse model for spinal muscular atrophy. Nat Genet 24, 66–70. [DOI] [PubMed] [Google Scholar]
- Hunter G, Aghamaleky Sarvestany A, Roche SL, et al. (2014) SMN‐dependent intrinsic defects in Schwann cells in mouse models of spinal muscular atrophy. Hum Mol Genet 23, 2235–2250. [DOI] [PubMed] [Google Scholar]
- Hunter G, Powis RA, Jones RA, et al. (2016) Restoration of SMN in Schwann cells reverses myelination defects and improves neuromuscular function in spinal muscular atrophy. Hum Mol Genet. DOI: 10.1093/hmg/ddw141 (Ahead of print). [DOI] [PMC free article] [PubMed] [Google Scholar]
- Ito Y, Kumada S, Uchiyama A, et al. (2004) Thalamic lesions in a long‐surviving child with spinal muscular atrophy type I: MRI and EEG findings. Brain Dev 26, 53–56. [DOI] [PubMed] [Google Scholar]
- Junqueira LC, Bignolas G, Brentani RR (1979) Picrosirius staining plus polarization microscopy, a specific method for collagen detection in tissue sections. Histochem J 11, 447–455. [DOI] [PubMed] [Google Scholar]
- Kim CH (2010) Homeostatic and pathogenic extramedullary hematopoiesis. J Blood Med 1, 13–19. [DOI] [PMC free article] [PubMed] [Google Scholar]
- Le Campion A, Bourgeois C, Lambolez F, et al. (2002) Naive T cells proliferate strongly in neonatal mice in response to self‐peptide/self‐MHC complexes. Proc Natl Acad Sci U S A 99, 4538–4543. [DOI] [PMC free article] [PubMed] [Google Scholar]
- Lee M, Kiefel H, LaJevic MD, et al. (2014) Transcriptional programs of lymphoid tissue capillary and high endothelium reveal control mechanisms for lymphocyte homing. Nat Immunol 15, 982–995. [DOI] [PMC free article] [PubMed] [Google Scholar]
- Loder F, Mutschler B, Ray RJ, et al. (1999) B cell development in the spleen takes place in discrete steps and is determined by the quality of B cell receptor‐derived signals. J Exp Med 190, 75–89. [DOI] [PMC free article] [PubMed] [Google Scholar]
- Martínez‐Hernández R, Soler‐Botija C, Also E, et al. (2009) The developmental pattern of myotubes in spinal muscular atrophy indicates prenatal delay of muscle maturation. J Neuropathol Exp Neurol 68, 474–481. [DOI] [PubMed] [Google Scholar]
- Mayhew TM, Sharma AK (1984) Sampling schemes for estimating nerve fibre size. I. Methods for nerve trunks of mixed fascicularity. J Anat, 139 (Pt 1), 45–58. [PMC free article] [PubMed] [Google Scholar]
- Mebius RE, Kraal G (2005) Structure and function of the spleen. Nat Rev Immunol 5, 606–616. [DOI] [PubMed] [Google Scholar]
- Monani UR, Lorson CL, Parsons DW, et al. (1999) A single nucleotide difference that alters splicing patterns distinguishes the SMA gene SMN1 from the copy gene SMN2. Hum Mol Genet 8, 1177–1183. [DOI] [PubMed] [Google Scholar]
- Monani UR, Sendtner M, Coovert DD, et al. (2000) The human centromeric survival motor neuron gene (SMN2) rescues embryonic lethality in Smn–/– mice and results in a mouse with spinal muscular atrophy. Hum Mol Genet 9, 333–339. [DOI] [PubMed] [Google Scholar]
- Mutsaers CA, Wishart TM, Lamont DJ, et al. (2011) Reversible molecular pathology of skeletal muscle in spinal muscular atrophy. Hum Mol Genet 20, 4334–4344. [DOI] [PubMed] [Google Scholar]
- Myers RC, King RG, Carter RH, et al. (2013) Lymphotoxin α1β2 expression on B cells is required for follicular dendritic cell activation during the germinal center response. Eur J Immunol 43, 348–359. [DOI] [PMC free article] [PubMed] [Google Scholar]
- Neely HR, Flajnik MF (2015) CXCL13 responsiveness but not CXCR5 expression by late transitional B cells initiates splenic white pulp formation. J Immunol 194, 2616–2623. [DOI] [PMC free article] [PubMed] [Google Scholar]
- Nolte MA, Hamann A, Kraal G, et al. (2002) The strict regulation of lymphocyte migration to splenic white pulp does not involve common homing receptors. Immunology 106, 299–307. [DOI] [PMC free article] [PubMed] [Google Scholar]
- Ottesen EW, Howell MD, Singh NN, et al. (2016) Severe impairment of male reproductive organ development in a low SMN expressing mouse model of spinal muscular atrophy. Sci Rep 6, 20193. [DOI] [PMC free article] [PubMed] [Google Scholar]
- Powis RA, Gillingwater TH (2016) Selective loss of alpha motor neurons with sparing of gamma motor neurons and spinal cord cholinergic neurons in a mouse model of spinal muscular atrophy. J Anat 228, 443–451. [DOI] [PMC free article] [PubMed] [Google Scholar]
- Ramasamy SK, Kusumbe AP, Adams RH (2015) Regulation of tissue morphogenesis by endothelial cell‐derived signals. Trends Cell Biol 25, 148–157. [DOI] [PMC free article] [PubMed] [Google Scholar]
- Riessland M, Ackermann B, Forster A, et al. (2010) SAHA ameliorates the SMA phenotype in two mouse models for spinal muscular atrophy. Hum Mol Genet 19, 1492–1506. [DOI] [PubMed] [Google Scholar]
- Rindt H, Feng Z, Mazzasette C, et al. (2015) Astrocytes influence the severity of spinal muscular atrophy. Hum Mol Genet 24, 4094–4102. [DOI] [PMC free article] [PubMed] [Google Scholar]
- Rudnik‐Schoneborn S, Heller R, Berg C, et al. (2008) Congenital heart disease is a feature of severe infantile spinal muscular atrophy. J Med Genet 45, 635–638. [DOI] [PubMed] [Google Scholar]
- Rudnik‐Schoneborn S, Vogelgesang S, Armbrust S, et al. (2010) Digital necroses and vascular thrombosis in severe spinal muscular atrophy. Muscle Nerve 42, 144–147. [DOI] [PubMed] [Google Scholar]
- Schreml J, Riessland M, Paterno M, et al. (2013) Severe SMA mice show organ impairment that cannot be rescued by therapy with the HDACi JNJ‐26481585. Eur J Hum Genet 21, 643–652. [DOI] [PMC free article] [PubMed] [Google Scholar]
- Shababi M, Habibi J, Yang HT, et al. (2010) Cardiac defects contribute to the pathology of spinal muscular atrophy models. Hum Mol Genet 19, 4059–4071. [DOI] [PubMed] [Google Scholar]
- Shababi M, Lorson CL, Rudnik‐Schoneborn SS (2014) Spinal muscular atrophy: a motor neuron disorder or a multi‐organ disease? J Anat. 224, 15–28. [DOI] [PMC free article] [PubMed] [Google Scholar]
- Shanmugarajan S, Tsuruga E, Swoboda KJ, et al. (2009) Bone loss in survival motor neuron (Smn−/− SMN2) genetic mouse model of spinal muscular atrophy. J Pathol 219, 52–60. [DOI] [PMC free article] [PubMed] [Google Scholar]
- Sintusek P, Catapano F, Angkathunkayul N, et al. (2016) Histopathological defects in intestine in severe spinal muscular atrophy mice are improved by systemic antisense oligonucleotide treatment. PLoS One 11, e0155032. [DOI] [PMC free article] [PubMed] [Google Scholar]
- Somers E, Stencel Z, Wishart TM, et al. (2012) Density, calibre and ramification of muscle capillaries are altered in a mouse model of severe spinal muscular atrophy. Neuromuscul Disord 22, 435–442. [DOI] [PubMed] [Google Scholar]
- Somers E, Lees RD, Hoban K, et al. (2016) Vascular defects and spinal cord hypoxia in spinal muscular atrophy. Ann Neurol 79, 217–230. [DOI] [PubMed] [Google Scholar]
- Sugarman EA, Nagan N, Zhu H, et al. (2012) Pan‐ethnic carrier screening and prenatal diagnosis for spinal muscular atrophy: clinical laboratory analysis of >72,400 specimens. Eur J Hum Genet 20, 27–32. [DOI] [PMC free article] [PubMed] [Google Scholar]
- Terada N, Saitoh Y, Saitoh S, et al. (2010) Visualization of microvascular blood flow in mouse kidney and spleen by quantum dot injection with ‘in vivo cryotechnique’. Microvasc Res 80, 491–498. [DOI] [PubMed] [Google Scholar]
- Wang X, Cho B, Suzuki K, et al. (2011) Follicular dendritic cells help establish follicle identity and promote B cell retention in germinal centers. J Exp Med 208, 2497–2510. [DOI] [PMC free article] [PubMed] [Google Scholar]
- Wishart TM, Huang JP‐W, Murray LM, et al. (2010) SMN deficiency disrupts brain development in a mouse model of severe spinal muscular atrophy. Hum Mol Genet 19, 4216–4228. [DOI] [PMC free article] [PubMed] [Google Scholar]
- Wishart TM, Mutsaers CA, Riessland M, et al. (2014) Dysregulation of ubiquitin homeostasis and beta‐catenin signaling promote spinal muscular atrophy. J Clin Invest 124, 1821–1834. [DOI] [PMC free article] [PubMed] [Google Scholar]