

Abstract
Background
Precise classification of cancer types is critically important for early cancer diagnosis and treatment. Numerous efforts have been made to use gene expression profiles to improve precision of tumor classification. However, reliable cancer-related signals are generally lacking.
Method
Using recent datasets on colon and prostate cancer, a data transformation procedure from single gene expression to pair-wise gene expression ratio is proposed. Making use of the internal consistency of each expression profiling dataset this transformation improves the signal to noise ratio of the dataset and uncovers new relevant cancer-related signals (features). The efficiency in using the transformed dataset to perform normal/tumor classification was investigated using feature partitioning with informative features (gene annotation) as discriminating axes (single gene expression or pair-wise gene expression ratio). Classification results were compared to the original datasets for up to 10-feature model classifiers.
Results
82 and 262 genes that have high correlation to tissue phenotype were selected from the colon and prostate datasets respectively. Remarkably, data transformation of the highly noisy expression data successfully led to lower the coefficient of variation (CV) for the within-class samples as well as improved the correlation with tissue phenotypes. The transformed dataset exhibited lower CV when compared to that of single gene expression. In the colon cancer set, the minimum CV decreased from 45.3% to 16.5%. In prostate cancer, comparable CV was achieved with and without transformation. This improvement in CV, coupled with the improved correlation between the pair-wise gene expression ratio and tissue phenotypes, yielded higher classification efficiency, especially with the colon dataset – from 87.1% to 93.5%. Over 90% of the top ten discriminating axes in both datasets showed significant improvement after data transformation. The high classification efficiency achieved suggested that there exist some cancer-related signals in the form of pair-wise gene expression ratio.
Conclusion
The results from this study indicated that: 1) in the case when the pair-wise expression ratio transformation achieves lower CV and higher correlation to tissue phenotypes, a better classification of tissue type will follow. 2) the comparable classification accuracy achieved after data transformation suggested that pair-wise gene expression ratio between some pairs of genes can identify reliable markers for cancer.
Keywords: Hepsin, Adipsin, Monocyte-derived neutrophil-activating protein, Prostate cancer, Colon cancer
Background
Tumor development is a process in which gene expression is modified, causing abnormal cell behaviour [1]. Many techniques have been developed to identify abnormalities of gene expression, as reflected by abundance of mRNA transcripts between normal and tumor. The completion of the Human Genome Project and advances in DNA-array technology have allowed highly parallel genetic analyses to take place on a genome-wide scale. They have revolutionized the way tumors are studied, and promised to provide a better and more thorough understanding of the underlying mechanisms for tumorigenesis. Eventually, they will lead to more comprehensive diagnosis/prognosis of tumor with more effective therapeutic interventions.
Despite its advantages, the DNA-array technology poses three major challenges that render the interpretation of expression data less efficient than expected. Firstly, the gene expression data is inherently variable due to various factors that either depend on biological factors that remain difficult to control (cross-contaminated samples of tumor and normal cells), or depend on difficulties in setting up of the experiment (RNA extraction) [2]. These drawbacks interfere with the subsequent array analysis aimed to identify reliable markers that best correlate with the tissue phenotypes. Efforts have been devoted to address these drawbacks by incorporating various raw data scaling, data filtering, normalization and improvement of the classifier algorithm [3]. Promising results have been reported claiming near-perfect classification accuracy [4]. However, the usually small number of samples per class in most studies and the highly biased cross validation procedures cast doubt on the classification accuracy in terms of their statistical significance [5]. This statistical constraint creates a further challenge for DNA-array technology where the number of features in arrays is in thousands while tissue samples are available in limited number. This causes high probability for any classification to be correct by chance alone. Thirdly, although it has been recently established that genes segregate into clusters of interacting networks [6] instead of acting as one single entity, most cancer DNA-array studies have only investigated single gene aberration (up/down-regulated) when comparing tumor expression profiles to their corresponding normal tissue controls. In an interesting study, B∅ and Jonassen tried to circumvent some of these difficulties by investigating genes in pairs. They demonstrated that gene pairs can be used to improve discrimination between different tissue classes [7]. This idea of studying genes in pairs, or even in higher order clusters, should be explored further to reveal new features of complex expression profiling datasets.
In this study, we introduced a novel data transformation meant to investigate relationships between pair-wise gene expression ratios and tissue phenotype within a given experiment. With this procedure, we aimed to discover strong cancer-related signals (features) that exist in the form of pair-wise ratios (or higher order relationship when we extend to N-feature model classifier for N>2) in a given sample, while improving the signal to noise ratio of the dataset by minimizing its coefficient of variation (CV). The underlying concept for adopting pair-wise gene expression ratios as the discriminating axes for tissue type classification is that an experiment is self-consistent (in terms of factors affected either by the biology of the phenomenon of interest, or of the experimental setting, or both). With this approach we could "subtract" correlated variations by considering the sample as a whole, without making inferences such as those needed for normalization. Basically, we avoided studying gene expression in an absolute term because this requires robust normalization method to account for arrays from different experiments, different platforms and different profiling technologies. By resorting to analyze features in the form of ratios, we attempted to minimize the effect of normalization and look for co-varying signals in each experiment.
Methods
Colon and prostate cancer datasets
The 62 colon cancer sample dataset is composed of measurements for 1,988 gene probes, of which 40 were labelled as tumor and 22 were labelled as normal. The samples were collected from patients, their RNAs were extracted and hybridised to Affymetrix Hum6000 arrays. Please refer to paper [8]. The normalized dataset can be downloaded at http://microarray.princeton.edu/oncology/-affydata/index.html.
The 102 prostate cancer sample dataset is composed of measurements for 12,600 gene probes, of which 52 were labelled as tumor and 50 were labelled as normal. The samples were collected from patients, their RNAs were extracted and hybridised to Affymetrix U95Av2 arrays. Please refer to paper [9]. The normalised dataset can be downloaded at http://www-genome.wi.mit.edu/MPR/Prostate.
Both datasets were pre-processed to eliminate those probe pairs that showed significant fluctuation in their hybridisation signals (those greater than 3 standard deviation away from the mean for their ESTs, and the probes pairs that showed an overall higher intensity in their mismatch probe cells (MM) than their corresponding perfect match probe cells (PM); these probe pairs indicate non-specific hybridisation by background RNAs). Both datasets used average intensity as quantitative measurements of the level of gene expression. Base-10 logarithmic transformations were performed for each dataset.
Initial gene selection
For downstream classification analysis, we extracted only the genes whose expression pattern correlated strongly to the tissue phenotype. To achieve this, we first calculated the correlation coefficient ri (Equation 1) for each gene i using the full dataset, and ranked the genes according to their correlation coefficient ri. For the calculation of r, we assigned a number to each tissue phenotype: 1 for normal tissue and 10 for cancer tissue. After obtaining the correlation coefficients for all genes, we used a simple threshold value (|r|>0.4) to select the set of cancer-related genes. There were two reasons for set the threshold value at 0.4. When lower thresholds were used, we incorporated many genes that were not known to be cancer-related (data not shown). Furthermore, too many genes will later cause computer tractability problem when we calculate their pair-wise gene expression ratio for each tissue sample and later the N-feature model classifier. At |r|>0.4, we were able to account for most of previously known cancer related genes.
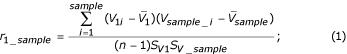
where V1 is a vector representing the gene expression pattern for gene #1; Vsample is the dichotomous representation of tissues; SV1and Ssample standard deviation of V1, Vsample;  ,
,  are the mean of V1, Vsample.
Transforming the gene expression data to investigate the expression equilibrium between genes pairs
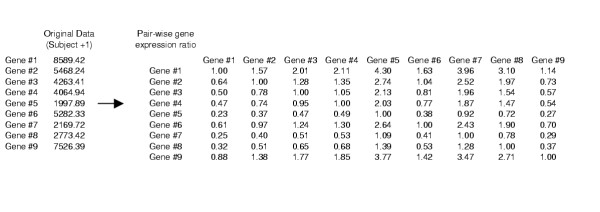
The raw expression data within a sample tissue was transformed into measurement of the pair-wise gene expression ratio for any combinatorial pairs of genes. For the 1,988 gene expression intensities for each sample (e1, e2...e1988), there are 1988C2 combinations (e1/e2, e1/e3...) of pair-wise gene expression ratios (Figure 1). This transformed matrix is referred to as M. Each row/column corresponds to a specific gene and the entry at the intersection of row X and column Y corresponds to the expression equilibrium between gene X and gene Y. Such matrix has a diagonal entry of value 1 because e1/e1 equals to unity.
Figure 1.
Transformation of gene expression data.
Feature partitioning method [4] for classification of normal/tumor tissues using single gene expression
Regarding the Feature Partitioning Method (FPM), in order to discriminate between the normal/tumor tissues based on specific feature i (single gene expression), the first step is to determine the threshold value, Ti, that can optimally splits all the tissue samples into tumor and normal tissue. The FPM algorithm has a recursive version [4], in which a decision tree depicting the classification rules for tissue samples was generated recursively. Both methods differ in the way Tis are derived. Nonetheless, they are very intuitive and non-parametric in nature. Also, they restrict no priori distribution patterns for features used. We adopted the simple FPM for tissue classification where each feature was treated individually. There are two criteria for deriving a valid threshold value Ti for each feature. First, it has to delineate correctly (discriminating efficiency = 100%) the one-dimensional region (Rfeature_i) for either all the normal/tumor tissues using all tissue samples. Secondly, it has to minimize the percentage of false prediction for the other tissue type. Take gene #1659 for example. To fulfill the two aforementioned criteria, it was determined that the region greater than 63.7 (R#1659) incorporates all the tumor samples (Figure 2). It classified correctly all tumors (discriminating efficiency = 100%) with an overall false prediction of 13.9% in the normal set. This was performed repeatedly for all features until all the threshold values (Ti...all features) were determined.
Figure 2.
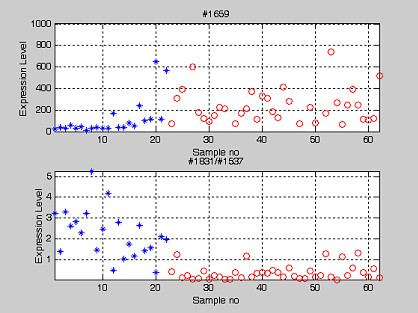
Potential colon cancer gene markers: The expression of single gene and the transformed pair-wise gene expression ratio. Potential gene marker for colon cancer tissue (#1659-Human monocyte-derived neutrophil-activating protein (MONAP) mRNA). However, we observed that the pair-wise gene expression ratio (#1537/#1831- ratio between vascular endothelial growth factor and gelsolin precursor) has better discriminating efficiency as tabulated in Table 7. ('*' and 'o' represent normal and cancer tissue type respectively).
Now, to classify an unknown sample using 2-feature model classifier, a combination of any two features and their corresponding pre-determined threshold values Tis (selected from Ti...all features for each dataset) were recruited. The outcome of the tissue class will be determined depending on whether one/both the expression values of the unknown sample fall completely in either the normal/cancer region (Rfeature_i). This is to say that if any of the two features from the unknown sample meets the criteria (Rfeature_i) to be either normal/tumor tissue type (based on our definition, Rfeature_i is a region with 100% discriminating efficiency for a specific tissue type), the unknown sample will be assigned to be normal/tumor respectively. This is repeated exhaustively for all possible combinations constituting of any two features. The procedure will be repeated for all tissue samples to evaluate the overall classification accuracy for 2-feature model classifier. In total, we evaluated the classification of tissue samples based on different combinations of N genes and investigated the classifiers up to 10-feature model classifier.
Classification of normal/tumor tissues using transformed datasets
The classification procedures and the two criteria for determining the threshold value were the same as explained in previous paragraph. The only difference here is that the definition of "feature" refers to pair-wise gene expression ratio derived from lower/upper triangular matrix of M. Take the ratio #1537/#1831 for example. To fulfill the two aforementioned criteria, it was determined that the region greater than 0.755 (R#1537/#1831) incorporates all the tumor tissue samples (Figure 2). It classifies correctly all tumor tissue samples with a false prediction of 6.4%. This is performed repeatedly for all entries in M until all the threshold values are determined.
Now, to classify an unknown sample using 2-feature model classifier, a combination of any two features (pair-wise gene expression ratio) and their corresponding pre-determined threshold values Tis (selected from Ti...all features for each dataset) were recruited. The outcome of the tissue class will be determined depending on whether one/both the expression values of the unknown sample fall completely in either the normal or cancer region (Rfeature_i). This is to say that if any of the two features (pair-wise gene expression ratio) from the unknown sample meets the criteria (Rfeature_i) to be either normal/tumor (based on our definition, Rfeature_i is a region with 100% discriminating efficiency for a specific tissue type), the unknown sample will be assigned to be normal/tumor respectively. This is repeated exhaustively for all possible combinations constituting of two features. The procedure will be repeated for all tissue samples to evaluate the overall classification accuracy for 2-feature model classifier. In total, we evaluated the classification of tissue samples based on different combinations of N genes and investigated the classifiers up to 10-feature model classifier.
Constructing the relationship tree for the top 25 genes
We calculated the cross correlation coefficient r (Equation 1) for all pair combinations of the top 25 genes listed in Table 6 and Table 7. Prior to the construction of a relationship tree for the top 25 genes for colon and prostate cancer, the cross-correlation coefficient was used to construct the pair-wise distance matrix D. Each entry in the pair-wise distance matrix was measured by the value of (1-r). Each row/column corresponds to a specific gene and an entry at the intersection of row X and column Y corresponds to the distance of gene expression between gene #X and gene #Y. Such matrix has a diagonal entry of value 0. Only the lower/upper triangular matrix of D is required to construct the relationship tree. After obtaining lower/upper triangular matrix of D, the neighbor-joining method (NJ) algorithm was used to construct the relationship tree [10].
Table 6.
Colon cancer: the top 10 genes and pair-wise gene expression ratio used to discriminate the colon cancer tissue. This table is ranked with decreasing classification efficiency. The threshold values Ti for normal tissues are also provided together with classification efficiency. The list of top 25 genes can be downloaded from http://web.hku.hk/~daniely/microarray.
| Colon Cancer-Original data | Colon Cancer-Transformed data | ||||||||||
| Rank | No. on array | gene accession number | gene info | Threshold for normal tissue type, Tj | discriminating efficiency*/% | Ref | Rank | gene number on array | Threshold for normal tissue type, Ti | discriminating efficiency*/% | Ref |
| 1 | #1659 | M26383 | Human monocyte-derived neutrophil-activating protein (MONAP) mRNA, complete cds. | <62.7375 | 87.1% | [12,13] | 1 | #1537/#1831 | <0.75512 | 93.6% | [27,28] |
| 2 | #753 | M76378 | Human cysteine-rich protein (CRP) gene, exons 5 and 6. | >749.4075 | 83.9% | [26] | 2 | #1831/#1537 | >1.3243 | 93.6% | [27,28] |
| 3 | #613 | X12671 | Human gene for heterogeneous nuclear ribonucleoprotein (hnRNP) core protein A1. | <233.4162 | 82.3% | [33] | 3 | #1827/#481 | <0.074449 | 91.9% | [14,15,39] |
| 4 | #569 | T51571 | P24480 CALGIZZARIN. SERINE/THREONINE-PROTEIN | <309.3037 | 77.4% | [34] | 4 | #1537/#1623 | <1.0533 | 91.9% | [27,40] |
| 5 | #1103 | R97912 | KINASE IPL1 (Saccharomyces cerevisiae) | <70.2738 | 75.8% | [35] | 5 | #1831/#1759 | >1.4003 | 91.9% | [28] |
| 6 | #1759 | J05032 | Human aspartyl-tRNA synthetase alpha-2 subunit mRNA, complete cds. | <41.92 | 75.8% | [36] | 6 | #1623/#1537 | >0.94939 | 91.9% | [27,40] |
| 7 | #241 | M63391 | Human desmin gene, complete cds. | >2787.0425 | 75.8% | [17] | 7 | #365/#1760 | >3.3867 | 91.9% | [41,42] |
| 8 | #818 | R75843 | TRANSLATIONAL INITIATION FACTOR 2 GAMMA SUBUNIT (Homo sapiens) | <152.5662 | 74.2% | [37] | 8 | #1759/#1831 | <0.71414 | 91.9% | [28] |
| 9 | #1960 | T57468 | FIBRILLARIN (HUMAN). | <42.0225 | 74.2% | [38] | 9 | #1760/#365 | <0.29528 | 91.9% | |
| 10 | #1281 | H23544 | GTP-BINDING NUCLEAR PROTEIN RNA (Homo sapiens) | <103.2488 | 74.2% | [20] | 10 | #481/#1827 | >13.432 | 91.9% | [14,15,39] |
*discriminating efficiency using only single gene as discriminating axis
Table 7.
Prostate cancer: the top 10 genes and pair-wise gene expression ratio used to discriminate the prostate cancer tissues. The threshold values Ti for normal tissues are also provided. The list of top 25 genes can be downloaded from http://web.hku.hk/~daniely/microarray.
| Prostate Cancer-Original data | Prostate Cancer-Transformed data | ||||||||||
| Rank | No. on array | Probe no | gene info | Threshold Ri | discriminating efficiency* / % | Ref | Rank | gene number on array | Threshold Ri | discriminating efficiency* / % | Ref |
| 1 | 6185 | 37639_at | Cluster Incl. X07732:Human hepatoma mRNA for serine protease hepsin | <115 | 86.3% | [18] | 1 | #5840/#6185 | >0.37168 | 84.6% | [18,3] |
| 2 | 10537 | 33121_g_at | Cluster Incl. AF045229:Homo sapiens regulator of G protein signaling 10 mRNA | <50 | 80.4% | [43] | 2 | #6185/#5840 | <2.6905 | 84.6% | [18,31] |
| 3 | 8965 | 37720_at | Cluster Incl. M22382:Human mitochondrial matrix protein P1 (nuclear encoded) mRNA | <238 | 80.4% | [44] | 3 | #7775/#205 | <0.22928 | 82.7% | [50,51] |
| 4 | 8554 | 36589_at | Cluster Incl. X15414:Human mRNA for aldose reductase (EC 1.1.1.2) | >35 | 79.4% | [45] | 4 | #8631/#10234 | <5.4561 | 82.7% | [52,53] |
| 5 | 9172 | 38406_f_at | Cluster Incl. AI207842:ao89h09.x1 Homo sapiens cDNA | >626 | 79.4% | [46] | 5 | #10749/#11942 | <0.34585 | 82.7% | [54] |
| 6 | 7067 | 40436_g_at | Cluster Incl. J03592:Human ADP/ATP translocase mRNA | <234 | 78.4% | [47] | 6 | #10234/#8631 | >0.18328 | 82.7% | [52,53] |
| 7 | 9850 | 40282_s_at | Cluster Incl. M84526:Human adipsin/complement factor D mRNA | >182 | 77.5% | [30] | 7 | #8554/#6185 | >0.39823 | 82.7% | [18] |
| 8 | 7066 | 40435_at | Cluster Incl. J03592:Human ADP/ATP translocase mRNA, 3 end, clone pHAT8 M96233 /FEATURE=expanded_cds/DEFINITION=HUMGSTM4A Human | <349 | 76.5% | [47] | 8 | #11942/#10749 | >2.8914 | 82.7% | [54,55] |
| 9 | 12153 | 556_s_at | glutathione transferase class mu number 4(GSTM4) gene | >152 | 76.5% | [48] | 9 | #205/#7775 | >4.3614 | 82.7% | [50,51] |
| 10 | 9093 | 38087_s_at | Cluster Incl. W72186:zd69b10.s1 Homo sapiens cDNA | >62 | 74.5% | [49] | 10 | #6185/#8554 | <2.5111 | 82.7% | [18] |
*discriminating efficiency using only single gene as discriminating axis
Computer hardware and software
A Sun Fire 6800 Server http://www.bioinfo.hku.hk with 24 CPUs (each running with a clock speed of 900 MHz) was employed throughout this study. The computation of correlation coefficient and classification procedures were implemented using the Matlab Technical Programming language (Matlab programs can be downloaded at http://web.hku.hk/~daniely/microarray.
Results
After initial gene selection, respectively 82 and 262 genes (|r|>0.4) were selected from the colon and prostate dataset for downstream analysis (Table 1 and Table 2). Topping the list in both tables were genes that have been found to be either over-expressed/under-expressed in tumors [11]. The first three genes most correlated to cancer in the colon dataset were heavy chain of non-muscle myosin, human monocyte-derived neutrophil-activating protein (MONAP) and human desmin genes. This agrees with the findings from [12,13] that used other statistical tests (z-score, t-test) in a comparable analysis. The heavy chain of non-muscle myosin, denoted as the embryonic smooth muscle myosin heavy chain (SMemb), was found to be down-regulated in cancer. It was also determined experimentally to be a target for the protein encoded by the metastasis-related mts-1 gene [14]. Furthermore, it was demonstrated recently by 5'RACE analysis that heavy chain of non-muscle myosin interacts with ALK genes that have tyrosine kinase activity and oncogenic properties [15]. The human monocyte-derived neutrophil-activating protein (MONAP, interleukin-8), was second on the list. It was significantly up-regulated in the tumor compared to the normal samples. This protein has been linked to the progression of several human cancer types [16]. It was believed that over-expression of MONAP plays an important role in tumor angiogenesis and tumor aggression. The human desmin gene is the third on the list, and it was found to be down-regulated in tumor. Interestingly, this gene also showed significantly reduced expression in other cancer types such as the melanoma cell line [17].
Table 1.
Colon cancer: the gene retained for classification of tissue types. This table contains the genes and their descriptions. The key genes are selected based on how correlated their average intensity to the normal and tumor tissues. The genes are placed in the order of descending correlation coefficient r. Ten key genes are reported, the complete table can be downloaded at http://web.hku.hk/~daniely/microarray. Entire data for the experiment can be downloaded from http://microarray.princeton.edu/oncology/.
| No. on array | Gene accession number with correlation >0.4 to cancer tissue type | Info | Correlation |
| 481 | R87126 | MYOSIN HEAVY CHAIN, NONMUSCLE (Gallus gallus) | 0.6327 |
| 1659 | M26383 | Human monocyte-derived neutrophil-activating protein (MONAP) mRNA, complete cds. | 0.5853 |
| 241 | M63391 | Human desmin gene, complete cds. | 0.5848 |
| 1760 | H08393 | COLLAGEN ALPHA 2(XI) CHAIN (Homo sapiens) | 0.5760 |
| 1030 | R36977 | P03001 TRANSCRIPTION FACTOR IIIA ;. | 0.5741 |
| 1411 | J02854 | MYOSIN REGULATORY LIGHT CHAIN 2, SMOOTH MUSCLE ISOFORM (HUMAN);contains element TAR1 repetitive element | 0.5680 |
| 1759 | J05032 | Human aspartyl-tRNA synthetase alpha-2 subunit mRNA, complete cds. | 0.5670 |
| 613 | X12671 | Human gene for heterogeneous nuclear ribonucleoprotein (hnRNP) core protein A1. | 0.5583 |
| 365 | Z50753 | H.sapiens mRNA for GCAP-II/uroguanylin precursor. | 0.5494 |
| 753 | M76378 | Human cysteine-rich protein (CRP) gene, exons 5 and 6. | 0.5354 |
Table 2.
Prostate cancer: the key gene retained for classification of tissue types. This table contains the genes and their descriptions. The key genes are selected based on how correlated their average intensity to the normal and tumor tissues. The genes are placed in the order of descending correlation coefficient r. Ten key features were shown, the complete table can be downloaded at http://web.hku.hk/~daniely/microarray. Entire data for the experiment can be downloaded from http://www-genome.wi.mit.edu/MPR/Prostate.
| No. on array | Gene probe with correlation >0.4 to cancer tissue type | Info | Correlation |
| 6185 | 37639_at | Cluster Incl. X07732:Human hepatoma mRNA for serine protease hepsin | 0.7119 |
| 8965 | 37720_at | Cluster Incl. M22382:Human mitochondrial matrix protein P1 (nuclear encoded) mRNA, complete cds M93036 /FEATURE=mRNA /DEFINITION=HUMGA7A08 | 0.7018 |
| 12148 | 575_s_at | Human (clone 21726) carcinoma-associated antigen GA733-2 (GA733-2) mRNA | 0.6917 |
| 6462 | 38634_at | Cluster Incl. M11433:Human cellular retinol-binding protein mRNA | 0.6514 |
| 10138 | 41288_at | Cluster Incl. AL036744:DKFZp564I1663_r1 Homo sapiens cDNA | 0.6367 |
| 12153 | 556_s_at | M96233 /FEATURE=expanded_cds/DEFINITION=HUMGSTM4A Human glutathione transferase class mu number 4 (GSTM4) gene | 0.6217 |
| 6866 | 39756_g_at | Cluster Incl. Z93930:Human DNA sequence from clone 292E10 on chromosome 22q11-12. Contains the XBP1 gene for X-box binding protein 1 (TREB5), ESTs, STSs, GSSs and a putative CpG island | 0.6201 |
| 4365 | 41468_at | Cluster Incl. M30894:Human T-cell receptor Ti rearranged gamma-chain mRNA V-J-C region X14885 /FEATURE=mRNA /DEFINITION=HSTGF31 | 0.6193 |
| 10956 | 1767_s_at | H.sapiens gene for transforming growth factor-beta 3 (TGF- beta 3) | 0.6160 |
| 9172 | 38406_f_at | Cluster Incl. AI207842:ao89h09.x1 Homo sapiens cDNA, 3 end / | 0.6155 |
From the prostate dataset, the most cancer-correlated gene is the human hepatoma gene coding for serine protease hepsin. Brief literature search in PubMed showed that hepsin is a well-characterized transmembrane protease that is expressed at high level in tumor. Three separate studies identified hepsin as a significant cancer biomarker that can be used for cancer diagnosis [18]. The second gene on the list was the human mitochondrial matrix protein P1. This gene has been correlated to different cancer types with consistent up-regulation in tumor [13]. The third gene is the carcinoma-associated antigen GA733-2, which was among the 216 cancer markers identified by Ernst's group in Germany [19].
Effect of data transformation on coefficient of variation
To date, reliable markers with low coefficient of variation (CV) are generally lacking. Discovering robust cancer marker is crucial for the purpose of successful cancer diagnosis. We investigated the CV between samples after data transformation: the lowest CVs decreased to 16.5% in the colon dataset while it increased to 25.8% for the prostate dataset (Table 3 and Table 4). Topping the list for both dataset were the pair-wise gene expression ratio for genes #119/#54 (elongation factor 1-delta and 40S ribosomal protein S24) and #10614/#5871 (zq58b03.r1 Homo sapiens cDNA and nuclear matrix protein NXP2), which revealed informative pair-wise gene interaction in relation with their corresponding tissue phenotypes. They reflected how cell adjusts to their pair-wise product in response to physiological changes. Based on these observations, we found that the relative abundance between the numerator and denominator exhibited a strong mutual dependency, and had strong correlation to tissue phenotype. For pair-wise gene expression ratio #119/#54, the elongation factor 1-delta is involved in a sequence of events during the decoding of mRNA on the ribosome [20]. For the ratio of #10614/#5871, it corresponds to novel genes that do not yet have known function. A search in the DNA non-redundant (nr) database for gene #10614 yielded 83% DNA identity to a segment on chromosome 9. On the other hand, a search in non-redundant (nr) database for #5871 revealed 72.3% DNA identity to the cDNA of mouse that incorporates proteins involved in chromosome partitioning and cell decision [21].
Table 3.
Colon cancer: the coefficient of variation (CV) for the original dataset and transformed dataset. This table shows ten features with lowest coefficient of variation, the complete table can be downloaded at http://web.hku.hk/~daniely/microarray.
| Colon Cancer | Colon Cancer (Transformed) | |||||
| Rank | No. on array | Gene Acession Name | Coefficient of variation | Rank | Gene Acession Number | Coefficient of variation |
| 1 | #39 | T57619 | 45.33% | 1 | #119/#54 | 16.53% |
| 2 | #119 | T51529 | 48.23% | 2 | #54/#119 | 17.19% |
| 3 | #54 | T48804 | 48.61% | 3 | #39/#31 | 18.88% |
| 4 | #58 | T71025 | 49.03% | 4 | #119/#31 | 19.85% |
| 5 | #365 | Z50753 | 49.60% | 5 | #31/#39 | 19.86% |
| 6 | #26 | T95018 | 49.79% | 6 | #31/#119 | 20.01% |
| 7 | #387 | U30825 | 50.74% | 7 | #39/#119 | 20.64% |
| 8 | #64 | H55758 | 52.48% | 8 | #119/#39 | 20.71% |
| 9 | #1760 | H08393 | 52.92% | 9 | #54/#39 | 20.83% |
| 10 | #31 | T61609 | 53.15% | 10 | #26/#119 | 21.50% |
Table 4.
Prostate cancer: the coefficient of variation (CV) for the original dataset and transformed dataset according to their rank. This table shows 20 data with lowest coefficient of variation, the complete table can be downloaded at http://web.hku.hk/~daniely/microarray.
| Prostate Cancer | Prostate Cancer (transformed) | |||||
| Rank | No. on array | Gene Accession Name | Coefficient of variation | Rank | Gene Acession Number | Coefficient of variation |
| 1 | #5871 | 36845_at | 24.54% | 1 | (#10614)/(#5871) | 25.78% |
| 2 | #8965 | 37720_at | 25.02% | 2 | (#7532)/(#6236) | 26.75% |
| 3 | #8851 | 37367_at | 26.75% | 3 | (#5871)/(#10614) | 27.15% |
| 4 | #10614 | 33198_at | 28.47% | 4 | (#5871)/(#10138) | 27.52% |
| 5 | #8160 | 34877_at | 28.98% | 5 | (#9599)/(#10138) | 27.94% |
| 6 | #5840 | 36814_at | 31.02% | 6 | (#7715)/(#8889) | 27.98% |
| 7 | #5954 | 36928_at | 31.77% | 7 | (#7532)/(#9288) | 28.33% |
| 8 | #10138 | 41288_at | 31.97% | 8 | (#8160)/(#10614) | 28.41% |
| 9 | #6865 | 39755_at | 32.00% | 9 | (#9424)/(#9599) | 28.86% |
| 10 | #9599 | 39551_at | 32.07% | 10 | (#7520)/(#10138) | 29.14% |
Prior to data transformation the lowest coefficients of variations for single gene expression were 45.3% and 24.5% for colon and prostate datasets respectively. When using the data transformation we proposed, significant improvement was achieved in the colon dataset. Interestingly, this was followed by an improved data correlation to the tissue phenotype as well as to the classification efficiency. We did not observe a similar improvement of the CV, data correlation to tissue classes or classification efficiency in the prostate dataset.
Correlations of the single gene expression and pair-wise gene expression ratio
The distribution of correlation coefficients between genes and tissue phenotypes for the colon and prostate datasets is shown in Figure 3. The distributions are positively and negatively skewed for both datasets. The two red lines separate genes with |r| >0.4 from the bulk (Table 1 and 2). They retained respectively 82 and 262 genes from the colon and prostate datasets. To study the possible interaction between pair-wise genes, we estimated the statistical correlation of gene expressions. Both the distributions for the correlation coefficient and the extreme cases are shown in Figures 4 and 5. Both figures emphasize the true nature of gene-gene co-regulations – a complex biological mechanism, that most often has been over-simplified when we treat the gene expression as an independent variables [22]. For example, Figure 4 and Figure 5 suggested that the expressions of genes belonging to a common subset are most likely correlated to each other (e.g.: Gene #31 vs #119 in colon cancer (r = 0.95306) and gene #7775 vs #10749 in prostate cancer (r = 0.92922)). It should be pointed out that the two humps in the probability density function are not zero-centered, but concentrated at non-zero correlation r. For colon dataset, positive correlation was the dominant type. For prostate dataset, a balanced distribution in their gene correlation was observed. We determined that some improvement in tissue classification is achieved when pair-wise gene expression ratio was used as discriminating axes instead of using a single gene expression (Figure 2). The reason is that pair-wise gene expression ratio has higher correlation to tissue phenotype with lower CV (Table 5).
Figure 3.
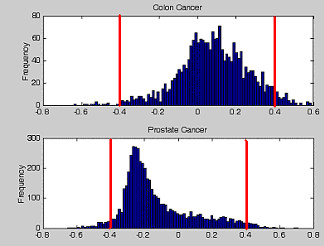
The histogram for correlation of coefficient r between single gene expression and the tissue types for the colon and prostate tissue cancer. The distribution shows coefficient of correlation between single gene expression and cancer phenotype. Their extrema of correlation coefficient |r|>0.4 (represented in red lines) were extracted for downstream data analysis.
Figure 4.
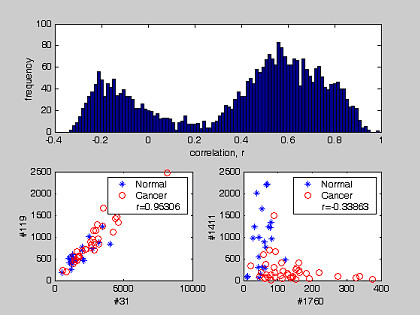
The distribution of cross-correlation between two single gene expression patterns in colon dataset. The distribution shows the coefficient of correlation between expression patterns for any pair of gene markers. Their extrema scenarios were also plotted with their corresponding r value.
Figure 5.
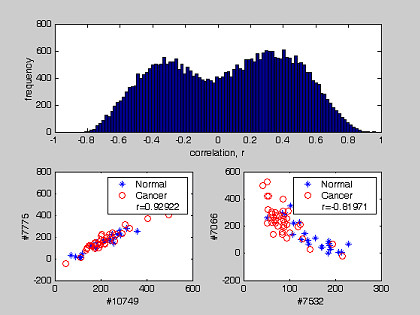
The distribution of cross-correlation between two genes expression patterns in prostate dataset. The distribution shows coefficient of correlation between any pair of gene markers. Their extrema plots of correlation coefficient were also plotted with corresponding r value.
Table 5.
Colon and prostate cancer: Ten key pair-wise gene expression ratios that are most correlated to tissue phenotype, the complete table can be downloaded at http://web.hku.hk/~daniely/microarray. They were determined to be accurate discriminating axes.
| Colon Cancer | Prostate Cancer | ||
| Gene Number | Correlation | Gene Number | Correlation |
| #481/#67 | 0.7866 | #4751/#6185 | 0.7454 |
| #1831/#1537 | 0.7662 | #9288/#6185 | 0.7393 |
| #481/#269 | 0.7632 | #8892/#6185 | 0.7383 |
| #255/#1760 | 0.7545 | #6185/#8851 | 0.7371 |
| #481/#508 | 0.7534 | #7532/#6185 | 0.7349 |
| #481/#768 | 0.7495 | #8136/#6185 | 0.7335 |
| #1831/#1244 | 0.7482 | #205/#5954 | 0.7291 |
| #237/#1760 | 0.7468 | #9059/#6185 | 0.7241 |
| #1482/#1537 | 0.7460 | #4432/#6185 | 0.7236 |
| #481/#613 | 0.7369 | #8965/#10614 | 0.721 |
Gene expression and tissue type correlation
Several previous studies have already endeavored to identify correlations between specific gene expression and cancerous transformation [4,13,23]. In the present study, we identified several novel target genes that clearly distinguish the two different tissue phenotypes with high discriminating efficiency (>74%) (Table 6 and Table 8). Some of those have previously been documented in studies that did not involve expression profiling as cancer related genes (Human monocyte-derived neutrophil-activating protein (MONAP) and Human hepatoma mRNA for serine protease hepsin), others (Human gene for heterogeneous nuclear ribonucleoprotein (hnRNP), P24480 CALGIZZARIN, Human mitochondrial matrix protein P1, Human mRNA for aldose reductase and human adipsin) have not been identified from in-silico studies of tissue DNA-array expression data. The cancer related genes for colon and prostate cancer were ranked according to their discriminating predictive power. The list should provide hints for researchers during selection of molecular target for diagnostic, prognostic or attempts to cure the disease. Overall classification results and accuracies for each N-feature model classifier across two datasets were reported in Table 6, 7 and 8. In the following section, we will discuss a few important genes or pair-wise gene expression ratios from Table 6 and Table 7 that resulted in the optimum classification accuracy (Table 8B). They are the most efficient combination of discriminating axes for classifying tissue types because they delineate correctly all the normal/tumor tissues with the lowest percentage of false prediction.
Table 8.
Accuracy of N-feature model classifier. The optimum classification accuracy, the mean classification accuracy and the standard deviation for the N-feature classifier (N<11).
| Colon cancer–Original expression data | Colon cancer–Transformed expression data | ||||||
| Order or classifier | Optimum Accuracy* / % | Mean Accuracy* / % | Standard Deviation | Order or classifier | Optimum Accuracy* / % | Mean Accuracy* / % | Standard Deviation |
| 1 | 87.10% | 76.77% | 4.17% | 1 | 93.55% | 91.24% | 1.22% |
| 2 | 91.94% | 83.33% | 4.38% | 2 | 98.39% | 95.00% | 1.95% |
| 3 | 95.16% | 87.07% | 4.06% | 3 | 98.39% | 96.47% | 1.53% |
| 4 | 95.16% | 89.37% | 3.58% | 4 | 98.39% | 97.20% | 1.23% |
| 5 | 95.16% | 90.88% | 3.10% | 5 | 98.39% | 97.60% | 0.99% |
| 6 | 95.16% | 91.94% | 2.70% | 6 | 98.39% | 97.84% | 0.83% |
| 7 | 95.16% | 92.72% | 2.38% | 7 | 98.39% | 98.00% | 0.70% |
| 8 | 95.16% | 93.31% | 2.09% | 8 | 98.39% | 98.12% | 0.60% |
| 9 | 95.16% | 93.78% | 1.83% | 9 | 98.39% | 98.21% | 0.50% |
| 10 | 95.16% | 94.15% | 1.57% | 10 | 98.39% | 98.28% | 0.40% |
| Prostate cancer–Original expression data | Prostate cancer–Transformed expression data | ||||||
| Order or classifier | Optimum Accuracy* / % | Mean Accuracy* / % | Standard Deviation | Order or classifier | Optimum Accuracy* / % | Mean Accuracy* / % | Standard Deviation |
| 1 | 86.27% | 75.82% | 4.31% | 1 | 84.62% | 81.92% | 2.28% |
| 2 | 100.00% | 91.27% | 7.89% | 2 | 98.39% | 90.84% | 4.18% |
| 3 | 100.00% | 95.98% | 5.53% | 3 | 100.00% | 93.64% | 3.40% |
| 4 | 100.00% | 97.91% | 3.87% | 4 | 100.00% | 95.00% | 2.94% |
| 5 | 100.00% | 98.86% | 2.76% | 5 | 100.00% | 95.90% | 2.68% |
| 6 | 100.00% | 99.38% | 1.98% | 6 | 100.00% | 96.59% | 2.51% |
| 7 | 100.00% | 99.67% | 1.41% | 7 | 100.00% | 97.16% | 2.36% |
| 8 | 100.00% | 99.83% | 0.99% | 8 | 100.00% | 97.66% | 2.23% |
| 9 | 100.00% | 99.90% | 0.67% | 9 | 100.00% | 98.10% | 2.09% |
| 10 | 100.00% | 99.96% | 0.43% | 10 | 100.00% | 98.49% | 1.94% |
For the sake of brevity, we will discuss three single gene expressions and two pair-wise gene expression ratios from colon cancer. For prostate cancer, two single gene expressions and two pair-wise gene expression ratios will be discussed.
For colon cancer single gene expression, three axes for discriminating tissue types are: 1) Human monocyte-derived neutrophil-activating protein (MONAP); 2) Human desmin gene and 3) Human cysteine-rich protein (CRP) gene. Their threshold values were determined to be 62.73, 2787.0 and 749.4 respectively.
For colon cancer pair-wise gene expression ratio, the two axes for discriminating tissue types are: 1) #1831/#1537 and 2) #753/#768. Their threshold values were reported to be 1.32 and 1.85 respectively.
For prostate cancer individual gene expression, the two axes for discriminating tissue types are: 1) Human hepatoma mRNA for serine protease hepsin and 2) Human adipsin. Their threshold values were reported to be 115.0 and 182.0 respectively.
For prostate cancer pair-wise gene expression ratio, the two axes for discriminating tissue types are: 1) #6185/#5840 and 2) #6185/#6749. Their threshold values were reported to be 2.69 and 2.55 respectively.
To illustrate graphically the result of tissue classification, two examples, each based on three genes or pair-wise gene expression ratios that altogether yielded the optimum classification efficiency for the prostate cancer are shown (Figure 6, Figure 7).
Figure 6.
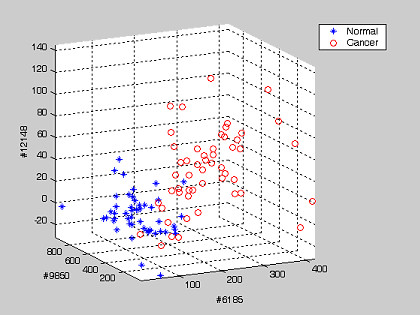
Prostate dataset: an example showing the projection of 102 tissue samples on the top three discriminating axes of the single gene expression patterns. The gene numbers are shown as the axis labels. The threshold values Ti for normal tissues on each axis are tabulated on Table 7.
Figure 7.
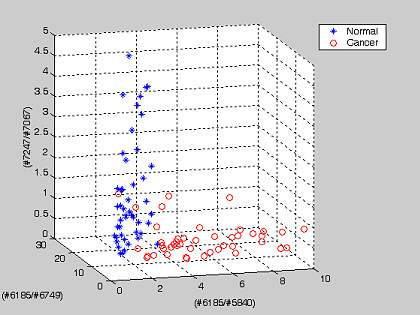
Prostate dataset: an example showing the projection of 102 tissue samples on the top three discriminating axes of the pair-wise gene expression ratio. The gene numbers are shown as the axis labels. The threshold values Ti for normal tissues on each axis are tabulated on Table 7.
Constructing the relationship tree for top 25 gene for colon and prostate cancer
The relationship tree for top 25 genes listed in Table 6 and Table 7 were constructed based on the cross-correlation between gene expressions (Figure 8). We employed the established 'neighbor-joining' clustering method [10] to group different genes based on their correlated expression patterns across all tissue samples (meaning that genes expression that are correlated will appear in the same branch of the clustering tree), using a novel distance measurement to quantify how change in the expression for one gene interfered with that of another gene. The principle of this method is to cluster pairs of operational taxonomic units (OTUs [=neighbors of similar gene expression]) that minimize the total branch length at each stage of clustering of OTUs starting with a star-like tree. Figure 8 revealed two major clusters of genes. The first cluster corresponded to down-regulated genes, the second cluster represented up-regulated genes. Also, the most efficient discriminating axes (feature genes) reside at the basal position for each cluster. In bacteria many genes are co-expressed as single transcription units. This was used as a control study to validate the methodology of grouping genes, we implemented this distance measurement on bacteria gene arrays (B. subtilis and E. coli) and successfully determined the co-regulated operon gene structures (supplementary file #1).
Figure 8.
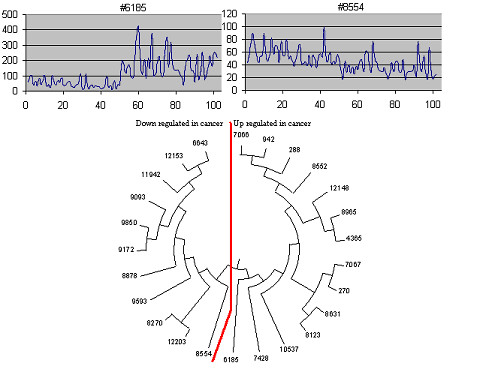
Inter-relationship of gene expression gene expression for top 25 prostate cancer genes extracted from Table 8. The tree structure was derived using neighbor-joining algorithm [10]. Two clusters of gene expression were observed, namely the up-regulated (#6185) and down – regulated (#8554) genes in cancer tissues.
Discussion
Data transformation to investigate pair-wise gene expression ratios
As the expression profiling technologies mature, the identification of significant cancer-related signals from noisy datasets (characterized by a high CV) remains a major challenge. In particular, a robust normalization method is critical to ascertain that arrays from two experiments are comparable with minimum noise prior downstream analysis. However, the existing normalization methods pose limitations due to the lack of good models to account for sources of experimental and biological variations [24]. Hoffmann et al. [25] employed different normalization methods to analyse the same dataset, and demonstrated that the numbers of genes detected as differentially expressed differed by a huge factor depending on which normalization methods used. The problem is exacerbated further by the presence of different array formats, experimental designs and methods.
Here, instead of resolving to single gene expression, that depends heavily on normalization, for tissue classification, we presented a transformation method that uses pair-wise gene expression ratios within the same experiment as the discriminating axes. By doing so, we aimed to minimize the influence of different normalization methods considering that an experiment is self-consistent with the same factors affecting all genes in the same fashion. The rationale is that even when the normalization methods differ between two array experiments, their pair-wise gene expression ratios within the same experiment will remain relatively stable. If reliable cancer-related signal, exist in the form of pair-wise gene expression ratio, were indeed discovered successfully, they will be relatively independent from the normalization method used on a dataset.
The improvement in CV (Table 3) and overall classification accuracy (Table 7) for colon dataset after introduction of data transformation signifies two implications: First, the transformation is able to increase the signal to noise ratio (SNR) of the cancer related signal because the resulted pair-wise gene expression ratios correlate stronger to tissue phenotype. Second, because the pair-wise gene expression ratios are less dispersed than single gene expression, using the pair-wise gene expression ratios to classify tissue types will be much more reliable and accurate (Table 8). Despite the benefits mentioned, this data transformation introduced a computational limitation due to the enormous amount of feature combinations to be processed, especially when N-feature model classifiers for N>4 are considered (If 100 features are selected, and 10-feature model classifier is investigated, the search space will be 100C10= 1.731030945644000 × 10¹³ different combination of features). As a result, more computation time will be required to search all possibilities. As an example, the discriminating axes that accounted for the optimum accuracy in 1 to 3-feature model classifier are reported in Table 9.
Table 9.
The discriminating axes. The discriminating axes that accounted for the optimum accuracy in 1 to 3-feature model classifier.
| Order or classifier | Optimum Accuracy* / % | Discriminating axes | Order or classifier | Optimum Accuracy* / % | Discriminating axes |
| 1 | 87.10% | #1659 | 1 | 93.55% | #1831/#1537 |
| 2 | 91.94% | (#241)&(#1659) | 2 | 98.39% | (#753/#768) & (#1831/#1537) |
| 3 | 95.16% | (#241)&(#1659)&(#1759) | 3 | 98.39% | (#753/#768) & (#1831/#1537)&(#481/#1394) |
| Prostate cancer–Original expression data | Prostate cancer–Transformed expression data | ||||
| Order or classifier | Optimum Accuracy* / % | Discriminating axes | Order or classifier | Optimum Accuracy* / % | Discriminating axes |
| 1 | 86.27% | (#6185) | 1 | 84.62% | (#6185/#5840) |
| 2 | 100.00% | (#6185)&(#9850) | 2 | 100.00% | (#6185/#5840)&(#6185/#6749) |
| 3 | 100.00% | (#6185)&(#9850)&(#12148) | 3 | 100.00% | (#6185/#5840)&(#6185/#6749)&(#7247/#7067) |
* : best accuracy based on the specified number of gene/gene ratio as discriminating axes ****Please do not delete from here on, needed for the correct order of reference list****** [32-54]
Regarding the high classification accuracy reported in Table 8, it should be stressed that this was achieved by involving all tissue samples during the derivation of the threshold value, Ti, in the feature selection procedure. In other word, instead of adopting the more conservative classification accuracy test where only a subset of tissue samples are used to derive a set of classification criteria (threshold values), we adjusted our methodology to use all tissue samples so that our results are unbiased (when comparing the outcome from single gene and pair-wise gene ratio) and in-line with our objective that is to compare the classification efficiency between single gene and pair-wise gene ratio. Admittedly, we have a noisy dataset whereby selecting a subset of tissue samples that are a representable population for the entire dataset remains a challenge [5] (given that we have a small and unbalanced dataset, particularly the colon dataset). Eventually, we might run into ambiguous/contradicting results using a different population subset of tissue samples. Furthermore, we might miss important features (single gene expression/ pair-wise gene expression ratio) because of the biased training dataset. By including all tissue samples for both studies (single gene and pair-wise gene ratio), we aimed to derive the most reliable threshold values and classified tissue samples based on them. Since the same methodology was applied for both studies, the comparison of classification efficiency is valid and will reflect how well each feature (single gene and pair-wise gene ratio) can be used to delineate tissue samples.
The implication derived from the classification results
For colon dataset, three axes for discriminating tissues are: 1) Human monocyte-derived neutrophil-activating protein (MONAP); 2) Human desmin gene and 3) Human cysteine-rich protein (CRP) gene. The association of the first two genes and cancer biology had been discussed earlier. We will discuss the Human cysteine-rich protein gene. The expression and induction of this protein has been associated with protection against DNA damage, oxidative stress and apoptosis [26]. In the colon dataset, we observed down-regulation of this protein in tumor. This suggested lack of protection against DNA damage.
For colon cancer pair-wise gene expression ratio, the two axes for discriminating tissues are: 1) #1831/#1537 and 2) #753/#768. Using these two axes, 98.4% of the tissue samples can be classified correctly. The expression ratio between #1831 (gelsolin precursor) and #1537 (vascular endothelial growth factor) was able to discriminate 93.6% of the total tissue data. The vascular endothelial growth factor was determined recently to be a plausible biomarker for colon cancer [27]. Gelsolin had been found to suppress tumorigenicity in different cancer samples, including lung, bladder and breast [28]. When they were used individually as a discriminating axis, they were only able to classify correctly 66.1% and 67.7% of all tissue samples. Furthermore, the expression ratio between #753 (Human cysteine-rich protein) and #768 (the macrophage migration inhibitory factor) was able to discriminate 90.3% of total tissue type. The human cysteine-rich protein was discussed in the previous section. The macrophage migration inhibitory factor (MIF) functions as a pluripotent cytokine involved in broad-spectrum pathophysiological events in association with inflammation and immune responses. Several reports, including ours, have suggested that MIF is also involved in tumorigenesis [29]. When they were used individually as single discriminating axis, they were only able to classify correctly 83.9% and 66.1% of all tissues.
For prostate cancer single gene expression, the two axes for discriminating tissues are: 1) Human hepatoma mRNA for serine protease hepsin, and 2) Human adipsin. The first gene was discussed in the previous paragraph. For the second gene, adipsin had also been suggested by Chow et al. [30] as a good cancer marker for studying the basic biology of cancer.
For prostate cancer pair-wise gene expression ratio, the two axes for discriminating tissues are: 1) #6185/#5840 and 2) #6185/#6749. Using these two axes, all tissue samples can be classified correctly. The expression ratio between #6185 (Human hepatoma mRNA for serine protease hepsin) and #5840 (Homo sapiens mRNA for KIAA1109 protein) was able to discriminate 92.2% of total tissues. The human hepatoma mRNA for serine protease hepsin had been determined to be an important marker for cancer cell development [11,18]. The KIAA1109 protein is an unknown protein in human chromosome four [31]. A homology search against the non-redundant databases yielded no significant hit to known genes. When they were used individually as a discriminating axis, they were only able to classify correctly 86.3% and 61.8% of all tissues. On the other hand, the expression ratio between #6185 (Human hepatoma mRNA for serine protease hepsin) and #6749 (Homo sapiens mRNA for KIAA1055 protein) was able to discriminate 90.10% of total tissues. The human hepatoma mRNA for serine protease hepsin was discussed in the previous section. The KIAA1055 protein is an unknown protein in human chromosome 15 [21,31]. A homology search against the non-redundant databases yielded 40.7% DNA identity to a novel human cDNA that had been found to function as a cancer inhibiting protein [21]. When they were used individually as a discriminating axis, they were only able to classify correctly 86.3% and 62.8% of all tissues.
Conclusion
By comparing the tissue classification methods based on the single gene expression and the pair-wise gene expression ratio in two microarray datasets, we reached the following conclusions:
1. The minimum coefficient of variation decreased from 45.33% to 16.53% for colon dataset but increased marginally from 24.54% to 25.78% in prostate dataset.
2. The correlation coefficient, r, of the discriminating axis that correlates maximally to the tissue phenotype improves from 0.63 to 0.79 and 0.71 to 0.75 in colon and prostate dataset respectively.
3. The optimum accuracy for 1-feature model classifier (using single gene or pair-wise gene expression ratio as discriminating axis) improved from 87.1% to 93.55% in colon dataset. In prostate dataset, nine out of the top 10 discriminating axes showed significant improvement. The mean accuracy for 1-gene classifier improved from 76.8% to 91.2% and 75.8% to 81.9% in both datasets.
4. The comparable classification accuracy achieved after data transformation suggested that there exist some cancer-related signals in the form of pair-wise gene expression ratio, especially prominent in the colon dataset.
5. Through the single gene analysis, we identified key biomarkers that agree with the findings by other researchers. In addition, study on gene-to-gene correlation and the classification outcome based on the pair-wise gene expression ratio suggested that genetic network within a cluster of cancer-related genes should be explored further.
Competing interests
The authors declare that they have no competing interests.
Authors' contributions
YLY proposed the idea, participated in the design, performed the statistical analysis and wrote the first draft of the manuscript.
AD participated in the design and overall coordination of this study as well as in the writing of the manuscript.
XWZ participated in the design of the study.
YCW, XHW and MTL participated during the revision phase of this study.
All authors read and approved the final manuscript.
Pre-publication history
The pre-publication history for this paper can be accessed here:
Acknowledgments
Acknowledgements
Indispensable support was provided by the doctoral fellowship from The University of Hong Kong (HKU) and well as the Hong Kong Innovation and Technology Fund (ITF), BIOSUPPORT Programme. Finally, we wish to thank Dr Ralf Altmeyer for his critical interest for this work as he came at the head of the HKU-Pasteur Research Centre.
Contributor Information
YeeLeng Yap, Email: daniely@hkusua.hku.hk.
XueWu Zhang, Email: xwzhang@hkucc.hku.hk.
MT Ling, Email: patling@hkucc.hku.hk.
XiangHong Wang, Email: xhwang@hkucc.hku.hk.
YC Wong, Email: ycwong@hkucc.hku.hk.
Antoine Danchin, Email: adanchin@pasteur.fr.
References
- Hanahan D, Weinberg RA. The hallmarks of cancer. Cell. 2000;100:57–70. doi: 10.1016/S0092-8674(00)81683-9. [DOI] [PubMed] [Google Scholar]
- Simon R, Radmacher MD, Dobbin K, McShane LM. Pitfalls in the use of DNA microarray data for diagnostic and prognostic classification. J Natl Cancer Inst. 2003;95:14–18. doi: 10.1093/jnci/95.1.14. [DOI] [PubMed] [Google Scholar]
- Krajewski P, Bocianowski J. Statistical methods for microarray assays. J Appl Genet. 2002;43:269–278. [PubMed] [Google Scholar]
- Zhang H, Yu CY, Singer B, Xiong M. Recursive partitioning for tumor classification with gene expression microarray data. Proc Natl Acad Sci U S A. 2001;98:6730–6735. doi: 10.1073/pnas.111153698. [DOI] [PMC free article] [PubMed] [Google Scholar]
- Ambroise C, McLachlan GJ. Selection bias in gene extraction on the basis of microarray gene-expression data. Proc Natl Acad Sci U S A. 2002;99:6562–6566. doi: 10.1073/pnas.102102699. [DOI] [PMC free article] [PubMed] [Google Scholar]
- Gardner TS, di Bernardo D, Lorenz D, Collins JJ. Inferring genetic networks and identifying compound mode of action via expression profiling. Science. 2003;301:102–105. doi: 10.1126/science.1081900. [DOI] [PubMed] [Google Scholar]
- Bo T, Jonassen I. New feature subset selection procedures for classification of expression profiles. Genome Biol. 2002;3:RESEARCH0017. doi: 10.1186/gb-2002-3-4-research0017. [DOI] [PMC free article] [PubMed] [Google Scholar]
- Alon U, Barkai N, Notterman DA, Gish K, Ybarra S, Mack D, Levine AJ. Broad patterns of gene expression revealed by clustering analysis of tumor and normal colon tissues probed by oligonucleotide arrays. Proc Natl Acad Sci U S A. 1999;96:6745–6750. doi: 10.1073/pnas.96.12.6745. [DOI] [PMC free article] [PubMed] [Google Scholar]
- Singh D, Febbo PG, Ross K, Jackson DG, Manola J, Ladd C, Tamayo P, Renshaw AA, D'Amico AV, Richie JP, Lander ES, Loda M, Kantoff PW, Golub TR, Sellers WR. Gene expression correlates of clinical prostate cancer behavior. Cancer Cell. 2002;1:203–209. doi: 10.1016/S1535-6108(02)00030-2. [DOI] [PubMed] [Google Scholar]
- Saitou N, Nei M. The neighbor-joining method: a new method for reconstructing phylogenetic trees. Mol Biol Evol. 1987;4:406–425. doi: 10.1093/oxfordjournals.molbev.a040454. [DOI] [PubMed] [Google Scholar]
- Dhanasekaran SM, Barrette TR, Ghosh D, Shah R, Varambally S, Kurachi K, Pienta KJ, Rubin MA, Chinnaiyan AM. Delineation of prognostic biomarkers in prostate cancer. Nature. 2001;412:822–826. doi: 10.1038/35090585. [DOI] [PubMed] [Google Scholar]
- Li L, Darden TA, Weinberg CR, Levine AJ, Pedersen LG. Gene assessment and sample classification for gene expression data using a genetic algorithm/k-nearest neighbor method. Comb Chem High Throughput Screen. 2001;4:727–739. doi: 10.2174/1386207013330733. [DOI] [PubMed] [Google Scholar]
- Kishino H, Waddell PJ. Correspondence analysis of genes and tissue types and finding genetic links from microarray data. Genome Inform Ser Workshop Genome Inform. 2000;11:83–95. [PubMed] [Google Scholar]
- Kriajevska MV, Cardenas MN, Grigorian MS, Ambartsumian NS, Georgiev GP, Lukanidin EM. Non-muscle myosin heavy chain as a possible target for protein encoded by metastasis-related mts-1 gene. J Biol Chem. 1994;269:19679–19682. [PubMed] [Google Scholar]
- Lamant L, Gascoyne RD, Duplantier MM, Armstrong F, Raghab A, Chhanabhai M, Rajcan-Separovic E, Raghab J, Delsol G, Espinos E. Non-muscle myosin heavy chain (MYH9): a new partner fused to ALK in anaplastic large cell lymphoma. Genes Chromosomes Cancer. 2003;37:427–432. doi: 10.1002/gcc.10232. [DOI] [PubMed] [Google Scholar]
- Xu L, Xie K, Mukaida N, Matsushima K, Fidler IJ. Hypoxia-induced elevation in interleukin-8 expression by human ovarian carcinoma cells. Cancer Res. 1999;59:5822–5829. [PubMed] [Google Scholar]
- Gutgemann A, Golob M, Muller S, Buettner R, Bosserhoff AK. Isolation of invasion-associated cDNAs in melanoma. Arch Dermatol Res. 2001;293:283–290. doi: 10.1007/s004030100232. [DOI] [PubMed] [Google Scholar]
- Stephan C, Yousef GM, Scorilas A, Jung K, Jung M, Kristiansen G, Hauptmann S, Kishi T, Nakamura T, Loening SA, Diamandis EP. Hepsin is highly over expressed in and a new candidate for a prognostic indicator in prostate cancer. J Urol. 2004;171:187–191. doi: 10.1097/01.ju.0000101622.74236.94. [DOI] [PubMed] [Google Scholar]
- Ernst T, Hergenhahn M, Kenzelmann M, Cohen CD, Ikinger U, Kretzler M, Hollstein M, Grone HJ. [Gene expression profiling in prostatic cancer] Verh Dtsch Ges Pathol. 2002;86:165–175. [PubMed] [Google Scholar]
- Valle M, Zavialov A, Li W, Stagg SM, Sengupta J, Nielsen RC, Nissen P, Harvey SC, Ehrenberg M, Frank J. Corrigendum: Incorporation of aminoacyl-tRNA into the ribosome as seen by cryo-electron microscopy. Nat Struct Biol. 2003;10:1074. doi: 10.1038/nsb1003. [DOI] [PubMed] [Google Scholar]
- Kikuno R, Nagase T, Waki M, Ohara O. HUGE: a database for human large proteins identified in the Kazusa cDNA sequencing project. Nucleic Acids Res. 2002;30:166–168. doi: 10.1093/nar/30.1.166. [DOI] [PMC free article] [PubMed] [Google Scholar]
- Nakayama M, Kikuno R, Ohara O. Protein-protein interactions between large proteins: two-hybrid screening using a functionally classified library composed of long cDNAs. Genome Res. 2002;12:1773–1784. doi: 10.1101/gr.406902. [DOI] [PMC free article] [PubMed] [Google Scholar]
- Bektic J, Wrulich OA, Dobler G, Kofler K, Ueberall F, Culig Z, Bartsch G, Klocker H. Identification of genes involved in estrogenic action in the human prostate using microarray analysis. Genomics. 2004;83:34–44. doi: 10.1016/S0888-7543(03)00184-8. [DOI] [PubMed] [Google Scholar]
- Quackenbush J. Microarray data normalization and transformation. Nat Genet. 2002;32 Suppl:496–501. doi: 10.1038/ng1032. [DOI] [PubMed] [Google Scholar]
- Hoffmann R, Seidl T, Dugas M. Profound effect of normalization on detection of differentially expressed genes in oligonucleotide microarray data analysis. Genome Biol. 2002;3:RESEARCH0033. doi: 10.1186/gb-2002-3-7-research0033. [DOI] [PMC free article] [PubMed] [Google Scholar]
- Cherian MG, Jayasurya A, Bay BH. Metallothioneins in human tumors and potential roles in carcinogenesis. Mutat Res. 2003;533:201–209. doi: 10.1016/j.mrfmmm.2003.07.013. [DOI] [PubMed] [Google Scholar]
- Saad RS, Liu YL, Nathan G, Celebrezze J, Medich D, Silverman JF. Endoglin (CD105) and vascular endothelial growth factor as prognostic markers in colorectal cancer. Mod Pathol. 2004;17:197–203. doi: 10.1038/modpathol.3800034. [DOI] [PubMed] [Google Scholar]
- Haga K. [The mechanism for reduced expression of gelsolin, tumor suppressor protein, in bladder cancer] Hokkaido Igaku Zasshi. 2003;78:29–37. [PubMed] [Google Scholar]
- Campa MJ, Wang MZ, Howard B, Fitzgerald MC, Patz E. F., Jr. Protein expression profiling identifies macrophage migration inhibitory factor and cyclophilin a as potential molecular targets in non-small cell lung cancer. Cancer Res. 2003;63:1652–1656. [PubMed] [Google Scholar]
- Chow ML, Moler EJ, Mian IS. Identifying marker genes in transcription profiling data using a mixture of feature relevance experts. Physiol Genomics. 2001;5:99–111. doi: 10.1152/physiolgenomics.2001.5.2.99. [DOI] [PubMed] [Google Scholar]
- Nagase T, Ishikawa K, Miyajima N, Tanaka A, Kotani H, Nomura N, Ohara O. Prediction of the coding sequences of unidentified human genes. IX. The complete sequences of 100 new cDNA clones from brain which can code for large proteins in vitro. DNA Res. 1998;5:31–39. doi: 10.1093/dnares/5.1.31. [DOI] [PubMed] [Google Scholar]
- Ghigna C, Moroni M, Porta C, Riva S, Biamonti G. Altered expression of heterogenous nuclear ribonucleoproteins and SR factors in human colon adenocarcinomas. Cancer Res. 1998;58:5818–5824. [PubMed] [Google Scholar]
- Chaurand P, DaGue BB, Pearsall RS, Threadgill DW, Caprioli RM. Profiling proteins from azoxymethane-induced colon tumors at the molecular level by matrix-assisted laser desorption/ionization mass spectrometry. Proteomics. 2001;1:1320–1326. doi: 10.1002/1615-9861(200110)1:10<1320::AID-PROT1320>3.3.CO;2-7. [DOI] [PubMed] [Google Scholar]
- Nicholson KM, Anderson NG. The protein kinase B/Akt signalling pathway in human malignancy. Cell Signal. 2002;14:381–395. doi: 10.1016/S0898-6568(01)00271-6. [DOI] [PubMed] [Google Scholar]
- Cheong HK, Park JY, Kim EH, Lee C, Kim S, Kim Y, Choi BS, Cheong C. Structure of the N-terminal extension of human aspartyl-tRNA synthetase: implications for its biological function. Int J Biochem Cell Biol. 2003;35:1548–1557. doi: 10.1016/S1357-2725(03)00070-0. [DOI] [PubMed] [Google Scholar]
- DeFatta RJ, Chervenak RP, De Benedetti A. A cancer gene therapy approach through translational control of a suicide gene. Cancer Gene Ther. 2002;9:505–512. doi: 10.1038/sj.cgt.7700469. [DOI] [PubMed] [Google Scholar]
- Derenzini M, Trere D, Pession A, Montanaro L, Sirri V, Ochs RL. Nucleolar function and size in cancer cells. Am J Pathol. 1998;152:1291–1297. [PMC free article] [PubMed] [Google Scholar]
- Eray M, Tuomikoski T, Wu H, Nordstrom T, Andersson LC, Knuutila S, Kaartinen M. Cross-linking of surface IgG induces apoptosis in a bcl-2 expressing human follicular lymphoma line of mature B cell phenotype. Int Immunol. 1994;6:1817–1827. doi: 10.1093/intimm/6.12.1817. [DOI] [PubMed] [Google Scholar]
- Sreedharan SP, Huang JX, Cheung MC, Goetzl EJ. Structure, expression, and chromosomal localization of the type I human vasoactive intestinal peptide receptor gene. Proc Natl Acad Sci U S A. 1995;92:2939–2943. doi: 10.1073/pnas.92.7.2939. [DOI] [PMC free article] [PubMed] [Google Scholar]
- Shailubhai K, Yu HH, Karunanandaa K, Wang JY, Eber S. L, Wang Y, Joo NS, Kim HD, Miedema BW, Abbas SZ, Boddupalli SS, Currie MG, Forte LR. Uroguanylin treatment suppresses polyp formation in the Apc(Min/+) mouse and induces apoptosis in human colon adenocarcinoma cells via cyclic GMP. Cancer Res. 2000;60:5151–5157. [PubMed] [Google Scholar]
- Gali H, Sieckman GL, Hoffman TJ, Kiefer GE, Chin DT, Forte LR, Volkert WA. Synthesis and in vitro evaluation of an 111In-labeled ST-peptide enterotoxin (ST) analogue for specific targeting of guanylin receptors on human colonic cancers. Anticancer Res. 2001;21:2785–2792. [PubMed] [Google Scholar]
- Adhami VM, Ahmad N, Mukhtar H. Molecular targets for green tea in prostate cancer prevention. J Nutr. 2003;133:2417S–2424S. doi: 10.1093/jn/133.7.2417S. [DOI] [PubMed] [Google Scholar]
- Melendez JA, Davies KJ. Manganese superoxide dismutase modulates interleukin-1alpha levels in HT-1080 fibrosarcoma cells. J Biol Chem. 1996;271:18898–18903. doi: 10.1074/jbc.271.31.18898. [DOI] [PubMed] [Google Scholar]
- Costantino L, Ferrari AM, Gamberini MC, Rastelli G. Nitrophenyl derivatives as aldose reductase inhibitors. Bioorg Med Chem. 2002;10:3923–3931. doi: 10.1016/S0968-0896(02)00318-8. [DOI] [PubMed] [Google Scholar]
- Nithipatikom K, Isbell MA, Lindholm PF, Kajdacsy-Balla A, Kaul S, Campell WB. Requirement of cyclooxygenase-2 expression and prostaglandins for human prostate cancer cell invasion. Clin Exp Metastasis. 2002;19:593–601. doi: 10.1023/A:1020915914376. [DOI] [PubMed] [Google Scholar]
- Zhang JP, Ying K, Xiao ZY, Zhou B, Huang QS, Wu HM, Yin M, Xie Y, Mao YM, Rui YC. Analysis of gene expression profiles in human HL-60 cell exposed to cantharidin using cDNA microarray. Int J Cancer. 2004;108:212–218. doi: 10.1002/ijc.11405. [DOI] [PubMed] [Google Scholar]
- Ricci G, Caccuri AM, Lo Bello M, Parker MW, Nuccetelli M, Turella P, Stella L, Di Iorio EE, Federici G. Glutathione transferase P1-1: self-preservation of an anti-cancer enzyme. Biochem J. 2003;376:71–76. doi: 10.1042/BJ20030860. [DOI] [PMC free article] [PubMed] [Google Scholar]
- Eder IE, Haag P, Basik M, Mousses S, Bektic J, Bartsch G, Klocker H. Gene expression changes following androgen receptor elimination in LNCaP prostate cancer cells. Mol Carcinog. 2003;37:181–191. doi: 10.1002/mc.10136. [DOI] [PubMed] [Google Scholar]
- Stahl JA, Leone A, Rosengard AM, Porter L, King CR, Steeg PS. Identification of a second human nm23 gene, nm23-H2. Cancer Res. 1991;51:445–449. [PubMed] [Google Scholar]
- Carollo M, Parente L, D'Alessandro N. Dexamethasone-induced cytotoxic activity and drug resistance effects in androgen-independent prostate tumor PC-3 cells are mediated by lipocortin 1. Oncol Res. 1998;10:245–254. [PubMed] [Google Scholar]
- Matsui H, Kubochi K, Okazaki I, Yoshino K, Ishibiki K, Kitajima M. Collagen biosynthesis in gastric cancer: immunohistochemical analysis of prolyl 4-hydroxylase. J Surg Oncol. 1999;70:239–246. doi: 10.1002/(SICI)1096-9098(199904)70:4<239::AID-JSO8>3.3.CO;2-D. [DOI] [PubMed] [Google Scholar]
- Chesi M, Bergsagel PL, Shonukan OO, Martelli ML, Brents LA, Chen T, Schrock E, Ried T, Kuehl WM. Frequent dysregulation of the c-maf proto-oncogene at 16q23 by translocation to an Ig locus in multiple myeloma. Blood. 1998;91:4457–4463. [PubMed] [Google Scholar]
- Postel EH, Berberich SJ, Flint SJ, Ferrone CA. Human c-myc transcription factor PuF identified as nm23-H2 nucleoside diphosphate kinase, a candidate suppressor of tumor metastasis. Science. 1993;261:478–480. doi: 10.1126/science.8392752. [DOI] [PubMed] [Google Scholar]
- Huang KS, Wallner BP, Mattaliano RJ, Tizard R, Burne C, Frey A, Hession C, McGray P, Sinclair LK, Chow EP. Two human 35 kd inhibitors of phospholipase A2 are related to substrates of pp60v-src and of the epidermal growth factor receptor/kinase. Cell. 1986;46:191–199. doi: 10.1016/0092-8674(86)90736-1. [DOI] [PubMed] [Google Scholar]