

Abstract
Objectives
To evaluate the association between longitudinal continuity of primary care and use of emergency department (ED) and inpatient care in older veterans.
Design
Retrospective cohort study.
Setting
Department of Veterans Affairs (VA) primary care clinics in 15 regional health networks, ED and inpatient facilities.
Participants
Medicare‐eligible veterans aged 65 and older with three or more VA primary care visits during fiscal year 2007–08 (baseline period) (N = 243,881).
Measurements
Two measures of longitudinal continuity were estimated using merged VA–Centers for Medicare and Medicaid Services administrative data: Usual Provider of Continuity (UPC) and Modified Modified Continuity Index (MMCI). Negative binomial and multivariable logistic regression models were used to predict ED use and inpatient hospitalization during fiscal year 2009, controlling for sociodemographic characteristics, medical and psychiatric comorbidity, and baseline use of health services.
Results
The incidence rate ratio (IRR) of ED visits was greater in patients with high (IRR = 1.05, 95% confidence interval (CI) = 1.02–1.07), intermediate (IRR = 1.04, 95% CI = 1.02–1.07), and low (IRR = 1.06, 95% CI = 1.03–1.09) UPC than in those with very high UPC (0.9–1.0). Patients with high (odds ratio (OR) = 1.04, 95% CI = 1.01–1.07), intermediate (OR = 1.03, 95% CI = 1.00–1.06), and low (OR = 1.04, 95% CI = 1.01–1.07) UPC were also more likely to be hospitalized during follow‐up. Results were similar for MMCI continuity scores.
Conclusion
Even slightly lower primary care provider (PCP) continuity was associated with modestly greater ED use and inpatient hospitalization in older veterans. Additional efforts should be made to schedule older adults with their assigned PCP whenever possible.
Keywords: continuity of care, primary care, emergency medical services, hospitalization, elderly
Longitudinal continuity describes the extent to which an individual receives primary care from the same place and from the same provider, and is one of the core attributes of primary care.1 Continuity of primary care promotes providers' knowledge of patients' health and psychosocial histories, improves recognition of new problems, and improves patient‐provider communication.1, 2 There is also evidence that continuity of care improves medication adherence,3 delivery of preventive care,4 and mortality.5 Continuity of care may be particularly important for older adults, who are among the most frequent users of care in hospital emergency departments (EDs)6 and have relatively high rates of preventable hospitalizations.7 Alternatively, individuals with very high continuity may delay seeking care for an urgent condition to see their primary care provider (PCP) and may not receive the full range of services that other clinicians (with skills that may complement those of their PCP) can deliver.8
In the early 1990s, the Department of Veterans Affairs (VA) recognized the need for a robust system of primary care and the importance of continuity with an identifiable primary care provider.9 Over the past 15 years, VA began to provide access to a broad range of support services (including home‐based primary care, home telehealth, and homemaker services) that help families care for family members at home.10, 11 In 2010, VA launched the Patient Aligned Care Team (PACT) initiative, which is based on the patient‐centered medical home model and aims to provide continuous, comprehensive, and coordinated care to veterans while improving access to first‐contact care.12, 13 Nevertheless, several countervailing forces in primary care reduce the likelihood of individuals seeing the same PCP at repeated visits: growing demand for same‐day access and the advent of open access scheduling, greater use of dual sources of primary care, more providers working part time, and frequent changes in insurance coverage.2, 14 Moreover, recent legislation to decrease wait times for VA primary care services (e.g., by arranging for veterans to use non‐VA services)15 may add to the problems of discontinuity and care fragmentation.
Prior studies suggest that veteran outpatients with less longitudinal continuity are significantly more likely to visit the ED and to require inpatient admission during follow‐up,5, 16, 17, 18 but these studies did not account for use of acute care at non‐VA facilities, were limited to single sites, or used unclear definitions of continuity. The primary aim of this study was to quantify the association between longitudinal continuity of primary care with the assigned PCP and ED visits and hospitalization of older VA outpatients across multiple regions of the United States just before PACT implementation (using data from VA and non‐VA sources to more‐accurately characterize use of ED and inpatient care). These results can be used to inform clinicians, healthcare managers, and policymakers of the potential effect of system interventions to improve continuity of primary care within an integrated healthcare system.
Methods
To determine the temporal association between continuity and use of the ED and inpatient care in older veterans, a retrospective cohort study with prospective follow‐up was conducted using VA administrative data to capture use of VA services and merged VA–Centers for Medicare and Medicaid Services (CMS) data to capture use of non‐VA services. Specifically, the continuity of primary care was ascertained in the VA study cohort during a 2‐year baseline period (FY2007–08), and the use of acute care services was assessed during a subsequent third year (follow‐up period, FY2009). The advantage of a longer baseline period is that it increases the number of primary care encounters and yields more covariate information.19 The Iowa City VA Health Care System institutional review board approved this project.
Inclusion and Exclusion Criteria
In the primary analysis, we included all VA beneficiaries with a Patient Care Management Module–assigned PCP who had at least three VA primary care visits with a physician or physician extender in VA primary care during the baseline period (FY2007–08). The study cohort was restricted to individuals aged 65 and older for three reasons: older adults tend to value continuity with their PCP more highly than younger individuals20, 21 and may be particularly vulnerable to discontinuity of care; adults aged 65 and older are known to face greater risk of adverse events (including repeat ED visits and hospitalization);22 and this group is Medicare‐eligible, allowing non‐VA care to be captured through Medicare claims data. Having at least three VA primary care visits during the baseline period was required, because a sufficient number of visits is required to obtain stable estimates of continuity.23, 24 In addition, this pattern identifies active users of VA primary care, not only those who receive annual examinations (which is required for veterans to claim their VA pharmacy benefit). In the primary analysis, individuals enrolled in Medicare managed care plans (because detailed encounter data are generally missing from the claims data for these individuals), individuals with end‐stage renal disease, those who had VA and non‐VA primary care visits during the baseline period, and those who died before the end of FY2009 were excluded. Individuals who had VA and non‐VA primary care visits during the 2‐year baseline period were also excluded because it is often difficult to accurately identify the lead PCP (VA or non‐VA) for these dual users from administrative records; in addition, the primary focus of this study was the association between continuity with the VA PCP and use of ED and inpatient services. This study was limited to 15 Veterans Integrated Service Networks (VISNs), which capture approximately 69% of U.S. veterans enrolled in VA primary care; merged VA‐CMS data from the remaining six VISNs were not available at the time of this analysis. Analysis of VA data shows that individuals in primary care in the 15‐VISN sample were more likely to be white (85% vs 71%) and had a lower mean Gagne comorbidity score (0.10 vs 0.39)25 than those in the remaining six VISNs.
Assessment of PCP Continuity
In the primary analysis, data from the FY2007 Patient Care Management Module were used to identify the patient's assigned VA PCP at the start of follow‐up and were linked to VA outpatient (Outpatient Care File (OPC)) and inpatient (Patient Treatment File (PTF)) datasets. Clinic stop codes were used to identify primary care visits. Telephone contacts, home‐based contacts, and contacts with non‐PCPs were excluded in calculating continuity.
Two measures of longitudinal continuity were calculated using administrative data (Usual Provider of Continuity (UPC)26 and Modified Modified Continuity Index (MMCI)27), because both measures are used to track primary care service delivery during the PACT initiative. UPC measures the density of visits with a particular provider; in this study, UPC reflects the proportion of primary care visits with the designated VA PCP. MMCI measures visit dispersion across different primary care providers and accounts for both the number of different providers seen and the total number of visits during the baseline period (with a “penalty” for more providers seen).28
UPC and MMCI values were calculated for each eligible individual in primary care (on a scale of 0–1, where 1 is perfect continuity) based on the pattern of primary care visits during the 2‐year baseline period. In the analysis, continuity was calculated based on visits with the assigned PCP (even if the individual had also seen a resident physician). Values were grouped into four categories (0.90–1.0, very high; 0.75–0.89, high; 0.50–0.74, intermediate; <0.50, poor); these categories are similar to those used in a previous study29 except that the top category was divided into two groups (0.90–1.0 and 0.75–0.89) in the current study. Recent VA continuity data are skewed toward higher values (≥0.80),13 and this analysis was designed to determine the potential effects of small decrements in PCP continuity.
Assessment of ED Visits and Hospitalizations
In the VA administrative data, the OPC and PTF files were used to identify ED visits and inpatient admissions to VA facilities; outpatient Standard Analytical Files and Medicare Provider Analysis and Review Part A Files were used to identify ED visits and hospitalizations, respectively, at non‐VA facilities. ED visits at VA facilities were identified by stop code 130; place of service (23) was used to identify non‐VA ED visits (http://www.resdac.org/resconnect/articles/144). Based on primary admission diagnoses (defined according to International Classification of Diseases, Ninth Revision, Clinical Modification, codes), the subset of ED visits and hospitalizations that were attributable to ambulatory care–sensitive conditions (ACSCs) was also identified. This includes uncontrolled diabetes mellitus or diabetic complications, chronic obstructive pulmonary disease, hypertension, congestive heart failure, angina pectoris, asthma, lower extremity amputation, bacterial pneumonia, urinary tract infection, dehydration, and perforated appendix.30
Statistical Analysis
The primary aim of this analysis was to determine the magnitude of association between continuity with the individual's VA‐assigned PCP and occurrence of any ED visits, any ACSC‐related ED visits, any hospitalizations, and any ACSC‐related hospitalizations during follow‐up. The relationship between continuity and number of ED visits was also evaluated. Using baseline data at the inception of follow‐up, individual characteristics that could confound acute care outcomes across levels of continuity were compared using analysis of variance, Kruskal‐Wallis rank test, or chi‐square tests as appropriate for the type of data. Patient characteristics were age, sex, race, marital status, distance between participant's home and nearest VA acute care hospital,17 VA income category, service‐connected disability, Medicare enrollment, total number of primary care and specialty care outpatient visits during the baseline period (0–8, 9–12, 3–19, 20–30, ≥32), any prior ED visits, and any prior hospitalization. Using data from FY2007–08, a modified medical comorbidity score was calculated,25 and a separate covariate was included to indicate the presence of any of five psychiatric conditions (depression, bipolar disorder, anxiety disorders, posttraumatic stress disorder, psychotic disorders).31
The occurrence of any ED visits and any hospitalizations was modeled using generalized estimating equations with logistic regression, accounting for clustering according to the assigned VA PCP and usual site of VA primary care. Because of concerns regarding collinearity between continuity of care and number of outpatient clinic visits,17, 24, 29 the analysis was stratified according to the total number of outpatient visits to all clinics during the 2‐year baseline period (<9, 9–19, ≥20, based on distribution of the data). Number of outpatient visits is a marker of health‐seeking behavior and presence of complex chronic disease, and it has been associated with ACSC‐related hospitalization.32 Negative binomial regression models were used to evaluate the association between PCP continuity and number of ED visits during follow‐up.
Selected subgroup analyses were also performed to evaluate a priori hypotheses. Specifically, the interaction between distance from the nearest VA Medical Center (VAMC) and continuity was analyzed. Medicare beneficiaries residing in rural regions have been shown to have significantly higher rates of ACSC‐related hospitalization than urban residents.33 Thus, it was hypothesized that the association between PCP continuity and use of ED and inpatient care for ACSCs would be stronger in veterans who lived further from the nearest VA hospital. Whether there is a stronger association between continuity and hospitalization in patients with multiple comorbidities (≥3 chronic medical conditions) was also assessed. Prior research suggests that individuals with more chronic medical comorbidities value continuity more.20, 34
All analyses were performed using SAS for Windows version 9.3 (SAS Institute, Inc., Cary, NC). All tests were two‐sided, and P ≤ .05 was defined as statistically significant.
Results
Derivation of the study cohort is shown in Figure 1. For the 243,881 Medicare‐eligible VA outpatients aged 65 and older assigned to a VA primary care provider (PCP) in 2007, median UPC (0.80, interquartile range (IQR) 0.50–1.0) and MMCI (0.80, IQR 0.52–1.0) scores were similar. The median duration of care with the assigned PCP was 3.1 years (IQR 1.8–5.1 years). Patients with very high UPC scores were significantly less likely than those with low UPC scores to have visited the ED or been hospitalized during the baseline period, more likely to be married, and less likely to have a history of depressive disorders (Table 1).
Figure 1.
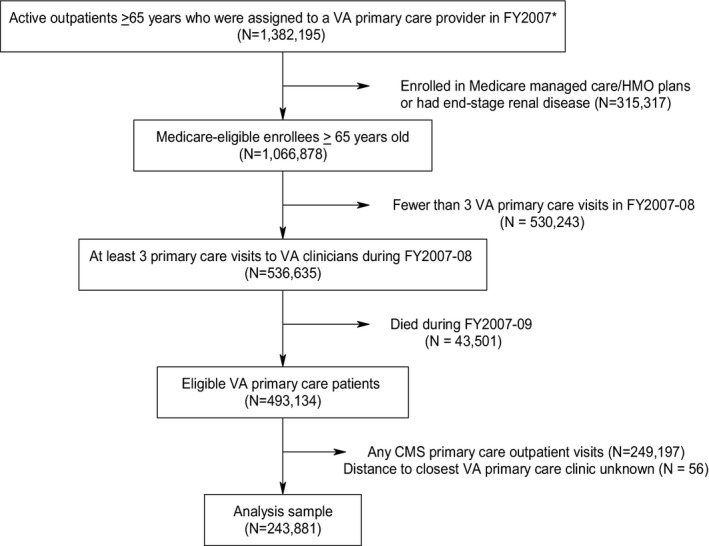
Derivation of analysis sample. *This analysis was limited to veterans who had at least one Veterans Affairs (VA) outpatient visit during fiscal year 2007–08 in one of 15 Veterans Integrated Service Networks (1, 2, 4, 6, 7, 9, 11, 15, 16, 17, 18, 19, 20, 22, 23). HMO = health maintenance organization; FY = fiscal year.
Table 1.
Patient Characteristics According to Category of Usual Provider Continuity
| Characteristic | Very High, n = 99,652 | High, n = 39,202 | Intermediate, n = 50,696 | Low, n = 54,331 |
|---|---|---|---|---|
| Age, mean ± SD | 74.0 (6.4) | 74.1 (6.5) | 74.0 (6.4) | 73.8 (6.4) |
| Male, % | 98 | 97 | 97 | 97 |
| Married, % | 60 | 58 | 59 | 56 |
| White, % | 65 | 68 | 69 | 70 |
| Income, median (IQR) | 15,773 (24,265) | 15,600 (22,776) | 15,490 (23,136) | 15,000 (22,752) |
| ≥50% disability status | 13 | 17 | 16 | 15 |
| Distance between participant's home and nearest VA acute care hospital, miles, mean ± SD | 27.4 ± 47.8 | 23.4 ± 44.7 | 26.0 ± 46.4 | 27.8 ± 49.4 |
| Number of primary care visits during baseline period, median (IQR) | 4.0 (2.0) | 5.0 (3.1) | 5.0 (4.0) | 5.0 (4.0) |
| Any emergency department visit during baseline period, % | 38 | 47 | 45 | 45 |
| Any hospitalization during baseline period, % | 27 | 35 | 33 | 34 |
| Enrolled in Medicare, % | 96 | 97 | 96 | 94 |
| Comorbid medical conditions, %a | ||||
| Congestive heart failure | 5 | 5 | 5 | 6 |
| Peripheral vascular disease | 1 | 1 | 1 | 1 |
| Cardiac arrhythmia | 12 | 14 | 14 | 14 |
| Valvular heart disease | 5 | 6 | 6 | 6 |
| Cerebrovascular disease | 14 | 16 | 16 | 16 |
| Pulmonary disease | 4 | 4 | 4 | 4 |
| Hypertension | 41 | 39 | 40 | 40 |
| Diabetes mellitus (overall) | 34 | 37 | 35 | 35 |
| Diabetes mellitus with complications | 11 | 13 | 12 | 13 |
| Fluid and electrolyte disorder | 2 | 2 | 2 | 2 |
| Anemia | 7 | 9 | 8 | 8 |
| Rheumatoid arthritis | 1 | 1 | 1 | 1 |
| Any tumor | 3 | 2 | 2 | 2 |
| Comorbid psychiatric conditions, %b | ||||
| Depressive disorder | 13 | 16 | 16 | 17 |
| Anxiety disorder | 7 | 8 | 8 | 8 |
| Bipolar disorder | 1 | 1 | 1 | 1 |
| Posttraumatic stress disorder | 4 | 6 | 5 | 5 |
| Psychotic disorder | <1 | <1 | <1 | <1 |
A partial listing of common comorbid medical conditions is shown.
Based on previously published criteria.31
IQR = interquartile range; ED = emergency department.
During follow‐up, 36% of patients in the study cohort visited any ED (814 visits/1,000 patients), and 22% were hospitalized (443 admissions/1,000 patients). Approximately 30% of patients who visited the ED were treated for an ACSC, and 17% of hospitalized patients were admitted for treatment of an ACSC. In bivariate analyses, patients with very high UPC scores were less likely to visit the ED (33.5% vs 38.0%, P < .001) or to require hospitalization (18.6% vs 22.1%, P < .001) during follow‐up than those with low UPC scores. Figure 2 shows these relationships across the full range of UPC scores.
Figure 2.
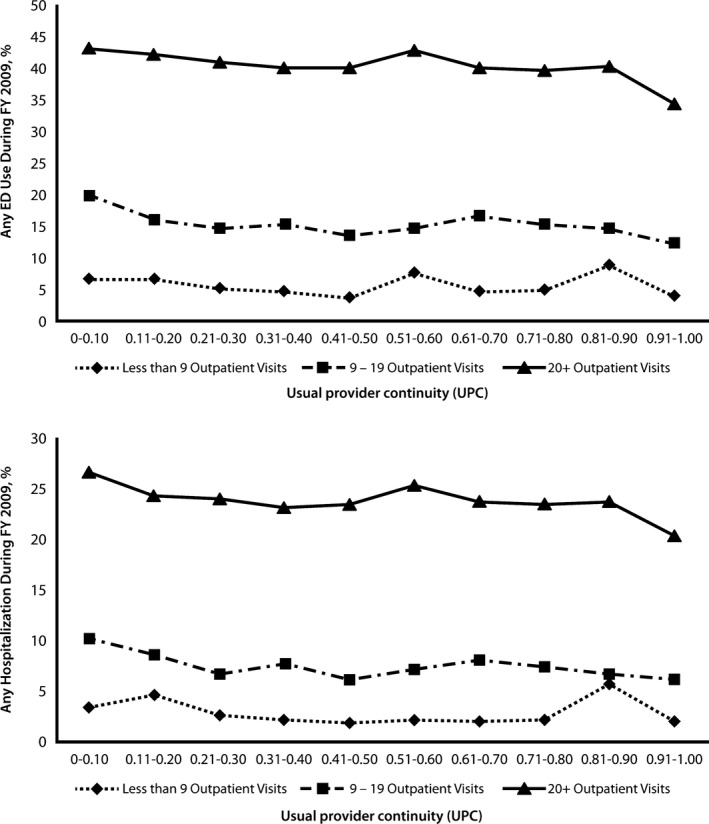
Usual provider continuity (UPC) and use of acute care services during follow‐up. Unadjusted results for any emergency department use (top) and any hospitalization (bottom) are shown. UPC refers to the proportion of primary care visits with the designated Veterans Affairs (VA) primary care provider (PCP). Patients with perfect PCP continuity (UPC = 1.0) always see their assigned VA provider in clinic.
After multivariable adjustment for potential confounding variables (including number of outpatient visits), the likelihood of any ED visits was significantly higher in patients with high (odds ratio (OR) = 1.05, 95% confidence interval (CI) = 1.02–1.08), intermediate (OR = 1.05, 95% CI = 1.02–1.08), and low (OR = 1.04, 95% CI = 1.01–1.08) UPC scores than in those with very high PCP continuity. Negative binomial regression models also showed that the incidence rate of ED visits was significantly greater in patients with high (incidence rate ratio (IRR) = 1.05, 95% CI = 1.03–1.08), intermediate (IRR = 1.04, 95% CI = 1.02–1.07), and low (IRR = 1.06, 95% CI = 1.03–1.09) UPC scores than in those with near‐perfect continuity. Patients with high (OR = 1.04, 95% CI = 1.01–1.07), intermediate (OR = 1.03, 95% CI = 1.00–1.06), and low (OR = 1.04, 95% CI = 1.01–1.07) UPC scores were also more likely to be hospitalized during follow‐up. Results were similar when the analysis was restricted to ACSC‐related ED visits and hospitalizations and when MMCI scores were used to model PCP continuity.
Stratified analyses (Table 2) showed that lower continuity was associated with greater likelihood of ED visits only for patients with more‐frequent outpatient clinic visits during the baseline period (≥9). Patients with the most‐frequent outpatient visits (≥20) consistently had a higher likelihood of hospitalization during follow‐up (Table 3). The strength of association between continuity and hospitalization was greater when the analysis was limited to ACSC‐related hospitalizations, but no clear dose‐response relationship was observed in any of these analyses.
Table 2.
Association Between Primary Care Provider Continuity and Use of the Emergency Department (ED)
| Continuity Measure (Reference Very High, 0.90–1.00) | ED Visit | ACSC‐Related ED Visit | ||||
|---|---|---|---|---|---|---|
| <9 Outpatient Visits, n = 20,130 | 9–19 Outpatient Visits, n = 85,070 | ≥20 Outpatient Visits, n = 138,681 | <9 Outpatient Visits, n = 20,130a | 9–19 Outpatient Visits, n = 85,070 | ≥20 Outpatient Visits, n = 138,681 | |
| Adjusted Odds Ratio (95% Confidence Interval) | ||||||
| Usual provider continuity | ||||||
| High (0.75–0.90) | 0.97 (0.84–1.12) | 1.08 (1.03–1.13) | 1.06 (1.03–1.10) | — | 1.17 (1.08–1.27) | 1.10 (1.05–1.14) |
| Intermediate (0.50–0.74) | 1.05 (0.95–1.16) | 1.07 (1.02–1.11) | 1.06 (1.02–1.10) | — | 1.09 (1.01–1.17) | 1.07 (1.02–1.11) |
| Low (<0.50) | 1.00 (0.90–1.11) | 1.04 (0.99–1.09) | 1.07 (1.03–1.11) | — | 1.10 (1.02–1.18) | 1.01 (0.96–1.06) |
| Modified modified continuity index | ||||||
| High (0.75–0.90) | 1.07 (0.87–1.33) | 1.09 (1.04–1.15) | 1.09 (1.06–1.13) | — | 1.20 (1.10–1.31) | 1.06 (1.02–1.11) |
| Intermediate (0.50–0.74) | 1.05 (0.96–1.14) | 1.06 (1.02–1.10) | 1.07 (1.04–1.11) | — | 1.12 (1.05–1.19) | 1.05 (1.01–1.10) |
| Low (<0.50) | 0.99 (0.87–1.12) | 1.06 (1.00–1.11) | 1.05 (1.00–1.09) | — | 1.06 (0.97–1.16) | 1.05 (1.00–1.10) |
All models were adjusted for age, sex, race, marital status, distance from home to nearest Veterans Affairs (VA) hospital, VA income category, service‐connected disability, Medicare enrollment, number of medical conditions, any psychiatric comorbidity, and history of ED visits during the baseline period.
Models did not converge because of the small number of ED visits for ambulatory care–sensitive conditions (ACSCs) in this subgroup.
Table 3.
Association Between Primary Care Provider Continuity and Hospitalization
| Continuity Measure (Reference Very High, 0.90–1.00) | Hospitalization | ACSC‐Related Hospitalization | ||||
|---|---|---|---|---|---|---|
| <9 Outpatient Visits, n = 20,130 | 9–19 Outpatient Visits, n = 85,070 | ≥20 Outpatient Visits, n = 138,681 | <9 Outpatient Visits, n = 20,130a | 9–19 Outpatient Visits, n = 85,070 | ≥20 Outpatient Visits, n = 138,681 | |
| Adjusted Odds Ratio (95% Confidence Interval) | ||||||
| Usual provider continuity | ||||||
| High (0.75–0.90) | 1.00 (0.83–1.20) | 1.06 (1.00–1.13) | 1.06 (1.03–1.10) | — | 1.28 (1.10–1.49) | 1.12 (1.04–1.20) |
| Intermediate (0.50–0.74) | 0.99 (0.88–1.12) | 1.01 (0.96–1.06) | 1.07 (1.03–1.11) | — | 1.16 (1.00–1.33) | 1.10 (1.03–1.18) |
| Low (<0.50) | 0.95 (0.84–1.08) | 1.03 (0.98–1.08) | 1.08 (1.04–1.12) | — | 1.17 (1.02–1.35) | 1.23 (1.15–1.32) |
| Modified modified continuity index | ||||||
| High (0.75–0.90) | 1.20 (0.94–1.54) | 1.04 (0.98–1.11) | 1.05 (1.02–1.09) | — | 1.30 (1.11–1.53) | 1.16 (1.09–1.25) |
| Intermediate (0.50–0.74) | 0.94 (0.84–1.05) | 1.03 (0.99–1.08) | 1.06 (1.03–1.09) | — | 1.22 (1.08–1.37) | 1.15 (1.08–1.23) |
| Low (<0.50) | 0.96 (0.83–1.12) | 1.02 (0.96–1.08) | 1.06 (1.02–1.10) | — | 1.16 (0.98–1.38) | 1.20 (1.11–1.30) |
All models were adjusted for age, sex, race, marital status, distance from home to nearest Veterans Affairs (VA) hospital, VA income category, service‐connected disability, Medicare enrollment, number of medical conditions, any psychiatric comorbidity, and history of prior hospitalization during the baseline period.
Models did not converge because of the small number of hospitalizations for ambulatory care–sensitive conditions in this subgroup.
In prespecified subgroup analyses, there was no significant interaction between PCP continuity and presence of multiple (≥3) medical comorbidities, although a significant interaction was found between PCP continuity and geographic access to the nearest VA hospital for ACSC‐related hospitalizations (Table 4). The strongest association was observed for patients who lived more than 50 miles from the nearest VAMC: high (OR = 1.19, 95% CI = 1.01–1.40), intermediate (OR = 1.22, 95% CI = 1.05–1.42), and low (OR = 1.37, 95% CI = 1.18–1.60) UPC scores were associated with significantly greater risk of hospitalization. No consistent association between PCP continuity and ACSC‐related hospitalization was observed for patients who lived less than 10 miles from the nearest VAMC, and no consistent association was found between PCP continuity and ACSC‐related ED visits for any distance subgroup.
Table 4.
Association Between Primary Care Provider Continuity and Emergency Department (ED) Visits and Hospitalizations for Ambulatory Care–Sensitive Conditions (ACSCs), Stratified According to Patient's Distance to Nearest Veterans Affairs Medical Center
| Continuity Measure (Reference Very High, 0.90–1.0) | ACSC‐Related ED Visit | ACSC‐Related Hospitalization | ||||
|---|---|---|---|---|---|---|
| 0–10 Miles | 11–50 Miles | >50 Miles | 0–10 Miles | 11–50 Miles | >50 Miles | |
| Adjusted Odds Ratio (95% Confidence Interval) | ||||||
| Usual provider continuity | ||||||
| <0.50 | 1.05 (0.99–1.12) | 1.02 (0.96–1.08) | 1.04 (0.97–1.11) | 1.12 (1.02–1.23)a | 1.17 (1.06–1.28)a | 1.37 (1.18–1.60)a |
| 0.50–0.74 | 1.03 (0.96–1.10) | 1.07 (1.01–1.13)a | 1.02 (0.95–1.10) | 0.97 (0.88–1.07) | 1.12 (1.02–1.22)a | 1.22 (1.05–1.42)a |
| 0.75–0.90 | 1.06 (0.99–1.13) | 1.09 (1.03–1.15)a | 1.03 (0.95–1.12) | 1.10 (1.00–1.21) | 1.10 (1.00–1.22)a | 1.19 (1.01–1.40)a |
| Modified Modified Continuity Index | ||||||
| <0.50 | 0.99 (0.91–1.07) | 1.04 (0.98–1.11) | 0.99 (0.91–1.08) | 1.08 (0.97–1.21) | 1.17 (1.04–1.30)a | 1.39 (1.17–1.65)a |
| 0.50–0.74 | 1.04 (0.98–1.11) | 1.09 (1.04–1.15)a | 1.03 (0.97–1.10) | 1.01 (0.93–1.11) | 1.19 (1.10–1.30)a | 1.23 (1.07–1.41)a |
| 0.75–0.90 | 1.09 (1.02–1.16)a | 1.10 (1.04–1.17)a | 1.06 (0.97–1.15) | 1.12 (1.02–1.23)a | 1.11 (1.01–1.22)a | 1.25 (1.07–1.46)a |
All models were adjusted for age, sex, race, marital status, Veterans Affairs income category, service‐connected disability, Medicare enrollment, medical comorbidity (modified Gagne score), any psychiatric comorbidity, number of outpatient visits, history of any ED visits (ED models), and history of any hospitalizations during the baseline period.
P ≤ .05.
Discussion
In this study, even slightly lower PCP continuity was associated with greater risk of ED visits and hospitalizations in elderly veterans, after controlling for sociodemographic characteristics, medical and psychiatric comorbidity, and prior ED and inpatient services use. However, after accounting for how often patients were seen in clinic, lower PCP continuity was associated with greater use of ED and inpatient care only in patients with frequent outpatient visits. Other investigators have also demonstrated the importance of PCP continuity for patients with greater need for outpatient follow‐up.20, 35 Such high users of ambulatory care tend to be older, divorced or widowed, socioeconomically disadvantaged, anxious, and depressed and to present with medically unexplained symptoms or psychosocial problems.36 The results of the current study were similar for concentration and dispersion‐based measures of continuity. Many older adults develop ongoing relationships with their PCPs over time, characterized by personal trust, loyalty, and a sense of personal responsibility.37 PCP continuity facilitates better patient–provider communication, greater familiarity with the individual's history and personal preferences, and more‐effective management of chronic conditions.8
These findings on the relationship between PCP continuity and use of ED and inpatient services are qualitatively similar to those reported in other studies, but the strength of association is more modest (possibly because use of non‐VA care was accounted for). In a cross‐sectional study of individuals in a large VA primary care clinic (shortly after PACT implementation), individuals who had at least one visit with their assigned PCP had lower ED use than individuals who had not seen their PCP (adjusted OR = 0.54, 95% CI = 0.41–0.71).17 In a recent analysis of veterans receiving primary care across the entire VA healthcare system, older adults (≥65) with perfect PCP continuity (UPC = 1.0) had a significantly lower risk of hospitalization (OR = 0.76, 95% CI = 0.72–0.80) than those with low continuity (UPC<0.5).5 An analysis of fee‐for‐service Medicare enrollees (aged ≥65) with at least four ambulatory care visits demonstrated that a 0.1‐point increase in usual provider continuity was associated with a 2% reduction in the hazard of preventable hospitalization.7 Similarly, an analysis of Canadian older adults (aged ≥67) showed that those with high continuity of primary care (≥75% of primary care visits to the same family physician over a 2‐year period) were significantly less likely to be hospitalized for ACSCs than those with lower continuity (OR = 0.67, 95% CI = 0.51–0.90).38
Similar to the results of a previous study in veterans,5 the current study did not observe a clear dose‐response relationship between PCP continuity and use of ED and inpatient care. One possible explanation for this is that individuals with very high continuity with their assigned PCP are more engaged in their care and have fundamentally different patterns of health‐seeking behavior than those with lower PCP continuity. It was attempted to account for these differences by adjusting for differences in comorbid conditions and prior use of care across continuity‐of‐care groups. Another possible explanation is that the VA system of care coordination and computerized patient record system helped to attenuate the effect of PCP discontinuity, even in patients in the lowest category of continuity. Innovative services in VA, such as the use of home‐based primary care and home telehealth, have also been associated with lower risk of ED visits and hospitalizations in elderly veterans.10, 11
The results of the current study suggest that the association between continuity of primary care and hospitalization for ACSCs is magnified in veterans who live long distances from the nearest VAMC. Residents of rural areas may postpone healthcare visits until their symptoms are more severe and report lower visit rates to healthcare providers.39 Older adults who reside in rural areas often lack primary care services in their home communities, are less inclined to seek care because of cost and transportation challenges,40 and are more likely to use the ED.41 Although VA has reduced barriers for rural individuals through a nationwide network of community‐based outpatient clinics and robust mechanisms for telehealth and e‐health,42 PCP continuity remains especially important in this subgroup of veterans.
Limitations of this study deserve comment. First, causality between continuity of care and the use of ED and inpatient services cannot be assumed. Second, in calculating continuity of care, it was not possible to account for non‐face‐to‐face encounters (e.g., telephone visits), which were not consistently documented in the electronic medical record during the study period. Third, switching of the participant's assigned PCP during the 3‐year period of analysis, which would tend to underestimate continuity and bias the results toward the null, was not accounted for; few individuals in VA primary care switch their assigned PCP (~3% in FY2007). Fourth, exacerbations of comorbid conditions that may trigger more frequent visits could not be accounted for (residual confounding may be present). Fifth, unique stop codes for unscheduled urgent care visits were missing in the VA and CMS data. Sixth, this analysis was based on data from 15 VISNs, and the results cannot be generalized to all VA hospitals. Seventh, it was not possible to capture non‐VA ED use and hospitalizations by the small minority (<5%) of veterans in primary care who were not enrolled in Medicare. Finally, measures of longitudinal continuity based on administrative data may not be a good reflection of elderly adults' perception of the quality of the patient–provider relationship,43 but it has been previously shown that UPC and MMCI measures of continuity are associated with differences in the quality of patient–provider communication and the patient's satisfaction with care.29, 44
Implications
Although multiple factors (e.g., PCP availability, individual scheduling preferences, policy imperatives to improve access) constrain efforts to improve PCP continuity, these findings suggest that higher benchmarks for continuity (e.g., UPC ≥ 0.9) have the potential to reduce preventable (and costly) ED visits and hospitalizations. Future research should confirm whether PCP continuity is especially protective for certain at‐risk subgroups of veterans (e.g., high users, rural residents) and evaluate whether continuity with the individual's assigned care team is associated with similar reductions in the use of acute care as those seen for provider continuity. Adapting performance and feedback measures to reflect the work of the entire team would help to better align incentives with the goals of team‐based care.45 Further investigation to determine whether improvements in PCP continuity are associated with less use of acute care services in integrated non‐VA healthcare systems (e.g., Kaiser Permanente) and in newer models of coordinated care delivery such as accountable care organizations is also recommended.46 Finally, more work is needed to evaluate the effect of innovative practices for appointment booking47 and panel management on ED use and hospitalization.
Acknowledgments
Previously presented at the VA Health Services Research and Development National Meeting, National Harbor, Maryland, February 2011, and the Society of General Internal Medicine Annual Meeting, Phoenix, Arizona, May 2011.
The views expressed in this article are those of the authors and do not necessarily represent the views of VA.
This work could not have been done without the support of the VISN 23 PACT Demonstration Laboratory, which is funded by the VA Office of Patient Care Services.
Conflict of Interest: The editor in chief has reviewed the conflict of interest checklist provided by the authors and has determined that the authors have no financial or any other kind of personal conflicts with this paper.
Author Contributions: Katz: study concept and design, data analysis and interpretation, drafting the manuscript. McCoy: data acquisition, analysis, and interpretation; critical revision of manuscript. Vaughan‐Sarrazin: data analysis and interpretation, critical revision of manuscript.
Sponsor's Role: The sponsor had no role in the design, methods, data collections, analysis, or preparation of this paper.
J Am Geriatr Soc 63:2510–2518, 2015.
References
- 1. Starfield B. Primary Care: Concept, Evaluation, and Policy. New York: Oxford University Press, 1992. [Google Scholar]
- 2. Fan VS, Burman M, McDonell MB et al. Continuity of care and other determinants of patient satisfaction with primary care. J Gen Intern Med 2005;20:226–233. [DOI] [PMC free article] [PubMed] [Google Scholar]
- 3. Parchman ML, Pugh JA, Noël PH et al. Continuity of care, self‐management behaviors, and glucose control in patients with type 2 diabetes. Med Care 2002;40:137–144. [DOI] [PubMed] [Google Scholar]
- 4. Atlas SJ, Grant RW, Ferris TG et al. Patient‐physician connectedness and quality of primary care. Ann Intern Med 2009;150:325–335. [DOI] [PMC free article] [PubMed] [Google Scholar]
- 5. Nelson K, Sun H, Dolan E et al. Elements of the patient‐centered medical home associated with health outcomes among veterans: The role of primary care continuity, expanded access, and care coordination. J Ambul Care Manage 2014;37:331–338. [DOI] [PubMed] [Google Scholar]
- 6. McCaig LF, Burt CW. National Ambulatory Medical Care Survey: 2003 Emergency Department Survey. Hyattsville, MD: National Center for Health Statistics, 2005. [Google Scholar]
- 7. Nyweide DJ, Anthony DL, Bynum JP et al. Continuity of care and the risk of preventable hospitalization in older adults. JAMA Intern Med 2013;173:1879–1885. [DOI] [PMC free article] [PubMed] [Google Scholar]
- 8. Cabana MD, Jee SH. Does continuity of care improve patient outcomes? J Fam Pract 2004;53:974–980. [PubMed] [Google Scholar]
- 9. Yano EM, Simon BF, Lanto AB et al. The evolution of changes in primary care delivery underlying the Veterans Health Administration's quality transformation. Am J Public Health 2007;97:2151–2159. [DOI] [PMC free article] [PubMed] [Google Scholar]
- 10. Edes T, Kinosian B, Vuckovic NH et al. Better access, quality, and cost for clinically complex veterans with home‐based primary care. J Am Geriatr Soc 2014;62:1954–1961. [DOI] [PubMed] [Google Scholar]
- 11. Darkins A, Kendall S, Edmonson E et al. Reduced cost and mortality using home telehealth to promote self‐management of complex chronic conditions: A retrospective matched cohort study of 4,999 veteran patients. Telemed J E Health 2015;21:70–76. [DOI] [PubMed] [Google Scholar]
- 12. Klein S. The Veterans Health Administration: Implementing Patient‐Centered Medical Homes in the Nation's Largest Integrated Delivery System. Washington, DC: The Commonwealth Fund, 2011. [Google Scholar]
- 13. Rosland AM, Nelson K, Sun H et al. The patient‐centered medical home in the Veterans Health Administration. Am J Manag Care 2013;19:e263–e272. [PubMed] [Google Scholar]
- 14. Salisbury C, Sampson F, Ridd M et al. How should continuity of care in primary health care be assessed? Br J Gen Pract 2009;59:e134–e141. [DOI] [PMC free article] [PubMed] [Google Scholar]
- 15. Chokshi DA. Improving health care for veterans—a watershed moment for the VA. N Engl J Med 2014;371:297–299. [DOI] [PubMed] [Google Scholar]
- 16. Wasson JH, Sauvigne AE, Mogielnicki P et al. Continuity of outpatient medical care in elderly men: A randomized trial. JAMA 1984;252:2413–2417. [PubMed] [Google Scholar]
- 17. Chaiyachati KH, Gordon K, Long T et al. Continuity in a VA Patient‐Centered Medical Home reduces emergency department visits. PLoS One 2014;9:e96356. [DOI] [PMC free article] [PubMed] [Google Scholar]
- 18. Maciejewski ML, Powers BJ, Sanders LL et al. The intersection of patient complexity, prescriber continuity and acute care utilization. J Gen Intern Med 2014;29:594–601. [DOI] [PMC free article] [PubMed] [Google Scholar]
- 19. Schneeweiss S, Avorn J. Using health care utilization databases for epidemiologic research on therapeutics. J Clin Epidemiol 2005;58:323–337. [DOI] [PubMed] [Google Scholar]
- 20. Nutting P, Goodwin MA, Flocke SA et al. Continuity of primary care: To whom does it matter and when? Ann Fam Med 2003;1:149–155. [DOI] [PMC free article] [PubMed] [Google Scholar]
- 21. Pandhi N, Saultz JW. Patients' perceptions of interpersonal continuity of care. J Am Board Fam Pract 2006;19:390–397. [DOI] [PubMed] [Google Scholar]
- 22. Hastings SN, Horney C, Landerman LR et al. Exploring patterns of health service use in older emergency department patients. Acad Emerg Med 2010;17:1086–1092. [DOI] [PubMed] [Google Scholar]
- 23. Gill JM, Mainous AG III, Nsereko M. The effect of continuity of care on emergency department use. Arch Fam Med 2000;9:333–338. [DOI] [PubMed] [Google Scholar]
- 24. Gill JM, Mainous AG III. The role of provider continuity in preventing hospitalizations. Arch Fam Med 1998;7:352–357. [DOI] [PubMed] [Google Scholar]
- 25. Gagne JJ, Glynn RJ, Avorn J et al. A combined comorbidity score predicted mortality in elderly patients better than existing scores. J Clin Epidemiol 2011;64:749–759. [DOI] [PMC free article] [PubMed] [Google Scholar]
- 26. Breslau N, Reeb KG. Continuity of care in a university‐based practice. J Med Educ 1975;50:965–969. [DOI] [PubMed] [Google Scholar]
- 27. Magill MK, Senf J. A new method for measuring continuity of care in family practice residencies. J Fam Pract 1987;24:165–168. [PubMed] [Google Scholar]
- 28. Jee SH, Cabana MD. Indices for continuity of care: A systematic review of the literature. Med Care Res Rev 2006;63:158–188. [DOI] [PubMed] [Google Scholar]
- 29. Rodriguez HP, Rogers WH, Marshall RE et al. The effects of primary care physician visit continuity on patients' experiences with care. J Gen Intern Med 2007;22:787–793. [DOI] [PMC free article] [PubMed] [Google Scholar]
- 30. Agency for Healthcare Research and Quality . Guide to Prevention Quality Indicators: Hospital Admission for Ambulatory Care Sensitive Conditions, Version 3.1. Washington, DC: Department of Health and Human Services, 2007. [Google Scholar]
- 31. Abrams TE, Vaughan‐Sarrazin M, Rosenthal GE. Psychiatric comorbidity and mortality after acute myocardial infarction. Circ Cardiovasc Qual Outcomes 2009;2:213–220. [DOI] [PubMed] [Google Scholar]
- 32. Rizza P, Bianco A, Pavia M et al. Preventable hospitalization and access to primary health care in an area of southern Italy. BMC Health Serv Res 2007;7:134. [DOI] [PMC free article] [PubMed] [Google Scholar]
- 33. Silver MP, Babitz ME, Magill MK. Ambulatory care sensitive hospitalization rates in the aged Medicare population in Utah, 1990 to 1994: A rural‐urban comparison. J Rural Health 1997;13:285–294. [DOI] [PubMed] [Google Scholar]
- 34. Tarrant C, Windridge K, Boulton M et al. Qualitative study of the meaning of personal care in general practice. BMJ 2003;326:1310–1318. [DOI] [PMC free article] [PubMed] [Google Scholar]
- 35. Rubin G, Bate A, George A et al. Preferences for access to the GP: A discrete choice experiment. Br J Gen Pract 2006;56:743–748. [PMC free article] [PubMed] [Google Scholar]
- 36. Smucker DR, Zink T, Susman JL et al. A framework for understanding visits by frequent attenders in family practice. J Fam Pract 2001;50:847–852. [PubMed] [Google Scholar]
- 37. Saultz JW, Albedaiwi W. Interpersonal continuity of care and patient satisfaction: A critical review. Ann Fam Med 2004;2:445–451. [DOI] [PMC free article] [PubMed] [Google Scholar]
- 38. Menec VH, Sirski M, Attawar D et al. Does continuity of care with a family physician reduce hospitalizations among older adults? J Health Serv Res Policy 2006;11:196–201. [DOI] [PubMed] [Google Scholar]
- 39. Larson SL, Fleishman JA. Rural‐urban differences in usual source of care and ambulatory service use: Analyses of national data using Urban Influence Codes. Med Care 2003;41:iii65–iii74. [DOI] [PubMed] [Google Scholar]
- 40. Blazer DG, Landerman LR, Fillenbaum G et al. Health services access and use among older adults in North Carolina: Urban vs rural residents. Am J Public Health 1995;85:1384–1390. [DOI] [PMC free article] [PubMed] [Google Scholar]
- 41. Ionescu‐Ittu R, McCusker J, Ciampi A et al. Continuity of primary care and emergency department utilization among elderly people. Can Med Assoc J 2007;177:1362–1368. [DOI] [PMC free article] [PubMed] [Google Scholar]
- 42. Fortney JC, Burgess JF Jr, Bosworth HB et al. A re‐conceptualization of access for 21st century healthcare. J Gen Intern Med 2011;26(Suppl 2):639–647. [DOI] [PMC free article] [PubMed] [Google Scholar]
- 43. Bentler SE, Morgan RO, Virnig BA et al. Do claims‐based continuity of care measures reflect the patient perspective? Med Care Res Rev 2014;71:156–173. [DOI] [PMC free article] [PubMed] [Google Scholar]
- 44. Katz DA, McCoy K, Sarrazin MV. Does improved continuity of primary care affect clinician‐patient communication in VA? J Gen Intern Med 2014;29:682–688. [DOI] [PMC free article] [PubMed] [Google Scholar]
- 45. Hysong SJ, Knox MK, Haidet P. Examining clinical performance feedback in Patient‐Aligned Care Teams. J Gen Intern Med 2014;29(Suppl 2):S667–S674. [DOI] [PMC free article] [PubMed] [Google Scholar]
- 46. Fisher ES, McClellan MB, Bertko J et al. Fostering accountable health care: Moving forward in Medicare. Health Aff (Millwood) 2009;28:w219–w231. [DOI] [PMC free article] [PubMed] [Google Scholar]
- 47. Gittell JH, Godfrey M, Thistlethwaite J. Interprofessional collaborative practice and relational coordination: Improving healthcare through relationships. J Interprof Care 2013;27:210–213. [DOI] [PubMed] [Google Scholar]