

Abstract
Rationale
Emerging data suggest an important role for T lymphocytes in the pathogenesis of chronic lung disease in preterm infants. Comprehensive assessment of the lymphocyte transcriptome may identify biomarkers and mechanisms of disease.
Methods
Small volume peripheral blood samples were collected from premature infants enrolled with consent in the Prematurity and Respiratory Outcomes Program (PROP), at the time of discharge from the hospital. Blood samples were collected at two sites and shipped to a central laboratory for processing. Peripheral blood mononuclear cells (PBMCs) were isolated by Ficoll-Hypaque gradient centrifugation and separated into individual lymphocyte cell types by fluorescence-activated cell sorting. Gating strategies were optimized to ensure reproducible recovery of highly purified lymphocyte populations over a multi-year recruitment period. RNA was isolated from sorted cells and characterized by high-throughput sequencing (RNASeq).
Results
Blood volumes averaged 2.5 ml, and sufficient PBMCs were collected from 165 of the 246 samples obtained (67%) from the 277 recruited subjects to complete sorting and RNASeq analysis on the resulting sorted cells. The number of total lymphocytes per ml of blood in the neonatal subjects was approximately 4 million/ml. Total lymphocyte frequencies recovered following sort varied widely among subjects, as did the frequency of individual lymphocyte and NK cell sub-populations. RNA yield from sorted cells varied according to cell type, but RNA of sufficient quantity and quality was recovered to enable RNASeq.
Summary
Our results describe a validated procedure for the generation of genome-wide expression data from isolated lymphocyte sub-populations obtained from newborn blood.
Keywords: Flow sorting, BPD, Prematurity, Lymphocytes, T-Cell, PBMC, RNASeq
1. Introduction
Premature birth is defined as birth before completing 37 weeks of gestation. According to the Centers for Disease Control (CDC), in 2013 nearly 450,000 babies were born prematurely in the United States (Martin et al., 2015). Prematurity-related deaths accounted for 36% of all infant deaths in 2013 (Matthews et al., 2015). Recent evidence indicates that expression of inhibitory receptors of innate and adaptive immune cells differs in cord and circulating neonatal blood compared to adult blood, which could potentially lead to functional consequences on the neonatal immune response against infection (Walk et al., 2012). Alterations in CD8+ T cell repertoire in neonates could affect response to infections (Rudd et al., 2013; Grosek et al., 2013). Similarly, decreases in CD4+T, CD8+T, CD19+B and CD56+NK cells have been reported in preterm infants, relative to full term controls (Correa-Rocha et al., 2012; Ma et al., 2014). Therefore, a comprehensive assessment of lymphocyte sub-populations, and their respective phenotypes, may enable the identification of disease-related biomarkers and pathogenic mechanisms. Very few publications focus on the characteristics of pediatric blood cell populations from infants, and even fewer focus on blood cells isolated from infants who were born preterm.
Recent advances in genomics research have included improved whole transcriptome analysis of cell populations using next generation RNA sequencing (RNASeq) technology (Zeng and Mortazavi, 2012). The utility and challenges of generating high throughput data sets from immune cells has recently received much attention, which includes the development of new methodologies for sample preparation (Anon., 2013; Oberg et al., 2015; Lavinder et al., 2015; O'Connor et al., 2014). RNASeq can be reliably used to identify gene signatures associated with disease patterns from small amounts of RNA, which makes it possible to study immune cell populations with great resolution from limiting number of cells isolated from low volumes of blood. Thus, studies that were not feasible due to limiting amounts of blood and/or cell numbers, as is the case with neonatal study subjects, are now possible (Dowling and Levy, 2014).
Here, we describe the development of a protocol to ensure consistent separation of T, B, and NK lymphocyte populations and recovery of RNA from these FACS-purified lymphocytes obtained from neonatal infant blood samples, collected at multiple research sites, over the course of a multi-year study. Our results provide a valuable guide for researchers interested in studying purified lymphocyte sub-population gene expression, when blood volumes are limited, using flow cytometry based methods.
2. Methods
2.1. Protocol overview
Preterm infants were screened and consented for enrollment in the Prematurity and Respiratory Outcomes Study at two separate sites. The Golisano Children's Hospital at the University of Rochester Medical Center (Institutional Review Board (IRB# 00037933) and the Children's Hospital of Buffalo (IRB# 612707) are located approximately 75 miles apart. Blood was obtained at the time of infant discharge from the hospital, which corresponds to 36–41 weeks of corrected gestational age at birth. Standard biosafety level 2 (BSL2) procedures were observed at all times. All blood processing was completed within 24 h as our previous work showed minimal change in T cell phenotype within this time period (Scheible et al., 2012).
An outline of the protocol for handling and processing of these blood samples is described in Fig. 1. Briefly, blood was collected, maintained at room temperature, and immediately delivered to a central processing laboratory at the University of Rochester. Approximately 6–12 h after collection at either site, peripheral blood mononuclear cells (PBMCs) were isolated by density-gradient centrifugation. Isolated PBMCs were stained using a panel of antibodies developed to facilitate fluorescence-activated cell sorting of PBMC sub-populations. Sorted cell populations were processed for the recovery of RNA, which was subjected to high-throughput sequence analysis. The complete, detailed standard operating procedure (SOP) is provided as supplemental information.
Fig. 1.
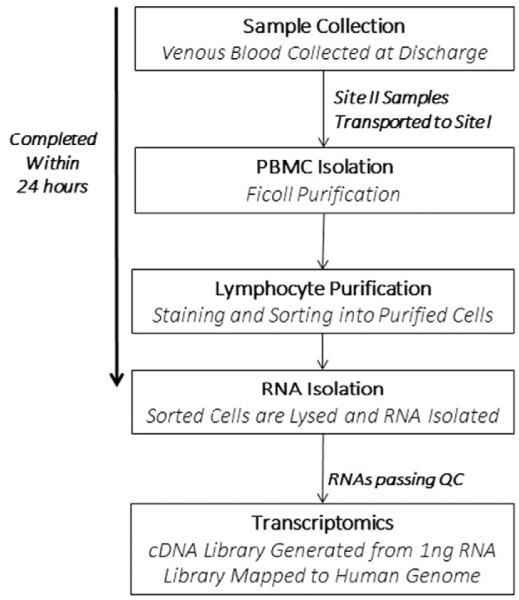
Procedure diagram. Summary of the critical steps involved in the standard operating procedure (SOP) developed for this study. A detailed SOP is included in the Supplement.
2.2. Neonatal blood draw and transport
Venous blood was drawn by clinical care staff. Sodium heparin was chosen over EDTA as an anticoagulant, as the use of heparin is associated with higher cell viability (Carter et al., 1992). At Site I, blood was routinely drawn from a peripheral vein using a 23 g butterfly catheter (BD Biosciences, San Jose, CA, #367279) attached to a 3 cm3 heparinized syringe (Smiths Medical, Dublin OH, #4043-2). The blood was subsequently delivered from the syringe to a 3 ml heparinized tube (BD #367671) via a Blood Transfer Device Female Luer Adapter (BD # 364880). The blood was delivered to an on-site central processing laboratory and maintained at room temperature for approximately 6–12 h, until processing was continued. At Site II, venous blood was dripped from a 25 g angiocatheter directly into the 3 ml heparinized tube. The blood samples was maintained at room temperature and transported to the Site 1 central processing laboratory (approximately 75 miles away) within approximately 6–12 h, using a local medical courier service.
2.3. Tracking of instrument performance
We validated two BD FACSAria cell sorters, in order to ensure availability of an instrument at all times; a 3-laser instrument, capable of detecting 13-fluorescence parameters, and a 4 laser instrument capable of detecting 18-fluorescent parameters were used. The availability of two validated cell sorters minimized the likelihood of missing the opportunity to sort a sample due to an instrument being unavailable. Supplemental Tables 1 and 2 describe the filter configuration and properties of each instrument, which were compatible with the sorting panel design.
We carefully monitored instrument performance using Peak 6 beads (Spherotech #RPC-30-5A), which allowed us to track variability in the detection of fluorescent signal for each run, and to track instrument performance over time. Peak 6 beads were run prior to each set of single colored positive controls to ensure signal was observed in each fluorescent channel. Representative histograms for fluorescence in each channel used in our sort panel are shown for both cell sorting instruments in Supplemental Fig. 1a and b, for staining antibodies and Peak 6 beads, respectively. We further ensured performance over time by performing bridging experiments when switching lots of Peak 6 beads (Supplemental Fig. 2). Interestingly, our data revealed a wide range for coefficient of variation (8–36%) of mean fluorescence intensity depending on the detection PMT, for each of the lots of beads used in our studies (Supplemental Table 3). This observation supported the importance of our bridging experiments.
Major instrument maintenance repairs or baseline calibrations were performed multiple times during the course of this 3-year study. For calibration of instruments, we utilized the fluorescence values in each channel from Peak 6 beads. The mode value of fluorescence from each channel was recorded for each of the runs between service dates, and mean values were calculated. These mean values were then used as targets when setting new voltages for each detector so that the fluorescence intensity of the Peak 6 beads matched the average value calculated from previous runs within 10%.
2.4. Peripheral blood mononuclear cell purification
Whole blood was processed to obtain PBMCs as we previously described (Scheible et al., 2015). Briefly, blood was diluted with 2 volumes Dulbecco's Phosphate Buffered Saline (DPBS), then layered over 3 ml of Ficoll™ Paque Plus (Catalog # 17-1440-03, GE Healthcare, Pittsburgh, PA) in a 15 ml conical tube and spun at 1000 X g for 30 min. The buffy coat was collected and washed 3 times using cold Hanks Balanced Salt Solution (HBSS; cat. #21-022-CM, Cellgro/Mediatech, Manassas, VA). For counting, red blood cells were lysed by the addition of ACK Lysing Buffer (cat. #10-548E, BioWhittaker/Lonza, Basel, Switzerland; 10 μl cells plus 40 μl ACK) and incubation for 10 min at room temperature. Cell yield and viability were determined following staining with the addition of 50 μl trypan blue solution (1:10 dilution of cat. #25-900-CI, Corning, Corning, NY). Viability of the cells was 95.5 ± 3.8% (mean ± S.D.).
2.5. Sample staining
We developed a staining panel to sort PBMC into four subtypes; CD3+ CD4+ T cells, CD3+ CD8+ T cells, CD3-CD19+ B cells, and CD3-CD56+ NK cells. Table 1 provides details for each of the antibody/fluorophore conjugates used in this panel. An antibody cocktail was developed consisting of optimal lot dilutions for signal to noise of anti-CD14 FITC, anti-CD235a FITC, anti-CD8 PE, 7-AAD, anti-CD56 PE-Cy7, anti-CD4 Pacific Blue, anti-CD19 APC, and anti-CD3 AlexaFluor700 (Table 1). Antibody cocktails were prepared in a BSL2 containment hood with the light off to minimize antibody-conjugated fluorochrome degradation in stock vials over time and to maintain sterility.
Table 1.
Summary of antibodies used for flow cytometry. Antibody/fluorophore combinations used to isolate CD3+ CD4+, CD3+ CD8+, CD3-CD19+ and CD3−CD56+ cell types from infant peripheral blood mononuclear cell (PBMC) samples.
| Marker | Fluorophore | Manufacturer/Cat# | Clone | Dilution |
|---|---|---|---|---|
| CD14 | FITC | BD/555397 | M5E2 | 1:10 |
| CD235a | FITC | BD/559943 | HIR2 (GA-R2) | 1:800 |
| CD8 | PE | BD/555367 | RPA-T8 | 1:65 |
| Dead Cells | 7AAD | BD/559925 | NA | 1:40 |
| CD56 | PE-Cy7 | BD/557747 | B159 | 1:20 |
| CD4 | Pacific Blue | BD/558116 | RPA-T4 | 1:20 |
| CD19 | APC | BD/555415 | HIB19 | 1:10 |
| CD3 | AF700 | BD/557943 | UCHT1 | 1:20 |
Cells to be stained were first blocked in 2% normal mouse serum (#M5905, Sigma, Saint Louis, MO) in DPBS/1% BSA for 5 min at room temperature. Cells were then spun at 300 × g for 10 min, decanted and incubated with antibody cocktail (10 μl per 1 × 10⁶ cells) on ice in the dark for 80 min. Cells were washed twice with 2 ml of PBS/1% BSA, spun at 300 × g for 10 min, resuspended in 200 μl of PBS/1% BSA and filtered through a 35 μm cell strainer into a 5 ml Falcon polystyrene test tube (#352235, BD Biosciences, San Jose, CA).
2.6. Identifying singlet T, B, and NK cell populations
We were unable to find an extensive description of the physical characteristics of the granularity and size of pediatric peripheral blood T, B and NK cells, as determined by light forward (FSC) and side (SSC) scatter (Nohmi et al., 2015; Jiang et al., 2009; Quinello et al., 2014). In general, the absolute FSC and SSC will vary from instrument to instrument, however the relative differences in the scatter properties of cells will not vary. In establishing our gating strategy, we noted that a large FSC/SSC gate was necessary, as some cells from each population of interest had large forward scatter (FSC) and/or side scatter (SSC) properties (Fig. 2 and Supplemental Fig. 4). This large initial gate was necessary to ensure maximal cell recovery of larger, more granular cells in the sorting process.
Fig. 2.

Effects of doublet exclusion upon assessment of cell size and complexity. Stained PBMCs were assessed for FSC and SSC prior to (top) or following (bottom) gating for doublet exclusion. For doublet exclusion, after the initial forward (FSC) and side (SSC) scatter gating to identify the major cells of interest, sequential pulse width bivariant are used – a FSC-H by FSC-W followed by a SSC-H by SSC-W plots are displayed. Gates for singlets are defined by excluding cells that fall outside the proportional relationship of these parameters.
In principal, to ensure the sorted cells represent single cells of interest, and not doublets containing a non-target cell stuck to the cell of interest, it is critical to identify and eliminate these doublet cells. The FACSAria has a smaller beam width than earlier generation cell sorters and a shorter fluidics pathway, meaning cells can rotate in three dimensions so that doublet discrimination cannot rely entirely on the pulse width (W). Taking advantage of the smaller beam width allows for elimination of doublets using both the W and pulse height (H). This practice is based on the recommendations from BD Bioscience. Therefore, in order to exclude the presence of cell aggregates in our sorted lymphocyte sub-populations, we gated on both SSCH/W and FSCH/W, and then characterized four relative populations based on light scatter characteristics as follows: SSChighFSClow (I), SSChighFSChigh (II), SSClowFSChigh (III) and SSClowFSClow (IV) (Fig. 2). These populations (I–IV) were assessed as CD3+ versus CD19+ to identify T/B cell doublets.
2.7. Gating strategy
The gating scheme for cell sorting is depicted in Supplemental Fig. 3a. Our initial experiments utilized fluorescence minus one stains to establish gates. Given the relatively heterogeneous size and granularity of peripheral blood mononuclear cells, our initial gate was large to include all cell types (Nohmi et al., 2015; Jiang et al., 2009; Quinello et al., 2014). After setting a generous FSC/SSC cell gate, a “dump” channel was used to exclude dead cells (7AAD+), monocyte/macrophages (CD14+) and nucleated red blood cells (CD235a+) (Scheible et al., 2012). To aid in our establishment of the live/dead gate, we utilized heat-killed PBMCs in each run of the cytometer. We next applied doublet exclusion gates based on FSC and SSC characteristics. CD3+ cells were then selected for CD4+ or CD8+ sorting, while non-T cells (CD3 negative) were sorted based on staining for CD19 (B cells) or CD56 (NK cells). An example of the gating hierarchy along with the percent of events in each gate is shown for each sorter (Supplemental Fig. 3b). The absolute number of each population of sorted cells was determined from the event counts for each population by FACSDiva software. Following this scheme, we assessed the resulting populations on an LSR-II analysis cytometer in order to assess purity (Supplemental Fig. 3c and Table 2).
Table 2.
Demographic information for 165 subjects that were studied.
| Gestational age at birth (weeks) | Days of life (Mean ± SD) |
Sex | Race | Total | |||
|---|---|---|---|---|---|---|---|
|
|
|
||||||
| Male | Female | Caucasian | African American | Others | |||
| <29 | 98 ±37 | 40 | 50 | 50 | 32 | 8 | |
| 29–36 | 38 ±18 | 36 | 25 | 41 | 14 | 6 | |
| >36 | 6±3 | 7 | 7 | 8 | 6 | ||
| Total | 83 | 82 | 99 | 52 | 14 | 165 | |
2.8. RNA isolation
Sorted cell populations were collected by centrifugation at 1000 × g for 10 min at 4 °C. Cells were disrupted in 250 μl of lysis buffer (Absolutely RNA Miniprep Isolation Kit, # 400800, Agilent Technologies, Santa Clara, CA), as per manufacturer's protocol. Lysates were drawn through a tuberculin needle on a 1 ml syringe 10 times to ensure complete lysis and shearing of genomic DNA. Lysates were frozen and RNA was purified in batches, with an on-column DNase digestion. RNA was eluted in 30 μl water and quantitated using a Nanodrop® spectrophotometer (Thermo-Fisher, Waltham, MA) and by capillary electrophoresis (Agilent Bioanalyzer).
2.9. cDNA synthesis, RNASeq data generation
For the purposes of the current study, RNAseq was performed exclusively on CD8+ T cells, with 1 ng of total RNA from each sample amplified using the SMARter Ultra Low amplification kit (Clontech, Mountain View, CA) with 25 cycles of PCR amplification. Amplified cDNA quantity was determined with the Qubit Flourometer (Life Technologies, Grand Island, NY) and quality was assessed using the Agilent Bioanalyzer 2100 (Santa Clara, CA). Library construction was performed using the NexteraXT library kit (Illumina, San Diego, CA). Nextera libraries were quantified with the Qubit Flourometer (Life Technologies, Grand Island, NY) and quality was assessed using the Agilent Tape Station (Santa Clara, CA). Libraries were sequenced (single end reads) on the Illumina HiSeq2500 (Illumina, San Diego, CA) to generate 10×106 reads/sample. Reads were aligned using the TopHat algorithm (Kim et al., 2013) and expression values were summarized using HTSeq (Anders et al., 2015).
3. Results
3.1. Lymphocyte characterization by flow cytometry
Given that we observed cells that were large and granular, particularly the NK cells, we chose to include a large cell gate and assess regions of scatter plots for cell doublets. As described in Methods section, we assessed 4 regions (I–IV) within the FSC/SSC dot plots to establish the characteristic of cells found in each region, since we could not find prior reports containing these data from pediatric peripheral blood populations. On the 13-fluorescent parameter cell sorter, the vast majority of cells were observed in the small, less complex region of the FSC/SSC gate (region IV), regardless of whether a doublet exclusion gate was (98.48 ± 1.19%; n = 15 mean ± SD) or was not (95.45 ± 2.04%) used.Regions III and IV contained the highest frequency of B cells (42.10 ± 18.59%) and T cells (63.55 ± 7.22%) respectively. Region III also contained the highest frequency of T:B doublets, which was significantly reduced by applying the doublet exclusion gate (16.16 ± 4.38% vs 6.90 ± 3.37%, p < 0.0001, paired two-tailed t-test) (Fig. 3b). Similar results were obtained when using the 18-fluorescent parameter cell sorter.
Fig. 3.

Identification of lymphocyte populations in four regions of FSC/SSC. (a) Representative distribution of CD3+ and CD19+ events and CD3+ CD19+ aggregates found in the four regions of FSC/SSC either, with or without a doublet exclusion gate applied (b). The frequency of B cells and T cells from each region is represented as mean ± SD (n = 15).
3.2. Blood sample collection statistics
From 277 enrolled subjects, a total of 246 neonatal blood samples were collected (124 from Site 1, and 122 from Site 2), and 182 had sufficient number of cells to sort. Preliminary studies indicated that RNA was not reliably obtained when < 5 million cells were sorted, and as such, sorting was only attempted when sufficient cells were available for a subject. This allowed for a > 90% success rate for the generation of RNASeq data. Thirty-one subjects either withdrew from the study or died prior to discharge blood collection. The demographic information for the study group is shown in Table 2. Each of the 165 subjects used for RNASeq analysis was placed into one of three categories based on gestational age at birth (first column). Information on the day of life at time of discharge from the nursery is displayed for each category of subjects (second column). Information on the sex of subjects in each category (third and fourth columns) and race (columns 5-7) is also displayed.
Blood volumes recovered (Fig. 4a) were highly variable, primarily due to difficulties with recovering venous blood from preterm infants, with a resulting impact on PBMC recovery (Fig. 4b). The volume of blood obtained averaged 2.44 ± 1.05 ml (range 0.25–5.00 ml) and cell recovery averaged 10.08 ± 7.05 million cells (range 0.28–49.2 million cells). We noted slight, yet non-significant differences in blood volumes (2.13 ± 0.90 ml vs 2.89 ± 1.09 ml) and PBMCs recovered (8.21 ± 5.49 vs 12.77 ± 8.13 million cells) between the two centers (Supplemental Fig. 5a and b).
Fig. 4.

Blood volumes and cell recovery. The volume of blood (a) and total PBMCs obtained (b) from each of the 182 subjects is presented (mean ± SD).
3.3. Lymphocyte frequency and variability
The total number and proportion of cell sub-populations (CD4+ T cells, CD8+ T cells, CD19+ B cells, and CD56+ NK cells) recovered following sorting varied widely across the cohort studied (Fig. 5a and b). Total lymphocyte proportion (including NK cells) as defined by our gating strategy, averaged 29.2 ± 10.6%, with a range from 4.6–60.4%. The proportion of CD4+ T cells averaged 15.15 ± 5.71%, with a range from 1.6–33.3%. The proportion of CD8+ T cells averaged 5.20 ± 2.40%, with a range from 0.66–14.65%. The proportion of CD19+ B cells averaged 7.78 ± 3.82%, with a range from 0.35–17.0%. The proportion of CD3-CD56+ NK cells averaged 1.53 ± 0.87%, with a range from 0.2–5.9%. The additional cells were monocytes (CD14+), nucleated RBCs (CD235a+) or could not be reliably defined as one of the specific cell sub-types of interest.
Fig. 5.

Sorted cell recovery and distribution. The number (a) and proportion of total cells (b) of each cell population from each subject was determined during sorting.
The relative distribution of T, B and NK cells was comparable to what we have reported previously in cord blood (Scheible et al., 2012). Relative cell proportion was as expected; CD4+T cells (15.15 ± 5.71%) > B cells (7.78 ± 3.82%) > CD8+ T cells (5.20 ± 2.40) > NK cells (1.53 ± 0.87%). It should be noted that within subjects, the relative proportion of individual cell sub-populations varied widely. For instance, the ratio of CD4/CD8 T cells was 3.43 ± 1.57 (range of 0.26–9.89) and the ratio of T cells/B cells was 3.96 ± 3.29 (range of 0.90–20.2). We assessed whether the proportion of cell types was related to variability in subject characteristics or the amount of time elapsed from sample collection to complete processing. We found no association between the proportion of any lymphocyte population and processing time elapsed. Likewise, we found no significant associations between CD4+, CD8+ and NK proportion and gestational age. However, we did observe a weak but significant (r2 = 0.22, p < 0.05) inverse correlation between CD19/B cell proportion and gestational age, and a weak but significant inverse correlation (r2 = 0.04, p < 0.05) between total lymphocyte proportion and gestational age. A decrease in the proportion of B cells has been reported to be inversely proportional to age (Morbach et al., 2010).
We also wished to assess the purity of each cell population post-sort. A post sort purity check was performed on cells isolated using both the 13- and 18-fluorescent parameter instrument. Each sorted population was highly pure, with purities of over 99% for each population (Table 3). Volume of blood and cell recovery was equivalent between subjects from the two study sites (Supplemental Fig. 5a and b).
Table 3.
Purity of sorted cell populations. Sorting for purified CD4+ T, CD8 + T, CD19+ B and CD56+ NK cells was completed as described. Following sorting, cells were analyzed on an LSRII flow cytometer to determine purity of 5 samples.
| CD3+ CD4+ |
CD3+ CD8+ |
CD19+ | CD56+ | |
|---|---|---|---|---|
| Mean ±SD |
99.70 0.24 |
99.60 0.31 |
99.04 0.68 |
99.30 0.43 |
3.4. RNA quantity and quality
Total RNA yield from sorted cells varied according to cell type, with an average of 268 ng (0.37 ng/1000 cells) for CD4+ T cells, 158 ng (0.67 ng/1000 cells) for CD8+ T cells, 157 ng (0.56 ng/1000 cells) for CD19+ B cells and 147 ng (2.5 ng/1000 cells) for CD56+ NK cells (Fig. 6a and b). Total recovery of RNA, and amount of RNA normalized to 1000 cells, was equivalent between sites (Supplemental Fig. 6a and b), and was no different between the 13- and 18-fluorescent parameter sorters (data not shown). This indicates that shipment of sample from Site 2 to Site 1 did not adversely affect cell and RNA recovery. The time elapsed between blood draw and sorting/cell lysis was not related to the quantity of RNA recovered in each subject (data not shown). Further, we found no association between RNA quantity or quality (RIN) and objective measures of library preparation or sequencing quality (e.g., read depth and coverage).
Fig. 6.

RNA recovery. The total amount of RNA (a) recovered from sorted cell types, as well as the RNA content per 1000 cells of each type (b), for each subject.
We further assessed the quantity and quality of RNA recovered from sort-purified cell sub-populations by high throughput sequencing (RNAseq). RNASeq was performed on RNA obtained from CD8+ T cells from 165 subjects (n = 72 Site 1, n = 93 Site 2), a cell population displaying intermediate RNA yields (total and per cell). cDNA libraries were generated from 1 ng input RNA. Libraries generated 18.39 ± 8.50 million raw sequence reads at a targeted sequencing depth of 10 million reads (Fig. 7a). No difference in sequencing depth was observed between study sites (18.16 ± 7.48 vs 18.57 ± 9.26 million sequence reads; Supplemental Fig. 8a). Interestingly, genomic coverage from this purified, resting lymphocyte sub-population averaged 49% (proportion of genes expressed at the mRNA level) (Fig. 7b), and similar coverage was noted between sites (Supplemental Fig. 8b). We have observed similar results from other sorted T cell populations, including matching CD4+ and CD19+ cells and cryopreserved cells that were thawed and stained (data not shown).
Fig. 7.

RNASeq read depth and coverage. High throughput sequencing was performed using RNA isolated from sorted CD8+ T cells. The total number of sequencing reads (a) and proportion of the genome represented by expressed transcripts (b) for each sample is displayed.
4. Discussion
Infants born prematurely face a lifetime of morbidities, many of which relate to the presence of increased inflammation in early life (Blencowe et al., 2012; Crump et al., 2011; Harding and Maritz, 2012; Duijts, 2012; Morales et al., 2014). Our group and others have shown that alterations in the CD4+ T cell compartment are observed in infants who are born prior to term, in the presence of inflammatory conditions, or who develop the lung disease bronchopulmonary dysplasia (Misra et al., 2015; Rueda et al., 2015). Better understanding of prematurity-related alterations in the immune system associated with disease-specific pathophysiology could lead to identification of molecular markers for diseases of preterm infants and could reveal new targets for treating inflammatory respiratory disease (Misra, 2014). Unlike in healthy adults, where large blood volumes are available, limited volumes, and circulating cell numbers, are available in neonatal populations. Here, we report a reliable method for the recovery of sorted neonatal human lymphocytes, from clinical peripheral blood specimens, in sufficient quantity to provide RNA for high-throughput sequencing. These methods are appropriate for studies of newborn infants, or other populations where blood volumes are limited. Critically, we provide an outline for developing and implementing a protocol for obtaining RNA from sort-purified cell populations, which is widely applicable for translational studies, without the need for cryopreservation. We feel this allows interrogation of the transcriptome in as close to the in vivo state as possible. Critical issues that we identified, and controlled for, include adequate training of multiple personnel in each task, strict adherence to a standardized protocol, validating procedures on more than one sorter, and tracking sorter performance over time. Although not formally tested, we feel that collaboration among a diverse group of investigators with separate expertise (basic immunology, bioinformatics, clinical, flow cytometry, genomics, etc.) was a critical component to success. We present a detailed protocol for our procedures, as consistency is likely essential to control for any confounding variables.
When isolating purified cell populations using flow cytometry-based cell sorting for translational studies, protocols must be in place to ensure consistency in instrument performance over time and for the reliable isolation of highly purified immune cell subsets free from cell-cell aggregates. Instrumental and biological staining variation must be considered when using fluorescent sorting if a longitudinal study involves immunephenotyping, where relative expression of markers and therefore fluorescence intensity is critical to achieving a consistent separation of populations and level of purity. To control for variability in fluorescent intensity while immune-phenotyping with analytical flow cytometers, investigators often run internal biological controls (e.g. from a single healthy donor) with each run that can be used as a normalization control in addition to peak 6 and single color antibody staining controls bound to Bangs beads. In this study, controlling for biological staining during fluorescent cell sorting was achieved by titration of each lot of staining antibody to obtain the best signal to background on cells. Given the potential variation of cell populations in each subject, we chose to use Bang Simply Compensation beads to serve as a more reliable and less variable source for single positive controls. Conversely, for the live dead stain, 7-AAD, heat-killed and fixed PBMC were used for compensation control.
In the current study, it was necessary for us to obtain sample from two research centers located approximately 75 miles apart. Samples were transported between sites using a courier service that was able to deliver on demand. We controlled for the length of time between blood draw and processing for sample collected from each study site; processing was routinely completed 12 h following blood draw, regardless of location.
Surprisingly, there is a lack of publications that report expected frequencies of circulating immune cells from neonatal subjects at the time of discharge from the hospital. Based upon cell counts and frequencies derived from flow cytometry analysis of our sorted samples, there is tremendous variance in both total circulating lymphocyte frequencies, and individual cell type frequencies, in neonates. Furthermore, differences in the size and granularity of cells were noted (Supplemental Fig. 4). Utilization of a small initial lymphocyte gate during the sort process would likely exclude valuable cell populations, particularly B and NK cells. Relative cell frequencies followed the expected distribution on a population level (CD4 > CD8 ≈ CD19 > CD56), but showed large variability across subjects. Some of this variability may be related to the varying gestational age at birth, and postnatal age of the subjects participating in this particular study. A more thorough assessment of differences in immune cell distribution in these subjects is ongoing and beyond the scope of this report.
An additional important issue is the verification of methods for optimization of cell processing for maximal RNA quantity and quality. Direct sorting of cells into RNA lysis buffer was not an option, since the buffer volume containing the sorted cells was high and would have resulted in poor lysis/RNA yield. An initial experiment revealed that placing purified cell pellets in a commercially available RNA stabilizer resulted in low cell recovery and RNA yield following centrifugation (data not shown). Therefore, cells were recovered from the sorter by higher speed centrifugation, to minimize loss of charged post-sort cells on tube wall, and immediately lysed and homogenized prior to freezing. While the methods described here for RNA preparation were successful using 5 million PBMC for staining/sorting, based upon the state of the art around 2010, current capabilities may make similar procedures feasible using many fewer cells.
Limited data are available that describe anticipated RNA yields from sorted lymphocyte populations in newborn infants, born at either term or prior to term. Our data indicates that the RNA composition of different circulating cells varies widely across types and subjects. Interestingly, we find that NK cells (CD3−/CD56+) have the highest RNA concentration (per 1000 cells), while CD4+ T cells have the least, with over an order of magnitude difference. Our yield of cells per milliliter of blood, frequency of cell populations and RNA yield per 1000 cells were not significantly different between sites, illustrating that our workflow did not affect these parameters. Importantly, the quantity and quality of sort-purified lymphocytes recovered from neonatal peripheral blood samples using the protocol outlined here, were of sufficient quality for RNASeq.
In summary, we present a procedure that allows for consistent and reliable isolation of RNA that is of sufficient quality to generate RNASeq data from purified lymphocyte populations recovered from small volume peripheral blood samples. Future studies will focus on transcriptomic profiling of immune cells from neonatal subjects. Therefore, our results, illustrating the frequency of these sorted cell types, and the quality and quantity of RNA recovered from freshly sorted PBMC, should be of interest to a wide audience.
Supplementary Material
Acknowledgements
This project has been funded wholly or in part with Federal funds from the National Institute of Allergy and Infectious Diseases, National Institutes of Health, Department of Health and Human Services, under Contract No. HHSN27220120005C (The Respiratory Pathogens Research Center) and by NHLBI HL101813 (Prematurity and Respiratory Outcomes Program). The authors would like to thank Valerie A. Lunger for expert technical assistance. We are grateful to all of the children and families that participated in this study. We are also grateful to the URMC Obstetrics and Neonatal ICU Nursing Teams especially nurses Jean Livingston and Paula Emrich for drawing the discharge blood samples, and the study nurses and coordinators including Elizabeth Werner, Tanya Scalise and Dee Maffett for subject recruitment and sample collection. We gratefully acknowledge Jeanne Holden-Wiltse and her team for providing bioinformatics support of this study. Finally, we gratefully acknowledge Dr. John Ashton, Michelle Zanche and staff members of the Genomics Research Center at the University of Rochester Medical Center.
Funding support
NHLBI HL101813, NIAID HHSN27220120005C.
Footnotes
Author contributions
RSM, SB, JCEW, CGS, TPB, TRW, SAQ, GSP, and TJM designed and performed the experiments, analyzed the data and wrote the paper; ARM, RMR, HLH, SLS, SSS and SKM designed and performed the experiments; RSM, TJM and GSP oversaw the project.
Appendix A. Supplementary data
Supplementary data to this article can be found online at http://dx.doi.org/10.1016/j.jim.2016.07.001.
References
- Anders S, Pyl PT, Huber W. HTSeq—a Python framework to work with high-throughput sequencing data. Bioinformatics. 2015;31(2):166–169. doi: 10.1093/bioinformatics/btu638. Jan 15, PubMed PMID: 25260700. [DOI] [PMC free article] [PubMed] [Google Scholar]
- Anon. High-throughput methods in immunology. J. Immunol. Methods. 2013:400–401. doi: 10.1016/j.jim.2013.11.002. 1 (Dec 31, PubMed PMID: 24239866. [DOI] [PubMed] [Google Scholar]
- Blencowe H, Cousens S, Oestergaard MZ, Chou D, Moller AB, Narwal R, et al. National, regional, and worldwide estimates of preterm birth rates in the year 2010 with time trends since 1990 for selected countries: a systematic analysis and implications. Lancet. 2012;379(9832):2162–2172. doi: 10.1016/S0140-6736(12)60820-4. Jun 9, PubMed PMID: 22682464. [DOI] [PubMed] [Google Scholar]
- Carter PH, Resto-Ruiz S, Washington GC, Ethridge S, Palini A, Vogt R, et al. Flow cytometric analysis of whole blood lysis, three anticoagulants, and five cell preparations. Cytometry. 1992;13(1):68–74. doi: 10.1002/cyto.990130111. PubMed PMID: 1372204. [DOI] [PubMed] [Google Scholar]
- Correa-Rocha R, Perez A, Lorente R, Ferrando-Martinez S, Leal M, Gurbindo D, et al. Preterm neonates show marked leukopenia and lymphopenia that are associated with increased regulatory T-cell values and diminished IL-7. Pediatr. Res. 2012;71(5):590–597. doi: 10.1038/pr.2012.6. PubMed PMID: 22398700, May. [DOI] [PubMed] [Google Scholar]
- Crump C, Sundquist K, Sundquist J, Winkleby MA. Gestational age at birth and mortality in young adulthood. JAMA. 2011;306(11):1233–1240. doi: 10.1001/jama.2011.1331. Sep 21, PubMed PMID: 21934056. [DOI] [PubMed] [Google Scholar]
- Dowling DJ, Levy O. Ontogeny of early life immunity. Trends Immunol. 2014;35(7):299–310. doi: 10.1016/j.it.2014.04.007. Jul, PubMed PMID: 24880460. [DOI] [PMC free article] [PubMed] [Google Scholar]
- Duijts L. Fetal and infant origins of asthma. Eur. J. Epidemiol. 2012;27(1):5–14. doi: 10.1007/s10654-012-9657-y. Jan, PubMed PMID: 22350146. Pubmed Central PMCID: 3292726. [DOI] [PMC free article] [PubMed] [Google Scholar]
- Grosek S, Petrin Z, Kopitar AN, Grosek J, Erzen J, Gmeiner TS, et al. Low CD8 T cells in neonates and infants prior to surgery, and health-care-associated infections: prospective observational study. Pediatr. Int. 2013;55(4):410–415. doi: 10.1111/ped.12142. PubMed PMID: 23701302, Aug. [DOI] [PubMed] [Google Scholar]
- Harding R, Maritz G. Maternal and fetal origins of lung disease in adulthood. Semin. Fetal Neonatal Med. 2012;17(2):67–72. doi: 10.1016/j.siny.2012.01.005. Apr, PubMed PMID: 22277111. [DOI] [PubMed] [Google Scholar]
- Jiang H, van de Ven C, Baxi L, Satwani P, Cairo MS. Differential gene expression signatures of adult peripheral blood vs cord blood monocyte-derived immature and mature dendritic cells. Exp. Hematol. 2009;37(10):1201–1215. doi: 10.1016/j.exphem.2009.07.010. Oct, PubMed PMID: 19647780. [DOI] [PubMed] [Google Scholar]
- Kim D, Pertea G, Trapnell C, Pimentel H, Kelley R, Salzberg SL. TopHat2: accurate alignment of transcriptomes in the presence of insertions, deletions and gene fusions. Genome Biol. 2013;14(4):R36. doi: 10.1186/gb-2013-14-4-r36. PubMed PMID: 23618408. [DOI] [PMC free article] [PubMed] [Google Scholar]
- Lavinder JJ, Horton AP, Georgiou G, Ippolito GC. Next-generation sequencing and protein mass spectrometry for the comprehensive analysis of human cellular and serum antibody repertoires. Curr. Opin. Chem. Biol. 2015;24:112–120. doi: 10.1016/j.cbpa.2014.11.007. PubMed PMID: 25461729, Feb. [DOI] [PubMed] [Google Scholar]
- Ma L, Chen R, Liu F, Li Y, Wu Z, Zhong W, et al. Reduced NK cell percentage at birth is associated with late onset infection in very preterm neonates. Scand. J. Immunol. 2014;80(1):50–56. doi: 10.1111/sji.12181. PubMed PMID: 24724837, Jul. [DOI] [PubMed] [Google Scholar]
- Martin JA, Hamilton BE, Osterman MJ, Curtin SC, Matthews TJ. Births: final data for 2013. National Vital Statistics Reports: From the Centers for Disease Control and Prevention, National Center for Health Statistics, National Vital Statistics System. 2015;64(1):1–65. PubMed PMID: 25603115, Jan 15. [PubMed] [Google Scholar]
- Matthews TJ, MacDorman MF, Thoma ME. Infant mortality statistics from the 2013 period linked birth/infant death data set. National Vital Statistics Reports: From the Centers for Disease Control and Prevention, National Center for Health Statistics, National Vital Statistics System. 2015;64(9):1–30. PubMed PMID: 26270610, Aug 6. [PubMed] [Google Scholar]
- Misra RS. A review of the CD4+ T cell contribution to lung infection, inflammation and repair with a focus on wheeze and asthma in the pediatric population. EC Microbiol. 2014;1(1):4–14. PMID: 26280024. [PMC free article] [PubMed] [Google Scholar]
- Misra RS, Fowell D, Wang H, Scheible S, Misra S, Huyck H, Wyman C, Ryan RM, Reynolds AM, Mariani TJ, Katzman PJ, Pryhuber GS. Preterm cord blood CD4+ T cells exhibit increased IL-6 production in chorioamnionitis and decreased CD4+ T cells in bronchopulmonary dysplasia. Hum. Immunol. 2015 doi: 10.1016/j.humimm.2015.03.007. SS. PMID: 25797206. [DOI] [PMC free article] [PubMed] [Google Scholar]
- Morales E, Garcia-Esteban R, Asensio de la Cruz O, Basterrechea M, Lertxundi A, Martinez Lopez de Dicastillo MD, et al. Intrauterine and early postnatal exposure to outdoor air pollution and lung function at preschool age. Thorax. 2014 doi: 10.1136/thoraxjnl-2014-205413. Oct 20, PubMed PMID: 25331281. [DOI] [PubMed] [Google Scholar]
- Morbach H, Eichhorn EM, Liese JG, Girschick HJ. Reference values for B cell subpopulations from infancy to adulthood. Clin. Exp. Immunol. 2010;162(2):271–279. doi: 10.1111/j.1365-2249.2010.04206.x. Nov, PubMed PMID: 20854328. [DOI] [PMC free article] [PubMed] [Google Scholar]
- Nohmi K, Tokuhara D, Tachibana D, Saito M, Sakashita Y, Nakano A, et al. Zymosan induces immune responses comparable with those of adults in monocytes, dendritic cells, and monocyte-derived dendritic cells from cord blood. J. Pediatr. 2015;167(1):155–162. doi: 10.1016/j.jpeds.2015.03.035. Jul, e1–2, PubMed PMID: 25957979. [DOI] [PubMed] [Google Scholar]
- Oberg AL, McKinney BA, Schaid DJ, Pankratz VS, Kennedy RB, Poland GA. Lessons learned in the analysis of high-dimensional data in vaccinomics. Vaccine. 2015;33(40):5262–5270. doi: 10.1016/j.vaccine.2015.04.088. Sep 29, PubMed PMID: 25957070. [DOI] [PMC free article] [PubMed] [Google Scholar]
- O'Connor JE, Herrera G, Martinez-Romero A, de Oyanguren FS, Diaz L, Gomes A, et al. Systems biology and immune aging. Immunol. Lett. 2014;162(1):334–345. doi: 10.1016/j.imlet.2014.09.009. Pt B. Nov, PubMed PMID: 25251660. [DOI] [PubMed] [Google Scholar]
- Quinello C, Silveira-Lessa AL, Ceccon ME, Cianciarullo MA, Carneiro-Sampaio M, Palmeira P. Phenotypic differences in leucocyte populations among healthy preterm and full-term newborns. Scand. J. Immunol. 2014;80(1):57–70. doi: 10.1111/sji.12183. Jul, PubMed PMID: 24724912. [DOI] [PubMed] [Google Scholar]
- Rudd BD, Venturi V, Smith NL, Nzingha K, Goldberg EL, Li G, et al. Acute neonatal infections 'lock-in' a suboptimal CD8+ T cell repertoire with impaired recall responses. PLoS Pathog. 2013;9(9):e1003572. doi: 10.1371/journal.ppat.1003572. Sep, PubMed PMID: 24068921. [DOI] [PMC free article] [PubMed] [Google Scholar]
- Rueda CM, Wells CB, Gisslen T, Jobe AH, Kallapur SG, Chougnet CA. Effect of chorioamnionitis on regulatory T cells in moderate/late preterm neonates. Hum. Immunol. 2015;76(1):65–73. doi: 10.1016/j.humimm.2014.10.016. Jan, PubMed PMID: 25451985. [DOI] [PMC free article] [PubMed] [Google Scholar]
- Scheible K, Secor-Socha S, Wightman T, Wang H, Mariani TJ, Topham DJ, et al. Stability of T cell phenotype and functional assays following heparinized umbilical cord blood collection. Cytometry A. 2012;81(11):937–949. doi: 10.1002/cyto.a.22203. Nov, PubMed PMID: 23027690. [DOI] [PMC free article] [PubMed] [Google Scholar]
- Scheible KM, Emo J, Yang H, Holden-Wiltse J, Straw A, Huyck H, et al. Developmentally determined reduction in CD31 during gestation is associated with CD8+ T cell effector differentiation in preterm infants. Clin. Immunol. 2015;161(2):65–74. doi: 10.1016/j.clim.2015.07.003. Jul 29, PubMed PMID: 26232733. [DOI] [PMC free article] [PubMed] [Google Scholar]
- Walk J, Westerlaken GH, van Uden NO, Belderbos ME, Meyaard L, Bont LJ. Inhibitory receptor expression on neonatal immune cells. Clin. Exp. Immunol. 2012;169(2):164–171. doi: 10.1111/j.1365-2249.2012.04599.x. Aug, PubMed PMID: 22774991. [DOI] [PMC free article] [PubMed] [Google Scholar]
- Zeng W, Mortazavi A. Technical considerations for functional sequencing assays. Nat. Immunol. 2012;13(9):802–807. doi: 10.1038/ni.2407. Sep, PubMed PMID: 22910383. [DOI] [PMC free article] [PubMed] [Google Scholar]
Associated Data
This section collects any data citations, data availability statements, or supplementary materials included in this article.