SUMMARY
Little is known about the ability of Drosophila circadian neurons to promote sleep. We show here with optogenetic manipulations and video recording that a subset of dorsal clock neurons (DN1s) are potent sleep-promoting cells, releasing glutamate to directly inhibit key pacemaker neurons. These pacemakers promote morning arousal by activating these same DN1s, implying that there is a late-day feedback circuit to drive siesta and nighttime sleep. To address more plastic aspects of the sleep program, we used a novel calcium assay to monitor and compared the real-time DN1 activity of freely behaving males and females. It revealed a dramatic sexual dimorphism, which parallels the well-known difference in daytime sleep. DN1 activity is also enhanced by elevated temperature, consistent with its known effect on sleep. These new approaches indicate that the DN1s have a major impact on the fly sleep-wake profile and integrate environmental information with the circadian molecular program.
Mammalian circadian feedback loops take place in many if not most tissues. They include the suprachiasmatic nucleus (SCN), the ca. 10,000 neurons of the master pacemaker in the hypothalamus,1,2. The equivalent circadian region of Drosophila brain contains about 75 pairs of neurons; they are arranged in several groups3 and play a major role in determining the characteristic locomotor activity program4–6. It is characterized by morning (M) and evening (E) activity peaks under 12:12 light:dark (LD) conditions. There is also a mid-day siesta between the two activity peaks as well as quite consolidated sleep at night7. M activity is largely determined by the 4 circadian M cells, the PDF-positive small ventrolateral neurons (sLNvs)7,8, whereas E activity is due to 3 CRY-positive dorsal lateral neurons (LNds) and the 5th sLNv (E cells)9–12. Although fly sleep is regulated by the clock, there are no known circadian neurons that function predominantly to inhibit locomotor activity or promote sleep, i.e., that make a major contribution to the mid-day siesta or nighttime sleep.
In the course of applying different GAL4 lines, optogenetics and a new calcium assay to the study of fly behavior and circadian neuronal activity, we discovered that a group of glutamatergic dorsal clock neurons (DN1s) are sleep-promoting. Previous work had shown that DN1s function as activity-promoting neurons5,13, but our results indicate an additional role: glutamatergic DN1s negatively feedback onto M and E cells and thereby promote sleep, especially during the mid-day. Without these neurons and this feedback mechanism, the classical activity/sleep pattern of Drosophila is compromised. Our methods also show that these same clock neurons shape the sleep pattern in response to environmental change and should be widely applicable to other fly neurons and behaviors.
DN1 neuronal activity shapes the activity and sleep profile
To monitor more precisely the movement and sleep of adult flies, we used an automated video recording assay instead of DAM (Drosophila activity monitor, Trikinetics)14,15. We also introduced the use of 96-well plates to allow other experimental manipulations (see Methods and Extended Data Fig. 1; also see ref16). In this format, the flies had normal bimodal locomotor activity and stable sleep/wake cycles over many LD days (Extended Data Fig. 1). To validate the system, we compared video recording between 96-well plates and Trikinetics tubes; the two methods produced identical patterns (e.g., compare Fig. 1a right with center).
Figure 1. Manipulation of DN1 activity affects the activity/sleep pattern.
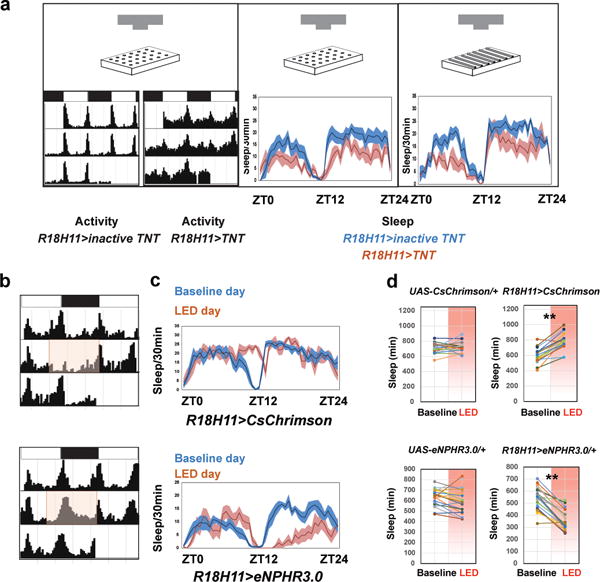
a, Activity and sleep data for experimental (R18H11-GAL4/UAS-TNT) and control (R18H11-GAL4/UAS-inactive TNT) male flies. The recording paradigm used (video of 96-well plates or DAM tubes) is indicated by the cartoon. (Left panel) Activity data for control (left) and experimental (right) male flies in LD. White bars indicate daytime (ZT0–12); black bars indicate nighttime (ZT12–24). (Right panel) Sleep traces for control (blue) and experimental groups (red). The genotypes are indicated below the panel. Shading corresponds to SEM. n=14 for GAL4>inactive TNT and 16 for GAL4>TNT. b–d, Stimulation and inhibition of DN1 firing modulate the E activity peak and sleep. b, Activity record of experimental flies. The pink boxes denote the red light (637 nm) stimulation window. c, Sleep traces from the baseline day (blue) and the red LED light stimulation day (red) of experimental flies. The pink bar represents the red light illumination (stripe bar upper, 10 HZ light pulse; solid bar lower, constant light). Shading corresponds to SEM. d, Quantification of sleep gained and lost between the baseline day (white background) and LED stimulation day (pink background) during ZT7–12 (LED on times) in each group. n=19 for UAS-CsChrimson/+ and UAS-eNPHR3.0/+, n=20 for R18H11>CsChrimson and 21 for R18H11>eNPHR3.0. ‘**’ indicates p<0.001 by paired t-test.
To address the function of DN1s, we first expressed the synaptic neurotransmitter blocker tetanus toxin light chain (TNT) in male flies with the two most commonly used DN1 drivers (Clk4.1M-GAL4 and R18H11-GAL4)13,17–20. Comparing these two expression patterns confirmed that R18H11 promoter is expressed more strongly in a subgroup of Clk4.1M-defined DN1s (Extended Data Fig. 2; for simplicity we will refer to these cells as DN1s). Expression of the inactive toxin (Tet) did not alter wild-type behavioral profiles (data not shown).
The DN1>TNT flies were more active than control flies at almost all times of day, which markedly reduced the bimodal activity pattern (Fig. 1a). Blocking DN1 neurotransmitter release also strongly decreased the siesta and nighttime sleep levels (Fig. 1a and Extended Data Fig. 3). Interestingly, the decrease in total sleep levels of DN1>TNT flies was due to a reduction of sleep episode duration during both the daytime and nighttime; there was also a slight decrease in locomotor activity during wake (Extended Data Fig. 3). As these DN1-blocked flies were still rhythmic in DD (Extended Data Fig. 3g), free-running rhythmicity does not require DN1 neurotransmitter output18. The data taken together suggest that a DN1 neurotransmitter shapes the standard Drosophila light-dark locomotor activity pattern and also enhances sleep levels, a surprising result given the previous role of DN1s in enhancing morning arousal5,13,21,22.
If blocking DN1 output suppresses sleep, DN1 activation by the red-shifted channelrhodopsin CsChrimson23,24 should promote sleep and inhibit locomotor activity. To address this possibility, we combined optogenetic stimulation25 with behavioral monitoring in the 96-well plate format. The LED stimulation (0.08mW/mm2) was turned on between ZT 7–24, to examine the effect of DN1 activation on the siesta, evening peak and nighttime sleep.
Red light-mediated DN1 activation strongly and rapidly affected fly behavior (Fig. 1b): locomotor activity was suppressed (Fig. 1b, top), and the siesta was extended (Fig. 1c, top). In contrast, the locomotor activity and sleep levels of flies without CsChrimson expression were similar to the preceding baseline days (Fig. 1d, top left). Addition of CRY-GAL80 to the R18H11-GAL4 inhibits DN1 expression (Extended Data Fig. 4a), and expression of CsChrimson with this R18H11-GAL4;CRY-GAL80 driver did not promote sleep even under much longer 24hr LED stimulation (Extended Data Fig. 4b). In addition, co-expression of TNT and CsChrimson in DN1s reduces sleep and eliminates the sleep-promoting effect of activation, further indicating that DN1s are a source of a sleep-promoting neurotransmitter (Extended Data Fig. 4b).
Importantly, DN1-activated flies have an enhanced arousal threshold as expected from the increased sleep. We assayed arousal threshold by video-recording the trajectory of flies in response to a mechanical stimulus (Extended Data Fig. 5). Without LED illumination, a low stimulus (1 tap) woke up ~50% of DN1>CsChrimson flies at ZT6 and 100% of these flies at ZT10. This indicates that they have a higher arousal threshold during siesta than during evening activity (Extended Data Fig. 5b). Significantly, red light-mediated DN1 activation strongly reduced the percentage of DN1>CsChrimson flies aroused by the stimulus at both time points (Extended Data Fig. 5b). The enhanced quiescence was not due to a loss of locomotor ability or a comatose-like state, since a stronger stimulus (10 taps) increased the percentage of aroused flies from ~20% to ~70% (Extended Data Fig. 5b). Furthermore, DN1>TNT flies not only had a reduced arousal threshold but were also more sensitive to the low stimulus (1 tap) during siesta time (Extended Data Fig. 5b).
We extended the optogenetic approach by activating the inhibitory halorhodopsin eNpHR3.0. Because eNpHR3.0 responds to constant 630 nm red light26, we exposed flies to constant high intensity 627 nm light (1mW/mm2) between ZT 7–24. The activity of control flies is affected by the strong illumination, with a delayed E peak but without a net effect on total sleep; this is because the illumination increased daytime sleep but reduced nighttime sleep (data not shown). In contrast, illuminating the DN1>eNpHR3.0 flies extended the E activity peak throughout the whole night (Fig. 1b, bottom left) and strongly reduced sleep (Fig. 1c–d, bottom right). When the LED was turned on only during the daytime, the siesta was enhanced in control flies as expected from the above results27, but the DN1>eNpHR3.0 flies had significantly reduced siesta (Extended data Fig. 6b). The optogenetic strategies taken together show that the DN1s play a major role in shaping the standard Drosophila light-dark locomotor activity pattern and in determining proper sleep levels.
DN1s mediate a Negative Feedback Interaction with the Core Pacemakers
Given the important role of the DN1s on the E peak and sleep, we considered that the DN1s might interact with the activity-promoting core pacemakers, i.e., the M and E cells10. Because optogenetically activating E cells not only causes immediate activity but also inhibits sleep (data not shown), this opposite behavioral response from activating DN1s suggests an inhibitory interaction between DN1s and these circadian neurons. As the dendritic region of the E cells and the presynaptic region of DN1s are localized to the same brain region, the interaction between these two groups might be direct (Fig. 2a and Extended data Fig. 7).
Figure 2. DN1s directly contact and reduce calcium levels in core pacemakers.
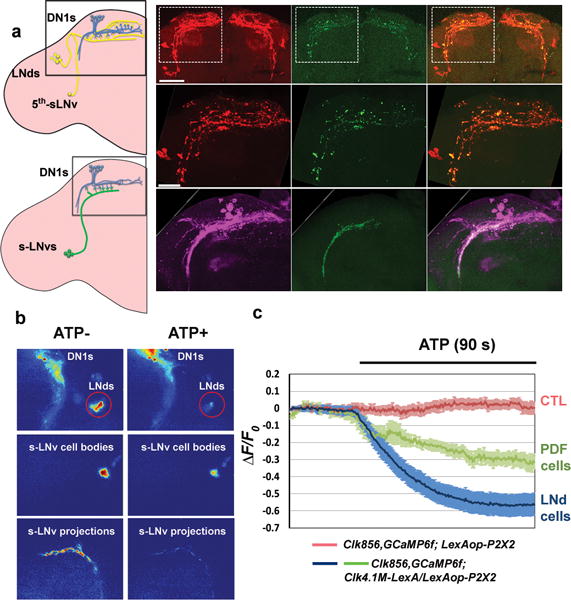
a, GRASP assays indicate contact between E cells, M cells and DN1s in the dorsal brain. Red signal indicates the large fragment of GFP (GFP1–10) expressed in the projections of E cells. The green signal shows the contact area between E cells and DN1s. The overlay is shown in the rightmost panel. Scale bar=50 μm. Magnified images of the boxed area are shown in the middle. Scale bar=20 μm. The GRASP signal (green) between DN1s (magenta) and M cells is shown in the lower row. b–c, DN1s inhibit calcium levels in the core pacemakers. b, Pseudo-colored images of GCaMP6f fluorescence intensity from representative brains before and after ATP application. c, Mean GCaMP6f response traces are plotted. The genotypes for each group are labeled below. Solid line: ATP application. n=8 for negative control, 7 for PDF cells and 11 for LNds. ‘**’ indicates p<0.001 by unpaired two-tailed Student’s t-test and shading correspond to SEM.
Indeed, GRASP-labeling (GFP reconstitution across synaptic partners28) verifies that DN1s and E cells are in close proximity (Fig. 2a green, upper and middle panels). This contact occurs within the E cell dendritic region as expected (Extended data Fig. 7). The same GRASP strategy shows that DN1s also contact the dorsal axon region of PDF cells (Fig. 2a) as shown5,22. Based on previous indications that E cells promote total activity levels10, that the M cells promote morning activity18,19 and that the DN1s inhibit locomotor activity and promote sleep, these contacts may reflect inhibitory interactions between DN1s and both M and E cells.
To address this possibility, we expressed the ATP-gated cation channel P2X2 in DN1s and used GCaMP6f to detect calcium changes in M and E cells after ATP addition to an in vitro brain preparation29,30. To more easily examine any inhibitory effect of DN1 activation, we did these experiments at dawn and dusk, when M and E cells have higher neuronal activity and brighter endogenous GCaMP6f signal (unpublished data). ATP perfusion triggers a calcium increase in the DN1 region as expected from P2X2 channel expression (Fig. 2b top and Supplementary Video 1), and there was a simultaneous reduction of GCaMP6f signal in the cell bodies of M and E cells as well as in the dorsal terminal of M cells (Fig. 2b and Extended Data Fig. 8a–b). The results confirm an inhibitory effect of DN1s on activity-promoting circadian neurons and suggest that this effect transitions flies from “wake” to “sleep” under circadian control.
Glutamate signals from DN1s to core pacemakers to modulate the E peak
How might these DN1 inhibitory interactions modulate the locomotor activity and sleep profiles? Immunostaining indicates that the DN1 projections and especially those of the R18H11-GAL4-labeled subset are strongly stained by VGLUT (the vesicular glutamate transporter) antibodies (Supplementary Video 2)31. Co-staining of R18H11-LexA and VGlutMI04979-GAL4-labelled neurons confirmed that all of these DN1s are glutamatergic (Fig. 3a)32. Previous studies have shown that glutamate often functions as an inhibitory neurotransmitter in the fly central nervous system (Extended Data Fig. 8c–d)31,33. Moreover, RNA profiling of DN1s34 shows that they are more than two orders of magnitude enriched in vglut mRNA compared to other circadian neuron subgroups (data not shown).
Figure 3. DN1s inhibit E cells via glutamate release to modulate the E peak and sleep.
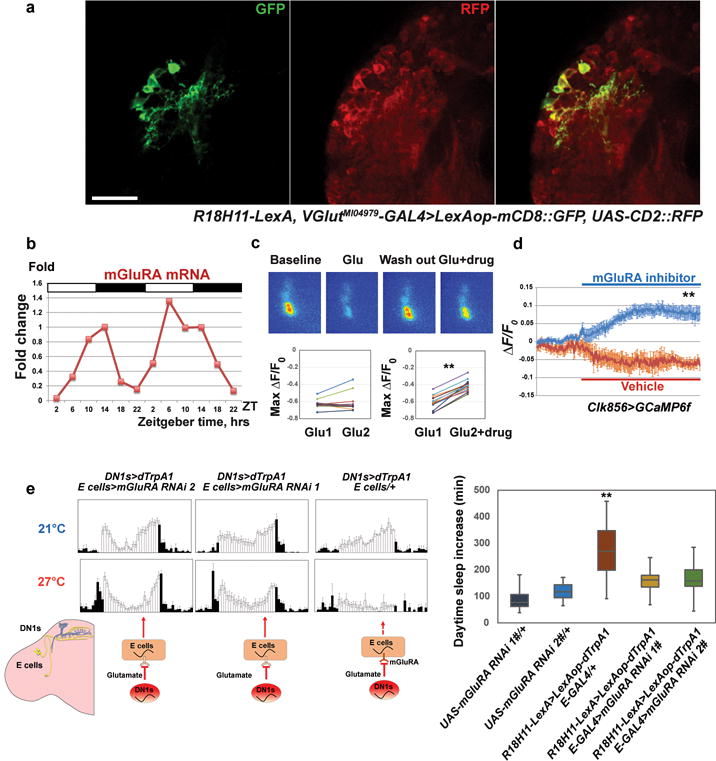
a, R18H11-driver labeled DN1s are glutamatergic. Anti-GFP (left) and anti-RFP (middle) staining was visualized in the dorsal brain of flies. Genotype is shown below. Scale bar=20 μm. b, mGluRA mRNA levels cycle in E cells, peaking at mid-day. Two independent sets of 6 time points for mGluRA levels are plotted consecutively. c, Co-application of the mGluRA specific antagonist LY 341495 with glutamate blocks the glutamate-induced inhibition. The 4 middle panels are representative GCaMP6f images of s-LNvs during baseline, glutamate perfusion, wash out and glutamate plus LY 341495 perfusion (from left to right). The quantification of peak GCaMP6f changes is plotted in the two lower panels. n=8 for left panel and n=11 for right. ‘**’ indicates p<0.001 by paired t-test. d, Perfusion of LY 341495 increases calcium levels within s-LNvs. Mean GCaMP6f response traces are plotted. n=11 for the experimental group and n=7 for the negative control group. ‘**’ indicates p<0.001 by unpaired two-tailed Student’s t-test. Shading corresponds to SEM. e, Reducing mGluRA within E cells impairs the DN1 activation effect on E peak and sleep. (Left panel) The activity pattern of control and mGluRA RNAi flies at 21 °C and 27 °C. (Right panel) Quantification of daytime sleep changes from different groups. Box boundaries represent the first and third quartiles, and whiskers are 1.5 interquartile range. Genotypes are shown below. n=31, 32, 32, 30 and 29, respectively. ‘**’ indicates p<0.001 by one-way ANOVA with Tukey’s post-hoc test.
Consistent with these indications, GCaMP6- and Arclight-mediated imaging shows that direct perfusion of glutamate significantly decreased calcium levels and hyperpolarized the membrane potential of both M and E cells (Fig. 3c and Extended Data Fig. 8c–d; E cell data are not shown). Moreover, flies co-expressing dTrpA1 and Vglut RNAi within the DN1s maintain a higher E activity peak at high temperature than DN1>dTrpA1 flies (Extended Data Fig. 9), further indicating that glutamate is a DN1-derived inhibitory neurotransmitter (Fig. 2b).
RNA profiling of E cells indicates that they express the metabotropic glutamate receptor mGluRA, which decreases intracellular calcium31. Moreover, purification of E cells at different circadian times34 indicates that this mRNA undergoes strong circadian oscillations with a peak around ZT 7–14 and a trough during the night (Fig. 3b). Cycling of this mRNA can explain why activation of DN1s inhibits E cell-derived locomotor activity predominantly in the late daytime-early night and is consistent with suggestions from previous studies31,35,36. Other DN1-derived neurotransmitters or neuropeptides may be dominant at other times of day, e.g., to promote morning activity at dawn13 (see Discussion).
To further test the role of mGluRA, we directly applied the mGluRA specific inhibitor LY 341495 (700 nM) to dissected fly brains expressing GCaMP6f in circadian neurons31,33. It significantly reduced the glutamate-induced calcium decrease in core pacemakers (Fig. 3c). Baseline calcium levels of s-LNvs were also modestly but significantly increased (10%) by perfusing LY 341495 (Fig. 3d), suggesting that core pacemaker is inhibited by endogenous glutamate.
A RNAi strategy was used to address the importance of mGluRA expression within circadian cells. Expression of mGluRA-RNAi in M and E cells with DvPdf-GAL4 not only decreased the inhibitory effect of glutamate (Extended Data Fig. 10a) but also significantly reduced baseline sleep levels, especially the siesta (Extended Data Fig. 10b). In addition, DN1 activation by dTrpA1 increased daytime sleep and inhibited the E peak, an effect that was blunted by reducing mGluRA levels in E cells (Fig. 3e). Although the RNAi results do not prove that the mRNA cycling is significant, they support a functional glutamate-mediated inhibitory connection between DN1s and E cells. These data further indicate that the DN1s have a major influence on the locomotor activity pattern, by promoting the siesta in a temporally-gated manner.
Temperature- and sex-regulated DN1 activity controls fly sleep
Females have a dramatically different locomotor activity and sleep pattern than males: females manifest a much less robust siesta and a less pronounced evening peak. The siesta and evening peak phenotypes are a result of more uniform female daytime activity (Extended Data Fig. 1a)37. In addition, higher temperatures increase the magnitude of the siesta, which is most apparent in females because of their reduced siesta38,39. The robust temperature-dependent increase in the siesta may be an adaptation to seasonal changes, i.e., more summer-like conditions40.
To address this issue in detail, we developed a real-time neuronal activity assay of live flies in the 96-well format. A recently generated calcium-dependent transcription activator UAS-CaLexA41 and LexAop-LUC (luciferase) were expressed in DN1s, and individual flies assayed in a standard Topcount plate-reader42. LUC activity in these animals should reflect neuronal activity (via calcium levels) in the cells expressing CaLexA. We used optogenetics as an initial test of this approach, by co-expressing the CsChrimson with CaLexA-LUC in DN1s and exposing the flies to a 10 min red light pulse; it caused a rapid and dramatic increase in LUC activity (Fig. 4a). We also tested the inhibitory effect of eNpHR3.0 expression in DN1s, by measuring CaLexA-LUC levels under constant strong red light illumination. The intense light significantly reduced LUC activity for hours (Extended Data Fig. 6a).
Figure 4. DN1 neuronal activity is sexually dimorphic and can be activated by warm temperatures to enhance fly sleep.
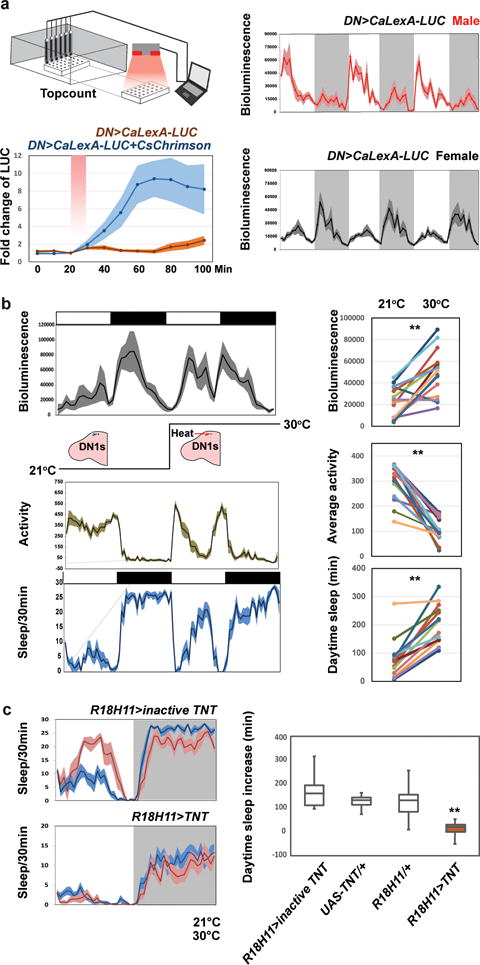
a, Characterization of CaLexA-LUC in freely behaving animals. (Left panel) LUC levels probably reflect neuronal activity in DN1s after CsChrimson stimulation (lower panel). The fold-change of luminescence was calculated as the ratio of the luminescence level after CsChrimson activation to the baseline luminescence level. The red shaded box indicates the 10 min 627 nm light pulse. The genotypes of each line are shown below and n=16 for each groups. Shading represents SEM. (Right panel) CaLexA-LUC shows a dramatic male-female difference in DN1 activity. Averaged bioluminescence levels of 24 CLK4.1M-GAL4>CaLexA-LUC males (red) and females (gray) are plotted. Shaded background depicts dark periods. b, The real-time CaLexA-LUC assay reveals that warmer temperatures promote DN1 activity in the daytime. Black boxes indicate dark periods, white boxes indicate light periods. Flies were maintained at 21°C and then transferred to 30°C. Shading corresponds to SEM. Bioluminescence (arbitrary units); locomotor activity and daytime sleep profile are plotted (left) and quantified (right). n=15 for each group and ‘**’ indicates p<0.001 by paired t-test. c, Blocking DN1 output abolished warm temperature-induced siesta in females. Sleep traces of control and experimental flies are shown on the left. Blue color indicates data at 21°C, and red color indicates data at 30°C. The box plot on right shows the sleep increase for the different groups. Box boundaries represent the first and third quartiles, whiskers are 1.5 interquartile range. n=32 for each group and error bars represent SEM. The genotype for each groups are labeled bellow. ‘**’ indicates p<0.001 by Kruskall-Wallis non-parametric one-way ANOVA with Dunn’s multiple comparisons test.
Consistent with the difference in siesta between males and females is an equally dramatic difference in the pattern and amplitude of DN1 activity between males and females as assayed with CaLexA-LUC (Fig. 4a). Male activity increases before light on, peaks during the morning and then declines to a trough in the evening. These patterns and their sexual dimorphism are DN1-specific: CaLexA-LUC male and female patterns from other neurons are completely different, e.g., from neurons associated with the ellipsoid body (EB) or the ventral fan shaped body (FB) (data not shown). The much higher morning and mid-day DN1 activity of males likely contributes to their more robust morning anticipation and siesta13,18,19.
To further probe the relationship of DN1 activity to the siesta, we assayed the response of female DN1 activity to temperature with CaLexA-LUC. There is a dramatic increase in luciferase activity in the middle of the day at 30°C compared to 21°C (Fig. 4b top), which coincides with a prominent temperature-mediated increase in the female siesta and decrease in daytime activity (Fig. 4b middle and bottom). CaLexA-LUC expression in other non-circadian neurons displayed reduced overall activity with the same temperature increase (data not shown), indicating that the DN1 temperature-response is specific. To show that DN1 output is necessary for the temperature-dependent siesta increase, we expressed TNT in DN1s and observed little daily sleep increase at 30°C (Fig. 4c). We therefore suggest that temperature enhances DN1 firing, which promotes the siesta. The data taken together indicate that the DN1s promote the siesta and sleep more generally in a clock-, temperature- and sex-dependent manner.
Conclusions
Although DN1s are activated by M cells5,22, our data indicate that there is inhibitory feedback by the DN1s onto M and E cells later in the day to promote the siesta and nighttime sleep (Extended Data Fig. 10c). This feedback at the level of neuronal circuitry parallels and even exploits the transcriptional negative feedback loop that governs intracellular circadian rhythmicity, to time the siesta and maintain a robust sleep-wake activity pattern43,44.
Another group activated the same R18H11-GAL4-labeled DN1s and emphasized the wake-promoting effects of DN1 before dawn13. However, a positive effect on the mid-day siesta as well as inhibition of the subsequent E peak as reported here is also evident in their data (not commented on but in Fig. 4 of13). As there is strong evidence that the DN1 firing rate is maximal around the morning in LD13,21, the strong and unanticipated sleep effects of TNT expression (Fig. 1a) and of channelrhodopsin activation (Fig. 1b) are discordant with the morning peak of these DN1 firing rates. (There is no evidence of heterogeneity in the male DN1 electrophysiological data21, and the CaLexA-LUC activity patterns are weaker but qualitatively similar with the R18H11-GAL4 driver (data not shown)). This discrepancy implicates cycling signaling molecules (e.g., Fig. 3b) in this expansion of the DN1 behavioral repertoire. Moreover, we speculate that the cycling of these same signaling molecules contributes to the delay required for an effective negative feedback circuit (Extended Data Fig. 10c).
The CaLexA assay indicated that DN1 neuronal activity is sexually dimorphic (see below) as well as temperature-sensitive. This second feature parallels the known positive effect of temperature on daytime sleep and may reflect a temperature sensor within DN1s or elsewhere within the brain; the adjacent DN2s are good candidates45. The siesta increase with temperature may also be related to temperature-sensitive splicing of the period (per) gene38,39. per splicing may even occur within DN1s and cause enhanced neuronal activity.
Video monitoring of behavior in a 96-well format is standard in the zebrafish community46, and its value for fly sleep monitoring has been noted elsewhere14,15. Although our video results are generally very similar to the activity and sleep profiles from DAM boards, small movements away from the DAM board infrared beam are only detected by video recording and affect the nighttime sleep results in the TNT experiments (Fig. 1a).
The CaLexA-LUC assay may be superior for many purposes to recording neuronal activity using other methods, for example electrophysiology or calcium imaging. Indeed, our results indicate substantial differences from dissected brains as well as from calcium imaging of tethered flies21,47, suggesting that the wake-behaving format is relevant to circadian neuron firing patterns.
This assay also indicates a dramatic difference between male and female DN1s. To our knowledge, this is the first indication of sexual dimorphism in the fly circadian system. Although we do not know how the CaLexA-LUC signal translates into precise calcium levels or firing rates, the low daytime activity of female DN1s is probably relevant to their relatively weak siesta and morning activity; their high nighttime activity suggests a contribution to female-specific nighttime tasks. We suggest that this CaLexA-LUC assay and our methods more generally will be amenable to the study of other neuronal circuits and behaviors in freely behaving flies and in other organisms.
Method and Materials
Fly strains
DvPdf-GAL4 was provided by Dr. J. H. Park; Clk4.1M-GAL4 was from Dr. Paul Hardin; UAS-dTrpA1 (2nd) was from Dr. Paul Garrity; UAS-CaLexA was from Dr. Jing Wang41; UAS-TNT and UAS-Tet were from Dr. Hubert Amrein; Pdf-GAL80 and CRY-GAL80 are described by Stoleru et al12; LexA-P2X2 and Clk856-GAL4 were from Dr. Orie Shafer11,29. UAS-CD4::spGFP1-10 and LexAop-CD4::spGFP11 were from Dr. Kristin Scott ; Clk4.1M-lexA was from Dr. Amita Sehgal5, LexAop-LUC was generated by Xiaojing Gao and Dr. Liqun Luo48. LexAop-dTrpA1 was from Dr. Gerald M. Rubin. UAS-VGLUT RNAi 1 (VDRC 104324), UAS-mGluRA RNAi 1 (VDRC 103736), UAS-mGluRA RNAi 2 (VDRC 1793) were from the Vienna Drosophila Resource Center (VDRC). The following lines were ordered from the Bloomington Stock Center: Pdfr (R18H11)-GAL4 (48832), Pdfr (R18H11)-LexA (52535), UAS-CsChrimson (55136), UAS-eNPHR3.0 (36350), UAS-Denmark (33064), UAS-ArcLight (51056), UAS-GCaMP6f (42747), UAS-syt-GFP (33064), UAS-VGLUT RNAi 2 (40845, 40927), VGlutMI04979-GAL4 (60312). Flies were reared on standard cornmeal/agar medium supplemented with yeast. The adult flies were entrained in 12:12 light-dark (LD) cycles at 25°C. The flies carrying GAL4 and UAS-dTrpA1 were maintained at 21°C to inhibit dTrpA1 activity.
Locomotor activity
Locomotor activity of individual male flies (aged 3–7 days) was measured with Trikinetics Drosophila Activity Monitors (Waltham, MA) or video recording system under 12:12 LD conditions. The activity and sleep analysis was performed with a signal-processing toolbox implemented in MATLAB (MathWorks, Natick, MA). Group activity was also generated and analyzed with MATLAB. For dTrpA1-induced neuronal firing experiments (Fig. 3 and S9), flies were entrained in LD for 3–4 days at 21°C, transferred to 27°C for two days, followed by 2 subsequent days at 21°C. The evening activity index (Extended Data Fig. 9) was calculated by dividing the average activity from ZT8–12 by the average activity from ZT0–12. The behavior experiments involving RNAi expression (Extended Data Fig. 10b) were done at 27°C to enhance knockdown efficiency.
Statistical analyses
All statistical analyses were conducted using IBM SPSS software. The sample size was chosen based on the pilot studies to ensure >80% statistical power to detect significant difference between different groups. Animals within the same genotype were randomly allocated to experimental groups and then processed. We were not blind to the group allocation since the experimental design required specific genotypes for experimental and control groups. However, the data analyzer was blinded when assessing the outcome. The Wilks-Shapiro test was used to determine normality of data. Normally distributed data were analyzed with 2-tailed, unpaired Student’s t-tests, one way analysis of variance (ANOVA) followed by a Tukey-Kramer HSD Test as the post hoc test or two-way analysis of variance (ANOVA) with post-hoc Bonferroni multiple comparisons. Nonparametrically distributed data were assessed using the Kruskal-Wallis test. Data were presented as mean behavioral responses, and error bars represent the standard error of the mean (SEM). Differences between groups were considered significant if the probability of error was less than 0.05 (P < 0.05). Experiments were repeated at least 3 times and representative data was shown in figures.
Arousal thresholds assay
For mechanical stimulation, individual flies from different groups were loaded into 96-well plates and placed close to a small push-pull solenoid. The tap frequency of the solenoid was directly driven by an Arduino UNO board (Smart Projects, Italy). 1 tap was used as a modest stimulus and 10 taps (1 Hz) was used as a strong stimulus. Arousal threshold was measured during the middle of the day (ZT6) and evening (ZT10) with different intensities. The movement of flies before and after the stimulus was monitored by the web camera and the recording videos (1fps) were processed by the MTrack2 plugin in Fiji ImageJ software to convert the videos into binary images and to calculate the trajectory and moving area as well as the percentage of aroused flies.
Feeding of retinal
All trans-retinal powder (Sigma) was dissolved in alcohol to prepare a 100 mM stock solution for CsChrimson experiments23. 100 μl of this stock solution was diluted in 25 ml of 5% sucrose and 1% agar medium to prepare 400 μM of all trans-retinal (ATR) food. Newly eclosed flies were transferred to ATR food for at least 2 days prior to optogenetic experiments.
Optogenetics and video recording system
The behavioral setup for the optogenetics and video recording system is schematized in Figure S1. Briefly, flies were loaded into white 96-well Microfluor 2 plates (Fisher) containing 5% sucrose and 1% agar food with or without 400 μM ATR. Back lighting for night vision was supplied by an 850 nm LED board (LUXEON) located under the plate. Two sets of high power LEDs (627 nm) mounted on heat sinks (4 LEDs per heat sink) were symmetrically placed above the plate to provide light stimulation. The angle and height of the LEDs were adjusted to ensure uniform illumination. The voltage and frequency of red light pulses were controlled by an Arduino UNO board (Smart Projects, Italy). The whole circuit is described in25. The flat surface and compact wells of the 96-well plate allow uniform illumination, which was difficult to achieve in Trikinetics tubes. We used 627 nm red light pulses at 10Hz (0.08mW/mm2) to irradiate flies expressing the red-shifted channelrhodopsin CsChrimson within the DN1s23. (The CsChrimson illumination protocol had no effect on halorhodopsin eNpHR3.0). Fly behavior was recorded by a web camera (Logistic C910) without an IR filter. We used time-lapse software to capture snapshots at 10 second intervals. The LD cycle and temperature was controlled by the incubator, and the light intensity was maintained in a region that allowed entrainment of flies without activating CsChrimson. Fly movement was calculated by Pysolo software and transformed into a MATLAB readable file14. 5 pixels per second (50% of the Full Body Length) was defined as a minimum movement threshold15,16. The activity and sleep analyses were performed with a signal-processing toolbox implemented in MATLAB (MathWorks) as described above. The design of the invention has been filed for patent.
In vivo luciferase assays
To monitor bioluminescence activity in living flies, we used previously described protocols49. White 96-well Microfluor 2 plates (Fisher) were loaded with 5% sucrose and 1% agar food containing 20 mM D-luciferin potassium salt (GOLDBIO). 250 μl of food was added to each well. Individual male or female flies expressing CaLexA-LUC were first anaesthetized with CO2 and then transferred to the wells. We used an adhesive transparent seal (TopSeal-A PLUS, Perkin Elmer) to cover the plate and poked 2–3 holes in the seal over each well for air exchange. Plates were loaded into the stacker of a TopCount NXT luminescence counter (Perkin Elmer). Assays were carried out in an incubator under light:dark conditions. Luminescence counts were collected for 5–7 days. For temperature shift experiments (Fig. 4b), the incubator temperature was set to 21°C for 3 days and then increased to 30°C at ZT 0 of the 4th day. Other experiments were performed at 25°C. Three different modes were used in our experiments: (a) To record CaLexA-LUC activity only, 9 plates were placed in a stacker, and each plate was sequentially transferred to the TopCount machine for luminescence reading. Every cycle took about 1 hour, and the recording was continued for several days. (b) To combine optogenetic stimulation with the luciferase assays (Fig. 4a and Extended Data Fig. 6a), we replaced the stacker with a chamber of our own design (Fig. 4a). 627 nm LEDs mounted to a pair of heat sinks were symmetrically positioned in the chamber to ensure uniform illumination of the 96-well plate (0.08 mW/mm2 for CsChrimson stimulation and 1mW/mm2 for eNPHR3.0 stimulation). Flies pre-fed with ATR were loaded into a plate. Single plates stayed in the LED chamber for 8 min and then automatically transferred to the TopCount for luminescence reading for 2 min. (c) To assay fly movement in 96-well plates and CaLexA-LUC activity at the same time, single plates were recorded using a web camera attached to the top of chamber (Fig. 4a). During each hour, the plate sat in the video chamber for 58 min and then was automatically transferred to the TopCount machine for a 2 min luminescence reading. The raw data were analyzed in MATLAB and in Microsoft Excel. All experiments were repeated at least three times.
Fly brain immunocytochemistry
Immunostaining was performed as described50. Fly heads were removed and fixed in PBS with 4% paraformaldehyde and 0.008% Triton X-100 for 45–50 min at 4°C. Fixed heads were washed in PBS with 0.5% Triton X-100 and dissected in PBS. The brains were blocked in 10% goat serum (Jackson Immunoresearch, West Grove, PA) and subsequently incubated with primary antibodies at 4°C overnight or longer. For VGLUT and GFP co-staining, a rabbit anti-DVGlut (1:10000) and a mouse anti-GFP antibody (Invitrogen; 1:1000) antibody were used as primary antibodies. For GRASP staining, a mouse anti-GFP monoclonal antibody (Invitrogen; 1:1000) and a rabbit anti-GFP antibody (Roche; 1:200) were used. After washing with 0.5% PBST three times, the brains were incubated with Alexa Fluor 633 conjugated anti-rabbit and Alexa Fluor 488 conjugated anti-mouse (Molecular Probes, Carlsbad, CA) at 1:500 dilution. The brains were washed three more times before being mounted in Vectashield Mounting Medium (Vector Laboratories, Burlingame, CA) and viewed sequentially in 1.1 μm sections on a Leica SP5 confocal microscope. To compare the fluorescence signals from different conditions, the laser intensity and other settings were set at the same level during each experiment. Fluorescence signals were quantified by ImageJ as described.
mRNA profiling from E cells and DN1s
mRNA profiling from E cells and DN1s was performed as previously described34. DN1s and E cells were purified from Clk4.1M-GAL4, UAS-EGFP flies (DN1s) and Dv-Pdf-GAL4, UAS-EGFP, PDF-RFP flies, (E cells; GFP+RFP− cells), respectively. Flies were entrained for 3 days and then collected every 4 hours for a total of 6 time points. 2 replicates of 6 time points were performed for each cell type. Sequencing data were aligned to the Drosophila genome using TopHat51. Gene expression was quantified using the End Sequencing Analysis Toolkit (ESAT; publicly available at http://garberlab.umassmed.edu/software/esat/). ESAT quantifies gene expression only using information from the 3′-end of the genes.
Functional fluorescence imaging
Imaging experiments were performed as previous described52. Adult male fly brains were dissected in ice-cold hemolymph-like saline (AHL) (108 mM NaCl, 5 mM KCl, 2 mM CaCl2, 8.2 mM MgCl2, 4 mM NaHCO3, 1 mM NaH2PO4-H2O, 5 mM trehalose, 10 mM sucrose, 5 mM HEPES; pH 7.5). Brain were then pinned to a layer of Sylgard (Dow Corning, Midland, MI) silicone under a small bath of AHL contained within a recording/perfusion chamber (Warner Instruments, Hamden, CT) and bathed with room temperature AHL. Brains expressing GCaMP6f and Arclight were exposed to fluorescent light for approximately 30 s before imaging to allow for baseline fluorescence stabilization. Perfusion flow was established over the brain with a gravity-fed ValveLink perfusion system (Automate Scientific, Berkeley, CA). ATP or glutamate was delivered by switching the perfusion flow from the main AHL line to another channel containing diluted compound after 30 s of baseline recording for the desired durations followed by a return to AHL flow. For the mGluRA antagonist imaging experiments, 700 nM LY341495 (Tocris Bioscience) was used to block the glutamate-induced inhibition. Imaging was performed using an Olympus BX51WI fluorescence microscope (Olympus, Center Valley, PA) under an Olympus x40 (0.80W, LUMPlanFl) or x60 (0.90W, LUMPlanFI) water-immersion objective, and all recordings were captured using a charge-coupled device camera (Hamamatsu ORCA C472-80-12AG). For GCaMP6f and Arclight imaging, the following filter sets were used (Chroma Technology, Bellows Falls, VT): excitation, HQ470/x40; dichroic, Q495LP; emission, HQ525/50m. Frames were captured at 2 Hz with 4× binning for either 2 min or 4 min using μManager acquisition software (Edelstein et al., 2010). Neutral density filters (Chroma Technology) were used for all experiments to reduce light intensity and to limit photobleaching.
For recordings using GCaMP6f and Arclight, ROIs were analyzed using custom software developed in ImageJ (Schindelin et al., 2012 and National Institute of Health, Bethesda, MD). The fluorescence change was calculated by using the formula: ΔF/F = (Fn − F0)/F0 × 100%, where Fn is the fluorescence at time point n, and F0 is the fluorescence at time 0. The fluorescence was calibrated by subtracting the background fluorescence value. To compare the fluorescence change between neurons in the same brain, fluorescence activities from different neurons were normalized to the highest fluorescence level during the recording time window.
Extended Data
Extended Data Figure 1. Schematics of video recording and optogenetic strategies.
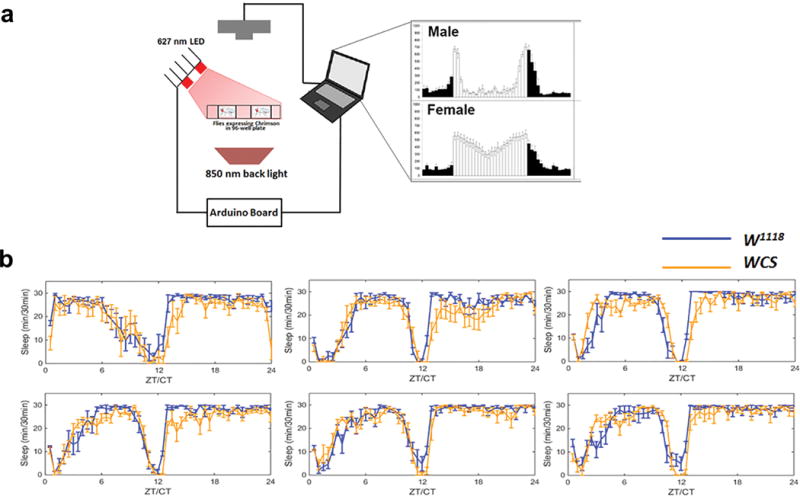
a, Flies expressing CsChrimson were placed in 96-well plates and video recorded with a camera without an infrared filter (left panel). An 850 nm infrared back light provides illumination for recording in both light and dark periods. A set of 627 nm LEDs was carefully positioned and combined with a diffuser to ensure uniform irradiation for stimulation. The voltage and pulse frequency were controlled by an Arduino UNO board as described in Materials and Methods. Representative data from a video recording of male and female activity (right panel) in LD are shown. b, Sleep data of two control genotypes in 96-well plate mode for several days. Error bars correspond to SEM. n=15–16 for each group.
Extended Data Figure 2. The R18H11 driver labels a subgroup of CLK4.1M-defined DN1s.
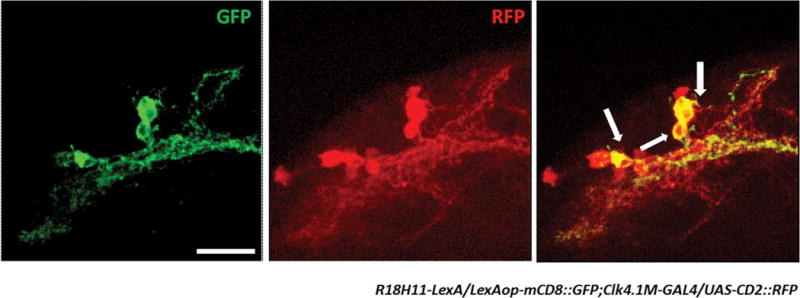
Confocal stack of images showing antibody staining for GFP (left) and RFP (middle) and the overlay (right) in the dorsal brain of R18H11-LexA/LexAop-mCD8::GFP;Clk4.1M-GAL4/UAS-rCD2::RFP flies. Scale bar=20 μm.
Extended Data Figure 3. Blocking neurotransmitter output of DN1s affects sleep parameters but not DD rhythmicity.
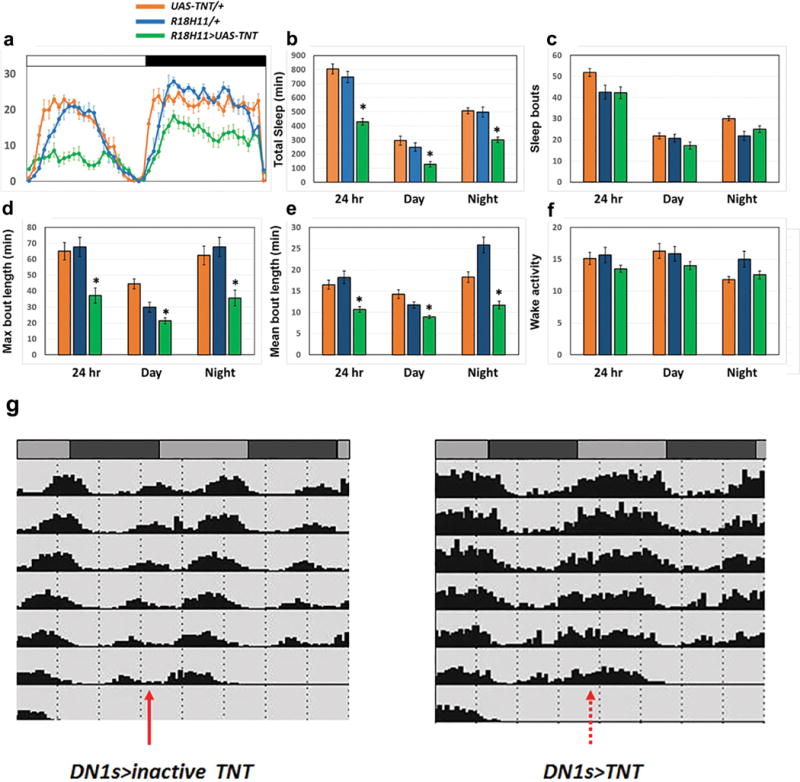
Total sleep, maximum sleep bout duration and mean sleep bout duration of control groups (R18H11-GAL4/+, UAS-TNT/+) and the experimental group (R18H11-GAL4/UAS-TNT) have significant difference. Error bars correspond to SEM. n=32 for each group. One-way ANOVA detected significant genotype effects for (a–b) total sleep (p<0.0001), daytime sleep (p<0.0001), nighttime sleep (p<0.0001), (d) max bout duration (p=0.00288), max daytime bout duration (p<0.0001), max nighttime bout duration (p=0.000388), (e) mean bout duration (p<0.0001), mean daytime bout duration (p<0.0001), mean nighttime bout duration (p<0.0001). Asterisks denote significant differences from parental controls in Tukey’s post-hoc test (p<0.01). g,Neurotransmitter release from DN1s is not required for DD rhythmicity. Locomotor behavior of control (Clk4.1M-GAL4/UAS-Tet) and experimental (Clk4.1M-GAL4/UAS-TNT) male flies was monitored for 6 days in DD. Both control (left panel) and experimental (right panel) flies maintained strong rhythmicity. Note that the experimental group showed much less siesta (dashed red arrow-right panel) than the control group (solid red arrow-left panel).
Extended Data Figure 4. Co-expression of CRY-GAL80 or TNT blocks the sleep-promoting effect of DN1 activation.
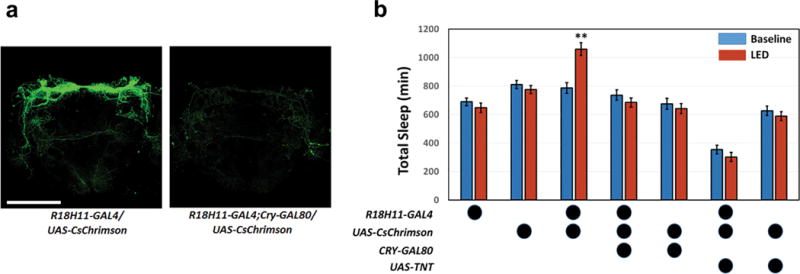
a, R18H11-GAL4/UAS-CsChrimson (left panel) and R18H11-GAL4, CRY-GAL80/UAS-CsChrimson (right panel) brains were dissected and stained with anti-GFP (green). Scale bar=100 μm. b, Comparison of total sleep in the baseline day (blue) to total sleep during a 24 hour LED stimulation day (red) for each genotype. n=32 for R18H11-GAL4/UAS-CsChrimson group and n=24 for the other groups. Error bars represent SEM. ‘**’ indicates p<0.001 by post-hoc Bonferonni multiple comparisons. Two-way ANOVA detected a significant LED stimulation effect (p=0.00227674), a genotype effect (p<0.0001) and interaction (p<0.0001).
Extended Data Figure 5. Arousal threshold is affected by manipulation of DN1 activity.
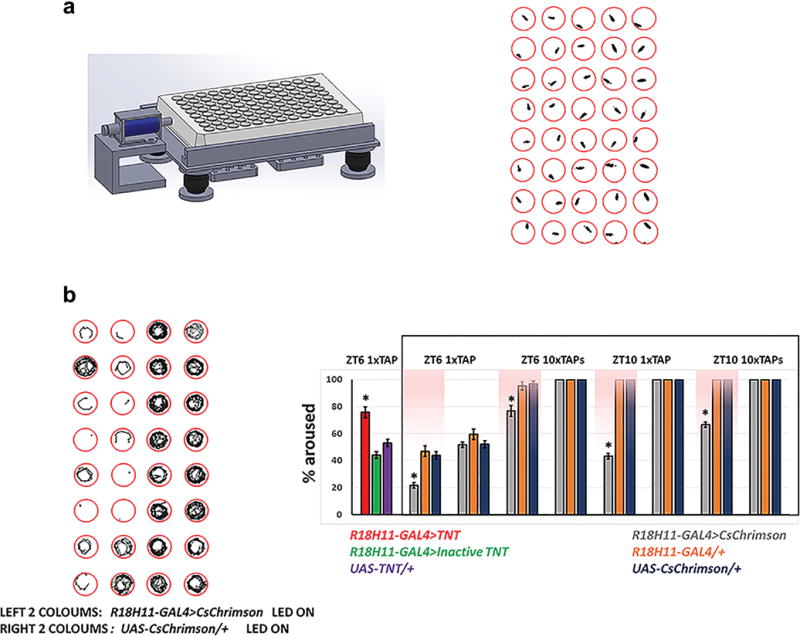
a, Mechanical stimulation setup for measuring arousal threshold. The set-up is illustrated on the left. A 96-well plate is loaded onto the device and a small Push-Pull solenoid is positioned on the side of the plate. The solenoid can be programed to tap the plate at different frequencies and times. A web camera monitors fly movement in the wells, and the video is analyzed with Fiji ImageJ software to track flies. An example image is shown on the right. b, Activation of DN1s increases arousal threshold. The left panel shows trajectories (5 min traces) of experimental and control flies after a strong (10 tap) stimulus at ZT6 when the LED is on. The right panel shows the percentages of flies for the indicated genotypes that transitioned from immobility to an active state in response to the stimulus. The pink background indicates LED stimulation. n=16–24 for each group. Error bars represent SEM. One-way ANOVA detected significant genotype effects for arousal levels of R18H11>CsChrimson LED group (p<0.0001) and R18H11>TNT group (p<0.0001), Asterisks denote significant differences from parental controls in Tukey’s post-hoc test (p<0.01).
Extended Data Figure 6. eNPHR3.0 blocks DN1 neuronal activity and decreases the siesta.
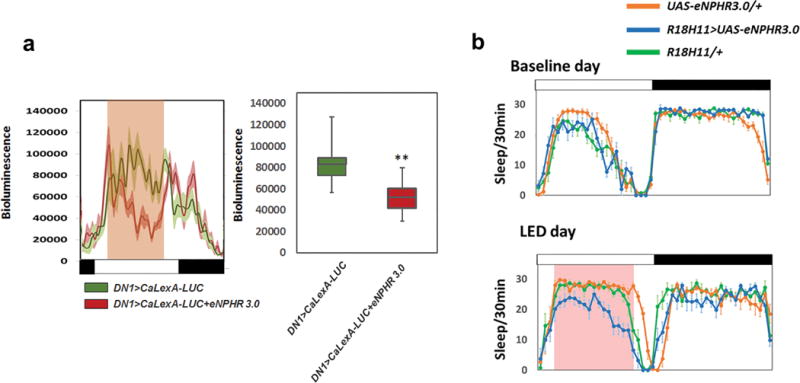
a, The luminescence traces from the CaLexA-LUC sensor reflect neuronal activity after LED-induced eNPHR3.0 inhibition from ZT 2.5 to ZT 9.5. The mean LUC activity level (arbitrary units) from control and experimental groups is quantified on the right. b, Sleep from a baseline day and from a LED stimulation day of R18H11>UAS-eNPHR3.0, UAS-eNPHR3.0/+ and R18H11/+ flies. Pink background represents LED stimulation. n=16 for each group. Error bars represent SEM.
Extended Data Figure 7. The dendritic region of E cells overlaps with the presynaptic region of DN1s.

Clk4.1M-GAL4>UAS-synaptotagmin-GFP brains were dissected and stained with anti-GFP to identify the DN1 presynaptic regions (green; left panel). To identify the dendritic regions of E cells and M cells, DvPdf-GAL4>UAS-Denmark brains were dissected and stained with anti-DsRed (red; middle panel). These patterns were aligned and overlaid (merged panel on the right).
Extended Data Figure 8. Glutamate reduces calcium levels in PDF neurons and hyperpolarizes their membrane potential.
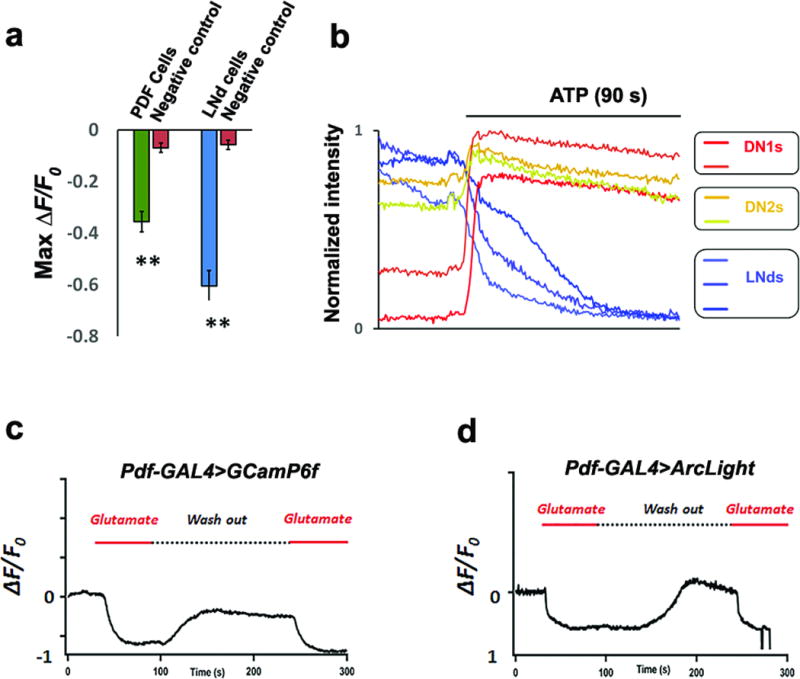
a, Quantification of peak GCaMP6f changes in Figure. 2c. Panel shows average maximum changes for LNvs and LNds. n=8 for control group; n=7 for PDF cells and n=11 for LNds. ‘**’ indicates p<0.001 by unpaired two-tailed Student’s t-test and error bars correspond to SEM. b, Normalized calcium traces in different circadian neuron subgroups imaged concurrently in same brain, Panels show representative data of 5 brains. c–d, 5 mM glutamate was applied to exposed dissected fly brains (Pdf-GAL4>GCaMP6f, c and Pdf-GAL4>Arclight, d) and induced a calcium decrease and hyperpolarized these core pacemakers (ΔF/F represents the evoked fluorescence change from baseline). The red solid line indicates time of glutamate application. The dashed line indicates time of vehicle application. Panels show representative data of 6 brains.
Extended Data Figure 9. Decreasing DN1 VGLUT levels blocks the E peak reduction caused by DN1 firing.
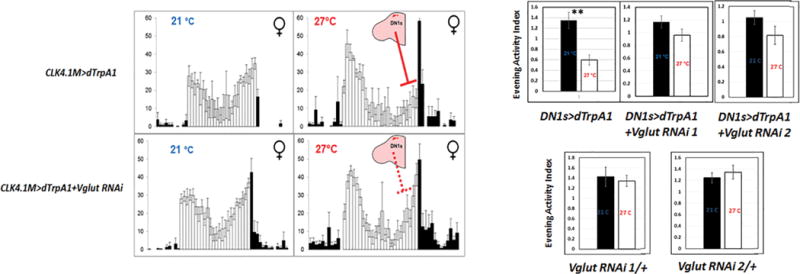
Reducing Vglut activity within the DN1s decreases the DN1-activation effect (left). The locomotor activity patterns of UAS-dTrpA1/+; CLK4.1M-GAL4/+ female flies (upper panel) and UAS-dTrpA1/+; CLK4.1M-GAL4/UAS-Vglut RNAi female flies (lower panel) at 21 °C and 27 °C are shown. The color of the bars indicates either daytime (white) or nighttime (black). Evening Activity Index was calculated as described in Materials and Methods for the indicated genotypes (right). White and black bars represent data from low and high temperature respectively. ‘**’ indicates p<0.001 by unpaired two-tailed student’s t-test. n=24 for each groups. Error bars represent SEM.
Extended Data Figure 10. Reducing mGluRA expression in pacemaker neurons reduces the inhibitory effect of glutamate as well as the siesta.
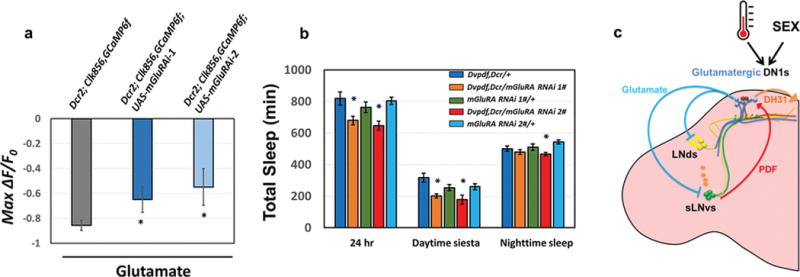
a, The peak decrease of GCaMP6f in circadian cells after applying glutamate to control and mGluRA knockdown flies. The genotypes are shown above the bars. n=6 for UAS-Dcr2; Clk856-GAL4, UAS-GCaMP6f and n=8–9 for UAS-Dcr2; Clk856-GAL4, UAS-GCaMP6f; UAS-mGluRA RNAi groups. ‘*’ indicates p<0.05 by unpaired t-test. Error bars represent SEM. b, Comparison of total sleep, daytime siesta and nighttime sleep in different genotypes. n=32 for each group. ‘*’ indicates p<0.05 by one-way ANOVA with Tukey’s post-hoc test. Error bars represent SEM. c, A temporally constrained negative feedback core pacemaker-DN1 circuit regulates the fly activity/sleep pattern. Early in the day, M pacemaker neurons activate the DN1s via the PDF neuropeptide, and DN1s release DH31 to enhance morning arousal. Later in the day, glutamate release from DN1s inhibits M cells and E cells, promotes the siesta, decreases the evening activity peak and initiates nighttime sleep. A cycling mRNA that encodes inhibitory glutamate receptors in pacemaker cells may help direct this inhibition to the late day. This feedback circadian circuit shapes the bimodal locomotor activity peak and sleep/wake cycles under normal conditions. The higher daily neuronal activity in male DN1s compared to female DN1s promotes the sexually dimorphic activity/sleep pattern. DN1s also integrate environmental information such as temperature to promote sleep plasticity.
Supplementary Material
Acknowledgments
We thank Madelen Diaz, Nhi Nguyen, Ryanne Spann and Kimberly Kerr for generous help, and Xiaojing Gao and Dr. Liqun Luo for sending us LexAop-Luciferase flies, and Dr. Orie Shafer and Dr. Amita Sehgal for helpful discussion and comments on early versions of this manuscript. This work was supported in part by NIH R01 MH067284 (LCG).
Footnotes
Author contributions
F.G. and M.R. conceived and designed the experiments. F.G. performed behavioral experiments. F.G. and J.Y. performed immunocytochemistry and imaging experiments. F.G. and H.J.J. setup the recording system. K.C.A, and W.L. performed and quantified the mRNA profiling data. F.G. and J.Y. analyzed data. F.G., L.G. and M.R. prepared the figures and wrote the paper, with feedback from all authors.
Conflict of Interest
There is no conflict of interest in this paper.
References
- 1.Reppert SM, Weaver DR. Coordination of circadian timing in mammals. Nature. 2002;418:935–941. doi: 10.1038/nature00965. doi:10.1038/nature00965 nature00965 [pii] [DOI] [PubMed] [Google Scholar]
- 2.Moore RY. Organization and function of a central nervous system circadian oscillator: the suprachiasmatic hypothalamic nucleus. Fed Proc. 1983;42:2783–2789. [PubMed] [Google Scholar]
- 3.Rieger D, Shafer OT, Tomioka K, Helfrich-Forster C. Functional analysis of circadian pacemaker neurons in Drosophila melanogaster. J Neurosci. 2006;26:2531–2543. doi: 10.1523/JNEUROSCI.1234-05.2006. doi:26/9/2531 [pii] 10.1523/JNEUROSCI.1234-05.2006. [DOI] [PMC free article] [PubMed] [Google Scholar]
- 4.Shang Y, Griffith LC, Rosbash M. Light-arousal and circadian photoreception circuits intersect at the large PDF cells of the Drosophila brain. Proc Natl Acad Sci U S A. 2008;105:19587–19594. doi: 10.1073/pnas.0809577105. doi:10.1073/pnas.0809577105 0809577105 [pii] [DOI] [PMC free article] [PubMed] [Google Scholar]
- 5.Cavanaugh DJ, et al. Identification of a circadian output circuit for rest:activity rhythms in Drosophila. Cell. 2014;157:689–701. doi: 10.1016/j.cell.2014.02.024. [DOI] [PMC free article] [PubMed] [Google Scholar]
- 6.Agosto J, et al. Modulation of GABA(A) receptor desensitization uncouples sleep onset and maintenance in Drosophila. Nat Neurosci. 2008;11:354–359. doi: 10.1038/nn2046. [DOI] [PMC free article] [PubMed] [Google Scholar]
- 7.Tataroglu O, Emery P. Studying circadian rhythms in Drosophila melanogaster. Methods. 2014;68:140–150. doi: 10.1016/j.ymeth.2014.01.001. doi:10.1016/j.ymeth.2014.01.001 S1046-2023(14)00002-4 [pii] [DOI] [PMC free article] [PubMed] [Google Scholar]
- 8.Renn SC, Park JH, Rosbash M, Hall JC, Taghert PH. A pdf neuropeptide gene mutation and ablation of PDF neurons each cause severe abnormalities of behavioral circadian rhythms in Drosophila. Cell. 1999;99:791–802. doi: 10.1016/s0092-8674(00)81676-1. doi:S0092-8674(00)81676-1 [pii] [DOI] [PubMed] [Google Scholar]
- 9.Grima B, Chelot E, Xia R, Rouyer F. Morning and evening peaks of activity rely on different clock neurons of the Drosophila brain. Nature. 2004;431:869–873. doi: 10.1038/nature02935. [DOI] [PubMed] [Google Scholar]
- 10.Guo F, Cerullo I, Chen X, Rosbash M. PDF neuron firing phase-shifts key circadian activity neurons in Drosophila. Elife. 2014;3 doi: 10.7554/eLife.02780. [DOI] [PMC free article] [PubMed] [Google Scholar]
- 11.Yao Z, Shafer OT. The Drosophila circadian clock is a variably coupled network of multiple peptidergic units. Science. 2014;343:1516–1520. doi: 10.1126/science.1251285. doi:10.1126/science.1251285 343/6178/1516 [pii] [DOI] [PMC free article] [PubMed] [Google Scholar]
- 12.Stoleru D, Peng Y, Agosto J, Rosbash M. Coupled oscillators control morning and evening locomotor behaviour of Drosophila. Nature. 2004;431:862–868. doi: 10.1038/nature02926. [DOI] [PubMed] [Google Scholar]
- 13.Kunst M, et al. Calcitonin gene-related peptide neurons mediate sleep-specific circadian output in Drosophila. Curr Biol. 2014;24:2652–2664. doi: 10.1016/j.cub.2014.09.077. doi:10.1016/j.cub.2014.09.077 S0960-9822(14)01273-1 [pii] [DOI] [PMC free article] [PubMed] [Google Scholar]
- 14.Gilestro GF, Cirelli C. pySolo: a complete suite for sleep analysis in Drosophila. Bioinformatics. 2009;25:1466–1467. doi: 10.1093/bioinformatics/btp237. doi:10.1093/bioinformatics/btp237 btp237 [pii] [DOI] [PMC free article] [PubMed] [Google Scholar]
- 15.Donelson NC, et al. High-resolution positional tracking for long-term analysis of Drosophila sleep and locomotion using the “tracker” program. PloS one. 2012;7:e37250. doi: 10.1371/journal.pone.0037250. [DOI] [PMC free article] [PubMed] [Google Scholar]
- 16.Garbe DS, et al. Context-specific comparison of sleep acquisition systems in Drosophila. Biol Open. 2015;4:1558–1568. doi: 10.1242/bio.013011. [DOI] [PMC free article] [PubMed] [Google Scholar]
- 17.Pfeiffer BD, et al. Tools for neuroanatomy and neurogenetics in Drosophila. Proc Natl Acad Sci U S A. 2008;105:9715–9720. doi: 10.1073/pnas.0803697105. doi:10.1073/pnas.0803697105 0803697105 [pii] [DOI] [PMC free article] [PubMed] [Google Scholar]
- 18.Zhang L, et al. DN1(p) circadian neurons coordinate acute light and PDF inputs to produce robust daily behavior in Drosophila. Curr Biol. 2010;20:591–599. doi: 10.1016/j.cub.2010.02.056. doi:10.1016/j.cub.2010.02.056 S0960-9822(10)00326-X [pii] [DOI] [PMC free article] [PubMed] [Google Scholar]
- 19.Zhang Y, Liu Y, Bilodeau-Wentworth D, Hardin PE, Emery P. Light and temperature control the contribution of specific DN1 neurons to Drosophila circadian behavior. Curr Biol. 2010;20:600–605. doi: 10.1016/j.cub.2010.02.044. doi:10.1016/j.cub.2010.02.044 S0960-9822(10)00232-0 [pii] [DOI] [PMC free article] [PubMed] [Google Scholar]
- 20.Jenett A, et al. A GAL4-driver line resource for Drosophila neurobiology. Cell Rep. 2012;2:991–1001. doi: 10.1016/j.celrep.2012.09.011. doi:10.1016/j.celrep.2012.09.011 S2211-1247(12)00292-6 [pii] [DOI] [PMC free article] [PubMed] [Google Scholar]
- 21.Flourakis M, et al. A Conserved Bicycle Model for Circadian Clock Control of Membrane Excitability. Cell. 2015;162:836–848. doi: 10.1016/j.cell.2015.07.036. [DOI] [PMC free article] [PubMed] [Google Scholar]
- 22.Seluzicki A, et al. Dual PDF signaling pathways reset clocks via TIMELESS and acutely excite target neurons to control circadian behavior. PLoS Biol. 2014;12:e1001810. doi: 10.1371/journal.pbio.1001810. doi:10.1371/journal.pbio.1001810 PBIOLOGY-D-13-03070 [pii] [DOI] [PMC free article] [PubMed] [Google Scholar]
- 23.Klapoetke NC, et al. Independent optical excitation of distinct neural populations. Nat Methods. 2014;11:338–346. doi: 10.1038/nmeth.2836. doi:10.1038/nmeth.2836 nmeth.2836 [pii] [DOI] [PMC free article] [PubMed] [Google Scholar]
- 24.Aso Y, et al. Mushroom body output neurons encode valence and guide memory-based action selection in Drosophila. Elife. 2014;4:e04580. doi: 10.7554/eLife.04580. [DOI] [PMC free article] [PubMed] [Google Scholar]
- 25.Inagaki HK, et al. Optogenetic control of Drosophila using a red-shifted channelrhodopsin reveals experience-dependent influences on courtship. Nat Methods. 2014;11:325–332. doi: 10.1038/nmeth.2765. doi:10.1038/nmeth.2765 nmeth.2765 [pii] [DOI] [PMC free article] [PubMed] [Google Scholar]
- 26.Gradinaru V. Molecular and cellular approaches for diversifying and extending optogenetics. Cell. 2010;141:154–165. doi: 10.1016/j.cell.2010.02.037. doi:10.1016/j.cell.2010.02.037 S0092-8674(10)00190-X [pii] [DOI] [PMC free article] [PubMed] [Google Scholar]
- 27.Rieger D, et al. The fruit fly Drosophila melanogaster favors dim light and times its activity peaks to early dawn and late dusk. Journal of biological rhythms. 2007;22:387–399. doi: 10.1177/0748730407306198. [DOI] [PubMed] [Google Scholar]
- 28.Feinberg EH, et al. GFP Reconstitution Across Synaptic Partners (GRASP) defines cell contacts and synapses in living nervous systems. Neuron. 2008;57:353–363. doi: 10.1016/j.neuron.2007.11.030. doi:10.1016/j.neuron.2007.11.030 S0896-6273(07)01020-3 [pii] [DOI] [PubMed] [Google Scholar]
- 29.Yao Z, Macara AM, Lelito KR, Minosyan TY, Shafer OT. Analysis of functional neuronal connectivity in the Drosophila brain. Journal of neurophysiology. 2012;108:684–696. doi: 10.1152/jn.00110.2012. [DOI] [PMC free article] [PubMed] [Google Scholar]
- 30.Chen TW, et al. Ultrasensitive fluorescent proteins for imaging neuronal activity. Nature. 2013;499:295–300. doi: 10.1038/nature12354. [DOI] [PMC free article] [PubMed] [Google Scholar]
- 31.Hamasaka Y, et al. Glutamate and its metabotropic receptor in Drosophila clock neuron circuits. J Comp Neurol. 2007;505:32–45. doi: 10.1002/cne.21471. [DOI] [PubMed] [Google Scholar]
- 32.Diao F, et al. Plug-and-play genetic access to drosophila cell types using exchangeable exon cassettes. Cell Rep. 2015;10:1410–1421. doi: 10.1016/j.celrep.2015.01.059. [DOI] [PMC free article] [PubMed] [Google Scholar]
- 33.Liu WW, Wilson RI. Glutamate is an inhibitory neurotransmitter in the Drosophila olfactory system. Proc Natl Acad Sci U S A. 2013;110:10294–10299. doi: 10.1073/pnas.1220560110. doi:10.1073/pnas.1220560110 1220560110 [pii] [DOI] [PMC free article] [PubMed] [Google Scholar]
- 34.Abruzzi K, Chen X, Nagoshi E, Zadina A, Rosbash M. RNA-seq Profiling of Small Numbers of Drosophila Neurons. Methods Enzymol. 2015;551:369–386. doi: 10.1016/bs.mie.2014.10.025. doi:10.1016/bs.mie.2014.10.025 S0076-6879(14)00026-3 [pii] [DOI] [PubMed] [Google Scholar]
- 35.Collins B, et al. Differentially timed extracellular signals synchronize pacemaker neuron clocks. PLoS Biol. 2014;12:e1001959. doi: 10.1371/journal.pbio.1001959. doi:10.1371/journal.pbio.1001959 PBIOLOGY-D-14-00727 [pii] [DOI] [PMC free article] [PubMed] [Google Scholar]
- 36.Collins B, Kane EA, Reeves DC, Akabas MH, Blau J. Balance of activity between LN(v)s and glutamatergic dorsal clock neurons promotes robust circadian rhythms in Drosophila. Neuron. 2012;74:706–718. doi: 10.1016/j.neuron.2012.02.034. doi:10.1016/j.neuron.2012.02.034 S0896-6273(12)00279-6 [pii] [DOI] [PMC free article] [PubMed] [Google Scholar]
- 37.Helfrich-Forster C. Differential control of morning and evening components in the activity rhythm of Drosophila melanogaster–sex-specific differences suggest a different quality of activity. Journal of biological rhythms. 2000;15:135–154. doi: 10.1177/074873040001500208. [DOI] [PubMed] [Google Scholar]
- 38.Low KH, Lim C, Ko HW, Edery I. Natural variation in the splice site strength of a clock gene and species-specific thermal adaptation. Neuron. 2008;60:1054–1067. doi: 10.1016/j.neuron.2008.10.048. doi:S0896-6273(08)00948-3 [pii] 10.1016/j.neuron.2008.10.048. [DOI] [PMC free article] [PubMed] [Google Scholar]
- 39.Cao W, Edery I. A novel pathway for sensory-mediated arousal involves splicing of an intron in the period clock gene. Sleep. 2015;38:41–51. doi: 10.5665/sleep.4322. [DOI] [PMC free article] [PubMed] [Google Scholar]
- 40.Majercak J, Sidote D, Hardin PE, Edery I. How a circadian clock adapts to seasonal decreases in temperature and day length. Neuron. 1999;24:219–230. doi: 10.1016/s0896-6273(00)80834-x. doi:S0896-6273(00)80834-X [pii] [DOI] [PubMed] [Google Scholar]
- 41.Masuyama K, Zhang Y, Rao Y, Wang JW. Mapping neural circuits with activity-dependent nuclear import of a transcription factor. J Neurogenet. 2012;26:89–102. doi: 10.3109/01677063.2011.642910. [DOI] [PMC free article] [PubMed] [Google Scholar]
- 42.Stanewsky R, et al. The cryb mutation identifies cryptochrome as a circadian photoreceptor in Drosophila. Cell. 1998;95:681–692. doi: 10.1016/s0092-8674(00)81638-4. doi:S0092-8674(00)81638-4 [pii] [DOI] [PubMed] [Google Scholar]
- 43.Hardin PE, Hall JC, Rosbash M. Circadian oscillations in period gene mRNA levels are transcriptionally regulated. Proc Natl Acad Sci U S A. 1992;89:11711–11715. doi: 10.1073/pnas.89.24.11711. [DOI] [PMC free article] [PubMed] [Google Scholar]
- 44.Benito J, Zheng H, Ng FS, Hardin PE. Transcriptional feedback loop regulation, function, and ontogeny in Drosophila. Cold Spring Harb Symp Quant Biol. 2007;72:437–444. doi: 10.1101/sqb.2007.72.009. [DOI] [PMC free article] [PubMed] [Google Scholar]
- 45.Picot M, Klarsfeld A, Chelot E, Malpel S, Rouyer F. A role for blind DN2 clock neurons in temperature entrainment of the Drosophila larval brain. J Neurosci. 2009;29:8312–8320. doi: 10.1523/JNEUROSCI.0279-08.2009. doi:29/26/8312 [pii] 10.1523/JNEUROSCI.0279-08.2009. [DOI] [PMC free article] [PubMed] [Google Scholar]
- 46.Prober DA, Rihel J, Onah AA, Sung RJ, Schier AF. Hypocretin/orexin overexpression induces an insomnia-like phenotype in zebrafish. J Neurosci. 2006;26:13400–13410. doi: 10.1523/JNEUROSCI.4332-06.2006. doi:26/51/13400 [pii] 10.1523/JNEUROSCI.4332-06.2006. [DOI] [PMC free article] [PubMed] [Google Scholar]
- 47.Liang X, Holy TE, Taghert PH. Synchronous Drosophila circadian pacemakers display nonsynchronous Ca(2)(+) rhythms in vivo. Science. 2016;351:976–981. doi: 10.1126/science.aad3997. [DOI] [PMC free article] [PubMed] [Google Scholar]
- 48.Gao XJ, et al. A transcriptional reporter of intracellular Ca(2+) in Drosophila. Nat Neurosci. 2015;18:917–925. doi: 10.1038/nn.4016. doi:10.1038/nn.4016 nn.4016 [pii] [DOI] [PMC free article] [PubMed] [Google Scholar]
- 49.Stanewsky R. Analysis of rhythmic gene expression in adult Drosophila using the firefly luciferase reporter gene. Methods Mol Biol. 2007;362:131–142. doi: 10.1007/978-1-59745-257-1_9. doi:1-59745-257-2:131 [pii] 10.1007/978-1-59745-257-1_9. [DOI] [PubMed] [Google Scholar]
- 50.Tang CH, Hinteregger E, Shang Y, Rosbash M. Light-mediated TIM degradation within Drosophila pacemaker neurons (s-LNvs) is neither necessary nor sufficient for delay zone phase shifts. Neuron. 2010;66:378–385. doi: 10.1016/j.neuron.2010.04.015. [DOI] [PMC free article] [PubMed] [Google Scholar]
- 51.Trapnell C, Pachter L, Salzberg SL. TopHat: discovering splice junctions with RNA-Seq. Bioinformatics. 2009;25:1105–1111. doi: 10.1093/bioinformatics/btp120. doi:10.1093/bioinformatics/btp120 btp120 [pii] [DOI] [PMC free article] [PubMed] [Google Scholar]
- 52.Haynes PR, Christmann BL, Griffith LC. A single pair of neurons links sleep to memory consolidation in Drosophila melanogaster. Elife. 2015;4 doi: 10.7554/eLife.03868. [DOI] [PMC free article] [PubMed] [Google Scholar]
Associated Data
This section collects any data citations, data availability statements, or supplementary materials included in this article.


