Abstract
The most recent edition of the Prostate Imaging Reporting and Data System (PI-RADS version 2) was developed based on expert consensus of the international working group on prostate cancer. It provides the minimum acceptable technical standards for MR image acquisition and suggests a structured method for multiparametric prostate MRI (mpMRI) reporting. T1-weighted, T2-weighted (T2W), diffusion weighted (DWI), and dynamic contrast enhanced (DCE) imaging are the suggested sequences to include in mpMRI. The PI-RADS version 2 scoring system enables the reader to assess and rate all focal lesions detected at mpMRI to determine the likelihood of a clinically significant cancer. According to PI-RADS v2 a lesion with a Gleason score ≥7, volume >0.5 cc, or extraprostatic extension is considered clinically significant. PI-RADS v2 uses the concept of a dominant MR sequence based on zonal location of the lesion rather than summing each component score, as was the case in version 1. The dominant sequence in the peripheral zone is DWI and the corresponding apparent diffusion coefficient (ADC) map, with a secondary role for DCE in equivocal cases (PI-RADS score 3). For lesions in the transition zone, T2W images are the dominant sequence with DWI/ADC images playing a supporting role in the case of an equivocal lesion.
Introduction
Prostate adenocarcinoma, with an estimated 180,890 new cases in 2016, is the most common non-cutaneous malignancy and the second most common cause of cancer related mortality in men in the United States (1). There is significant biologic heterogeneity of prostate adenocarcinoma; some tumors are aggressive with high morbidity and mortality while others remain indolent (2). Given this range of clinical behavior, it is beneficial to the patient to attempt to prospectively differentiate clinically significant tumors (Gleason score ≥7, volume >0.5 cc, or extraprostatic extension) that would be candidates for therapy from clinically insignificant tumors that can safely undergo active surveillance.
Prostate adenocarcinoma is typically diagnosed using non-targeted random transrectal ultrasound (TRUS)-guided biopsy in the setting of an abnormal digital rectal examination or elevated prostate specific antigen (PSA). Because TRUS-guided biopsy randomly samples the gland, it is possible that the biopsy results may not accurately detect the most aggressive tumor within the gland (3, 4). Because of this potential for not detecting clinically significant cancer, new approaches for MR defined targeted biopsy based upon improved MR imaging techniques have been proposed (5).
Traditionally, pelvic MRI has been used for treatment planning and monitoring with locoregional staging of a biopsy proven prostate cancer (6). However, physiologic and functional sequences (diffusion weighted imaging [DWI], dynamic contrast enhanced imaging [DCE], and MR spectroscopy) are now added to the traditional sequences (T1 and T2 weighted images) to create current state of the art multiparametric MRI (mpMRI). This multiparametric approach expanded the role of MRI from only loco-regional staging to also include prostate adenocarcinoma detection, localization, and characterization. As mpMRI became more widely validated, the European Society of Urogenital Radiology (ESUR) developed the Prostate Imaging Reporting and Data System version 1 (PI-RADS v1) to provide standardized guidelines for image acquisition and interpretation (7). PI-RADS v1 allowed for equal weighting for all acquired sequences (including MR spectroscopy), with a total maximum score of 20 (5 points for each sequence). PI-RADS v1 was demonstrated to have good accuracy, and moderate inter-observer agreement with superior performance in the peripheral zone compared to the transition zone (8). However, several investigators have noted that the use of MR spectroscopy and DCE sequences may not add significant value to the interpretation of mpMRI (9–11). In part to address the shortcoming of PI-RADS v1 in the transition zone, and to reflect the concept of a dominant sequence to assess a lesion based on primary anatomic location within the prostate gland, an updated version of PI-RADS was proposed in early 2015 (12, 13). This new version of PI-RADS has been validated in several studies and shown to have moderate interobserver variability (14, 15).
In this review, we provide an overview of PI-RARDS v2 using a case-based approach and discuss and illustrate common pearls in the interpretation of mpMRI.
Background
PI-RADS v2 is designed to improve focal lesion detection, localization, characterization, and risk stratification in patients with suspected cancer and consists of technical recommendation for MRI acquisition and a scoring system for image interpretation. PI-RADS v2 uses a scale of 1–5 to report the overall probability of clinically significant prostate cancer on mpMRI. The use of PI-RADS v2 is limited to treatment naive patients and it should not be used for staging, assessment of treatment outcome, recurrence, or progression during surveillance. The scoring algorithm is summarized in Table 1.
Table 1.
PI-RADS v2 scoring system.
| Imaging sequence and score | Description |
|---|---|
| T2 weighted, PZ | |
| 1 | Uniform hyperintense signal intensity (normal) |
| 2 | Linear or wedge-shaped hypointensity or diffuse mild hypointensity, usually indistinct margin |
| 3 | Heterogeneous signal intensity or non-circumscribed, rounded, moderate hypointensity Includes others that do not qualify as 2, 4, or 5 |
| 4 | Circumscribed, homogenous moderate hypointense focus/mass confined to prostate and <1.5 cm in greatest dimension |
| 5 | Same as 4 but ≥1.5cm in greatest dimension or definite extraprostatic extension/invasive behavior |
| T2 weighted, TZ | |
| 1 | Homogeneous intermediate signal intensity (normal) |
| 2 | Circumscribed hypointense or heterogeneous encapsulated nodule(s) (BPH) |
| 3 | Heterogeneous signal intensity with obscured margins Includes others that do not qualify as 2, 4, or 5 |
| 4 | Lenticular or non-circumscribed, homogeneous, moderately hypointense, and <1.5 cm in greatest dimension |
| 5 | Same as 4, but ≥ 1.5cm in greatest dimension or definite extraprostatic extension/invasive behavior |
| DWI | |
| 1 | No abnormality (i.e. normal) on ADC and high b-value DWI |
| 2 | Indistinct hypointense on ADC |
| 3 | Focal mildly/moderately hypointense on ADC and isointense/mildly hyperintense on high b-value DWI. |
| 4 | Focal markedly hypontense on ADC and markedly hyperintense on high b-value DWI; <1.5cm in greatest dimension |
| 5 | Same as 4 but ≥1.5cm in greatest dimension or definite extraprostatic extension/invasive behavior |
| DCE | |
| Negative | no early enhancement, diffuse enhancement not corresponding to a focal finding on T2 and/or DWI, or focal enhancement corresponding to a lesion demonstrating features of BPH on T2WI |
| Positive | focal, and earlier than or contemporaneously with enhancement of adjacent normal prostatic tissues, and corresponds to suspicious finding on T2W and/or DWI |
DWI = diffusion weighted imaging, DCE = dynamic contrast enhanced, PZ = peripheral zone, TZ = transition zone, BPH = benign prostatic hyperplasia
PI-RADS v2 recommends including T1W, T2W, high b value DWI (≥ 1400) with corresponding ADC map, and DCE sequences in mpMRI (Table 2). Although a magnetic field strength of 3T is suggested, scanning at 1.5T with updated/optimal protocols would also result in acceptable image quality and therefore, is not discouraged. The use of an endorectal coil (ERC) is an institutional decision with the goal of obtaining optimal images.
Table 2.
Suggested multiparametric prostate MRI protocol at 3 Tesla*.
| Axial T1W | T2W (multiplanar) |
Axial DWI | Axial DCE | |
|---|---|---|---|---|
| Pulse sequence | spin echo or gradient echo ± fat suppression |
Fast Spin Echo | Free-breathing spin echo Echo Planar Imaging sequence + spectral fat saturation) |
2D or 3D T1 gradient echo |
| TR(ms) | 385** | 3500** | ≥3000 | <100 |
| TE(ms) | 6.2** | 102** | ≤90 | <5 |
| FOV(cm) | 16** | 12–20 | 16–22 | encompass the entire prostate gland and seminal vesicles |
| ST(mm) | 3** | 3 | ≤4 | 3 |
| Spacing(mm) | 0** | 0 | 0 | 0 |
| In plane dimension (phase(mm) × frequency (mm)) |
≤ 0.7 × ≤0.4** | ≤ 0.7 × ≤0.4 | ≤ 2.5 × ≤ 2.5 | ≤2 × ≤2 |
| Remarks | In order to avoid blurring, excessive echo train lengths should be avoided. |
b-values≥ 1400 s/mm2 |
Preferred temporal resolution is <7sec, Total observation rate: >2min |
These parameters are optimized for an examination utilizing both a phased array surface coil and an endorectal coil.
Institutional recommendations
TR: repetition time; TE: echo time; ms: millisecond; FOV: field of view; ST: slice thickness.
Steps in lesion identification and scoring
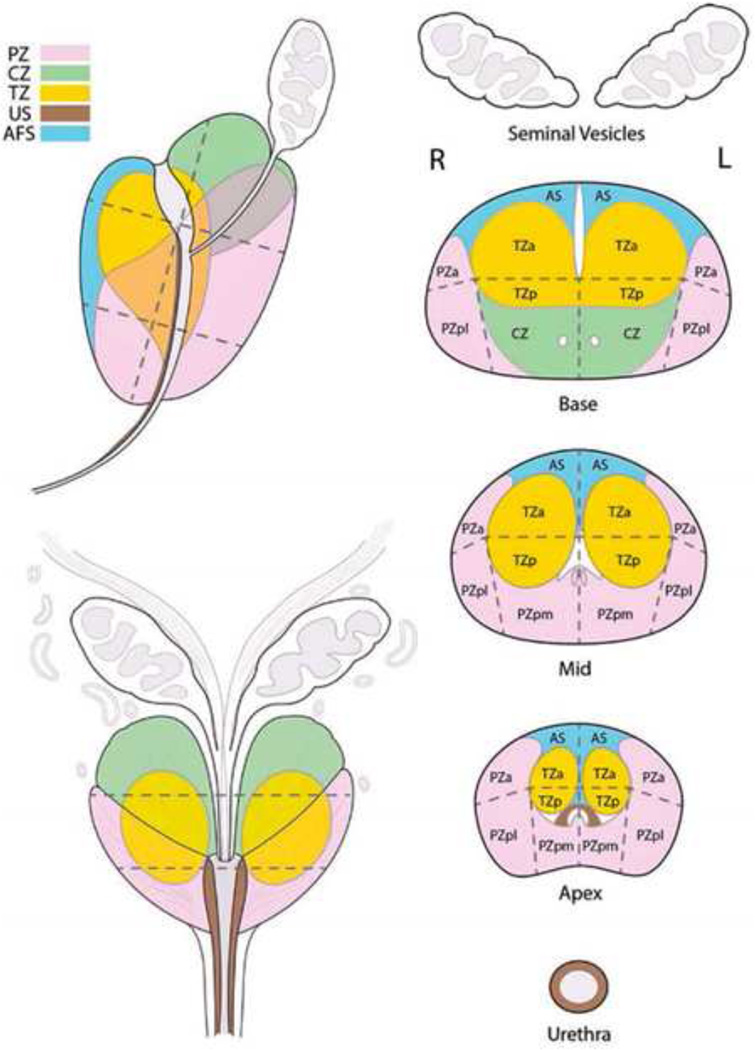
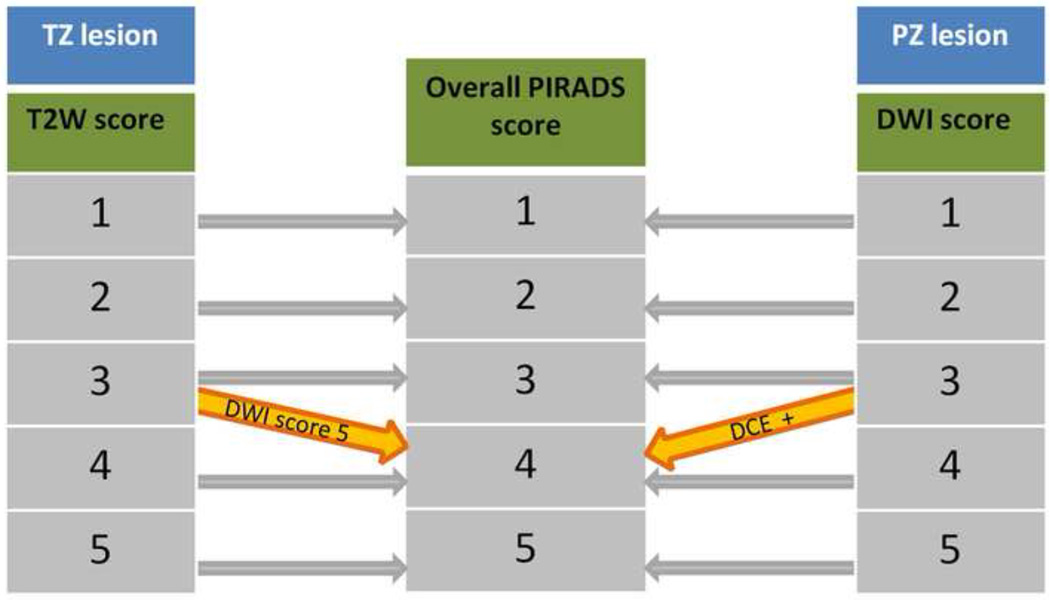
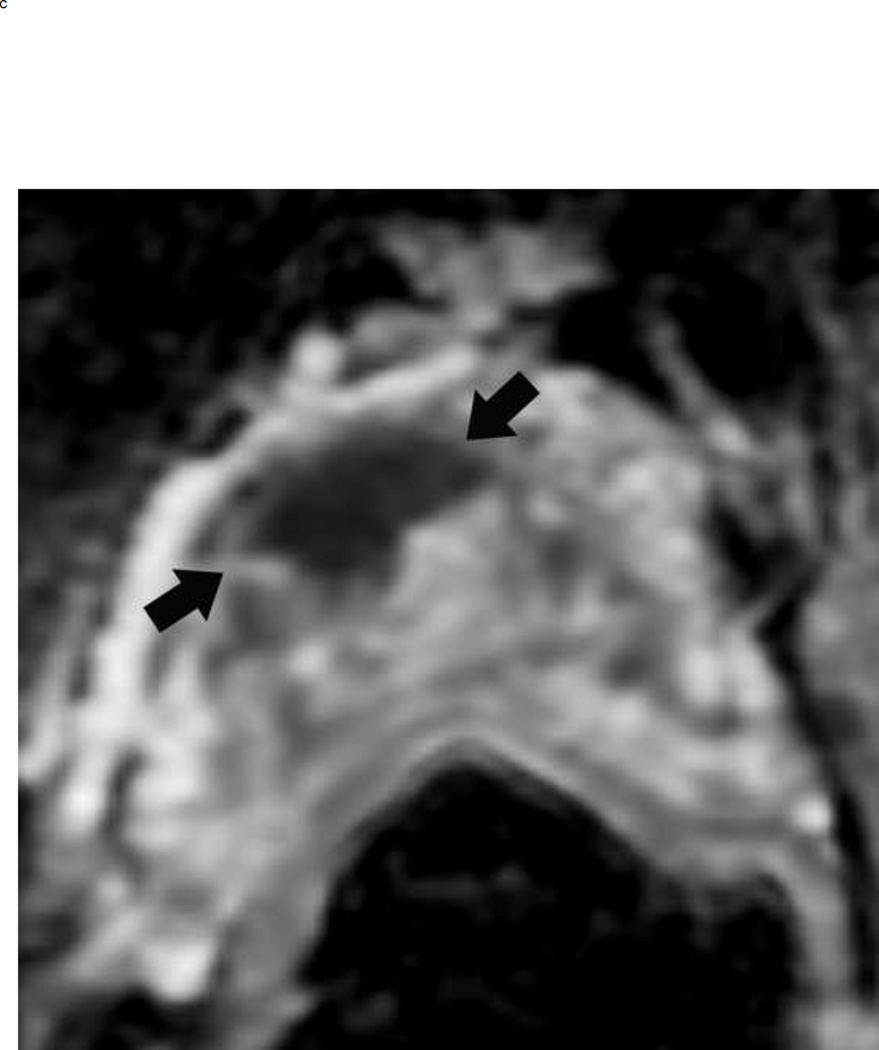
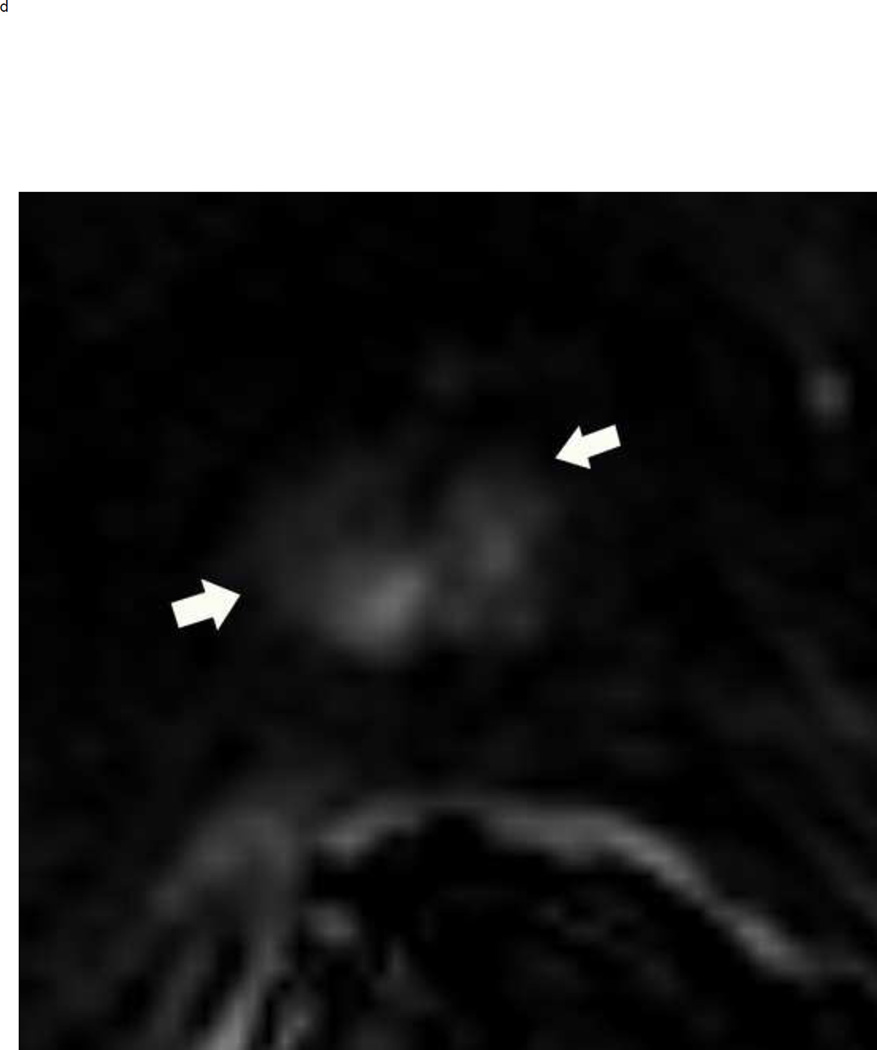
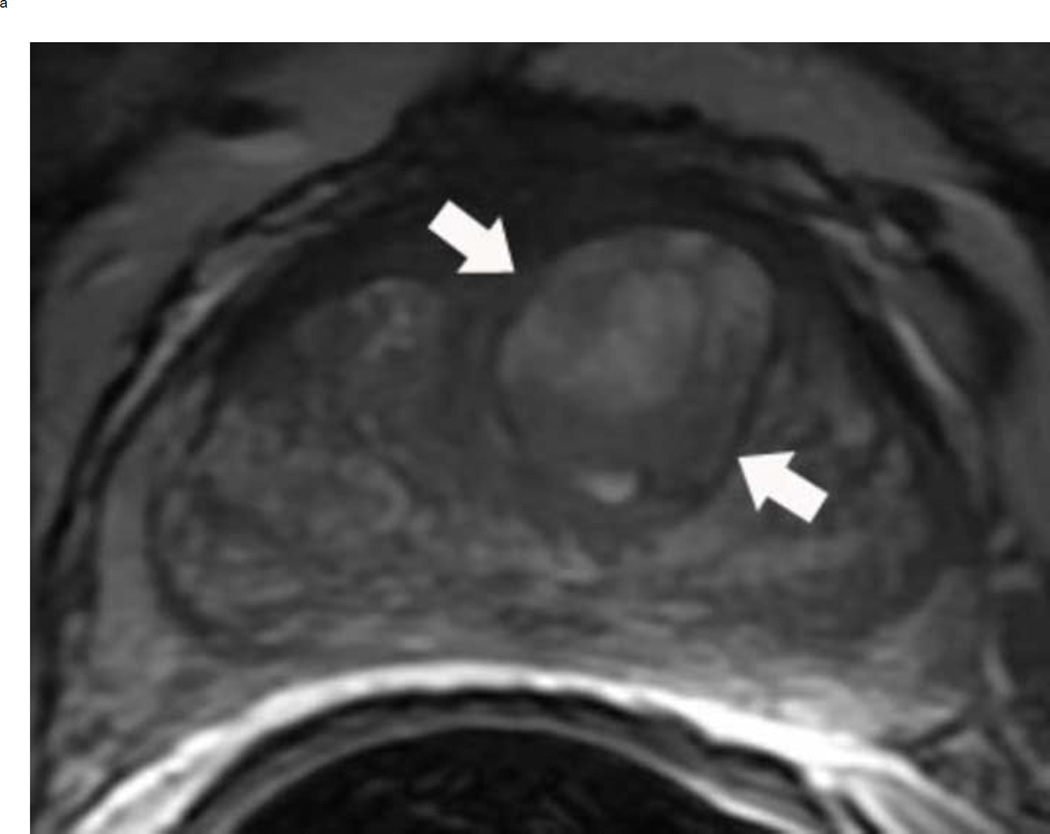
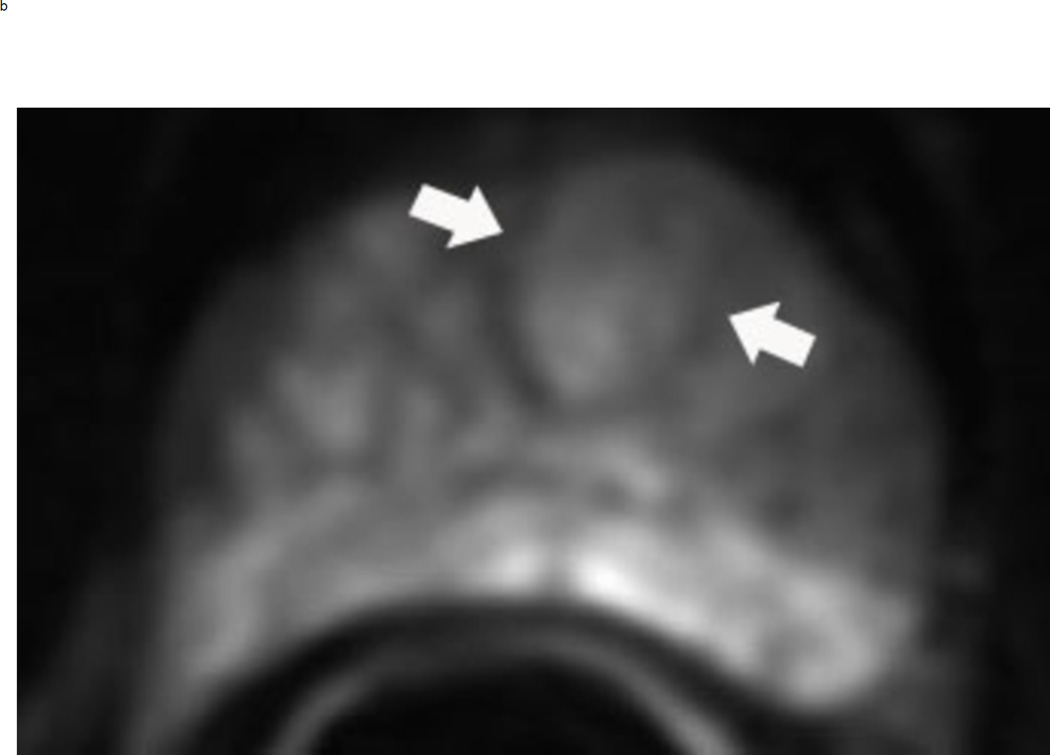
To simplify the use of PI-RADS v2, we recommend utilizing a 3-step approach: 1) Lesion localization based on PI-RADS v2 39-sector map (Fig 1), 2) lesion measurement, and 3) location based scoring (Table 1 and Fig 2). PI-RADS v2 uses an algorithmic approach to arrive at the overall score based on the zonal location of the lesion. DWI with corresponding ADC map is the dominant sequence in the peripheral zone that will determine the overall suspicion score (Fig 3). There is a secondary role for DCE in the peripheral zone in equivocal cases (PI-RADS 3), where a positive DCE score can upgrade the lesion to a PI-RADS 4 (Fig 4). T2W imaging is the dominant sequence in the transition zone that will determine the overall suspicion score (Fig 5). There is a secondary role for DWI in the transition zone in equivocal cases (PI-RADS 3), where a large corresponding diffusion signal abnormality (PI-RADS 5, > 1.5 cm) can upgrade the lesion to an overall PI-RADS 4. A lesion in the anterior fibromuscular stroma or central zone should be scored using the transition zone scoring algorithm. Additional example cases of PI-RADS 2 and 3 lesions are shown below (Fig 6–8).
Fig 1.
Sector map used in PI-RADS v2. AFS(AS): Anterior Fibromuscular Stroma, CZ: Central Zone, TZ: Transition Zone, PZ: Peripheral Zone, US: Urethral Sphincter. a:anterior, p:posterior, m:medial, l:lateral. From American College of Radiology. MR Prostate Imaging Reporting and Data System version 2.0. Accessed March 2016, from http://www.acr.org/Quality-Safety/Resources/PIRADS/
Fig 2.
Stepwise approach to assign an overall PI-RADS score based on zonal location. TZ: transition zone. PZ: peripheral zone
Fig 3.
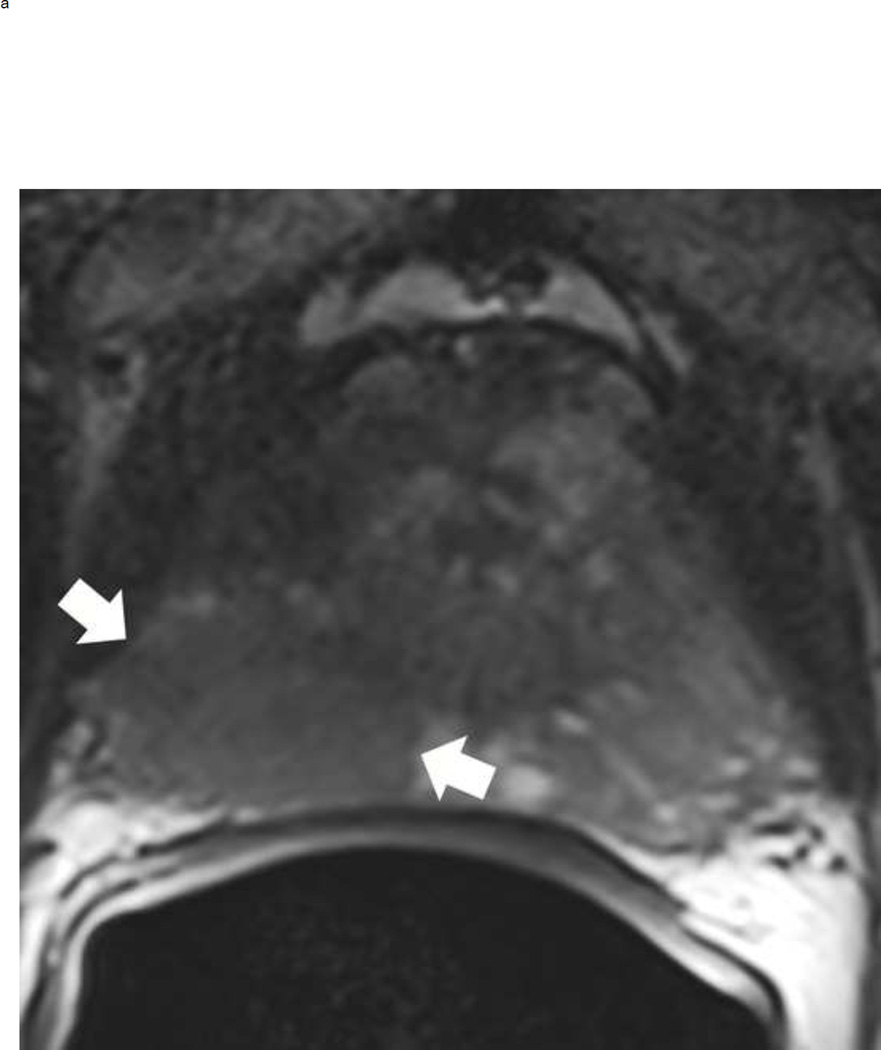
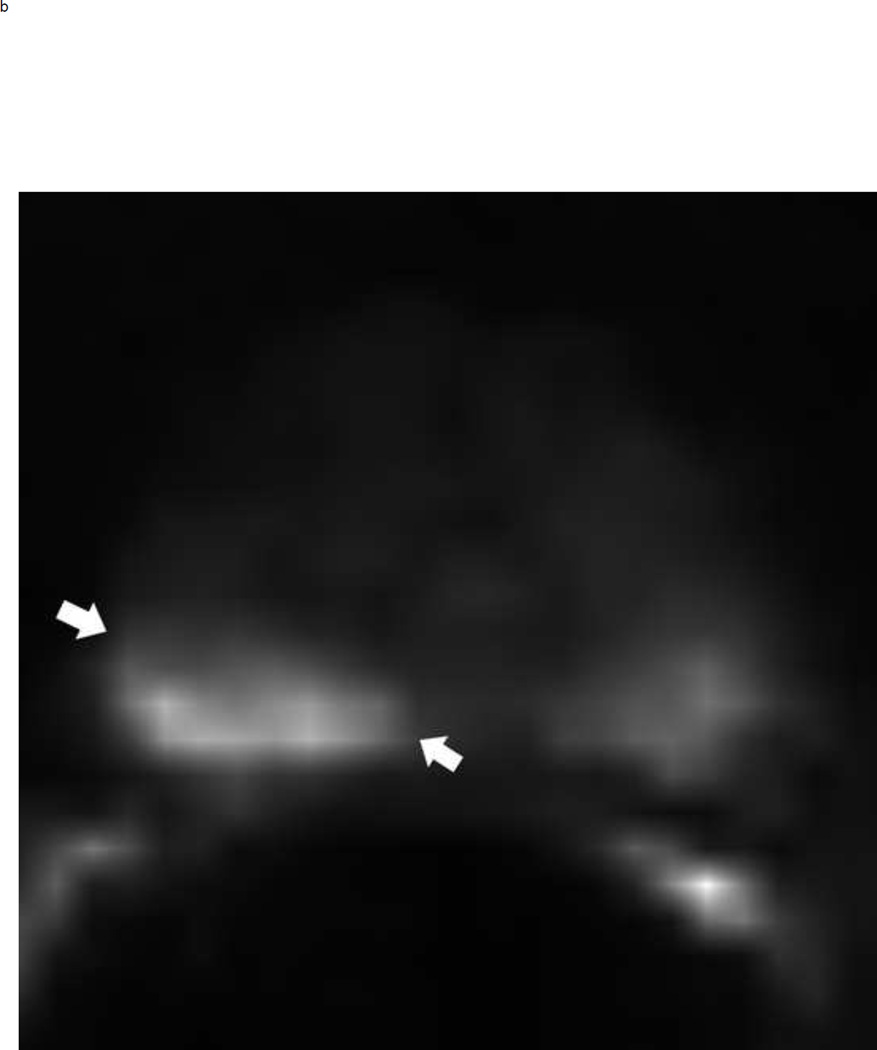
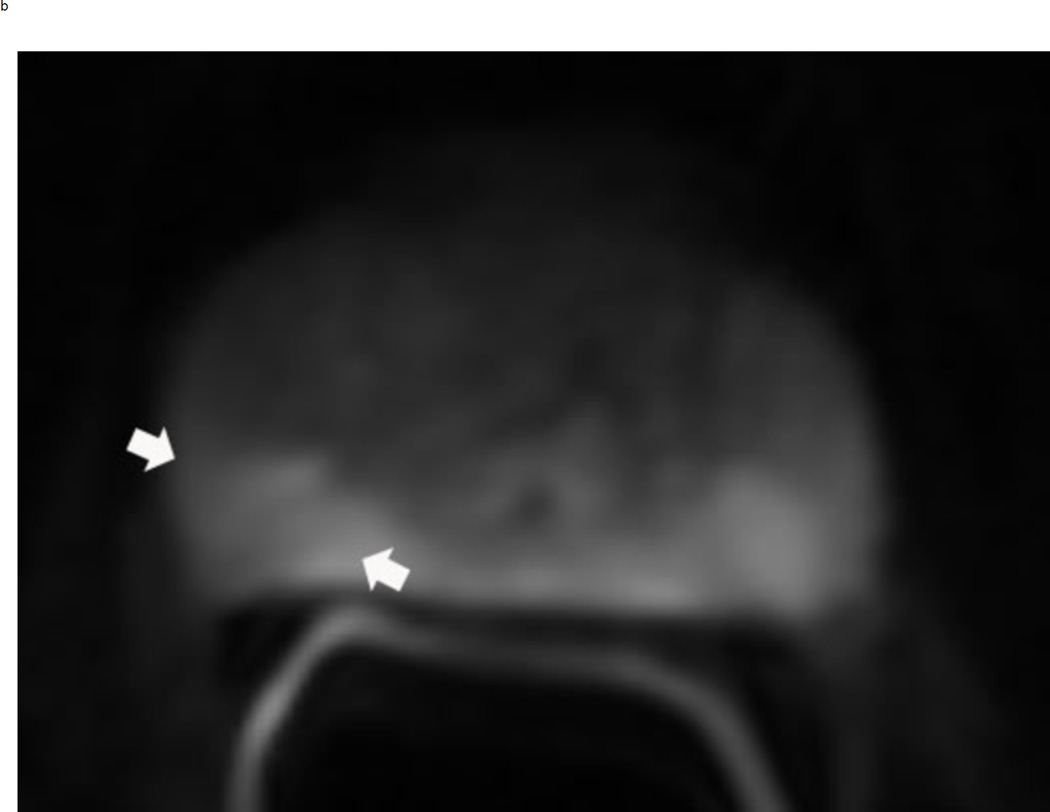
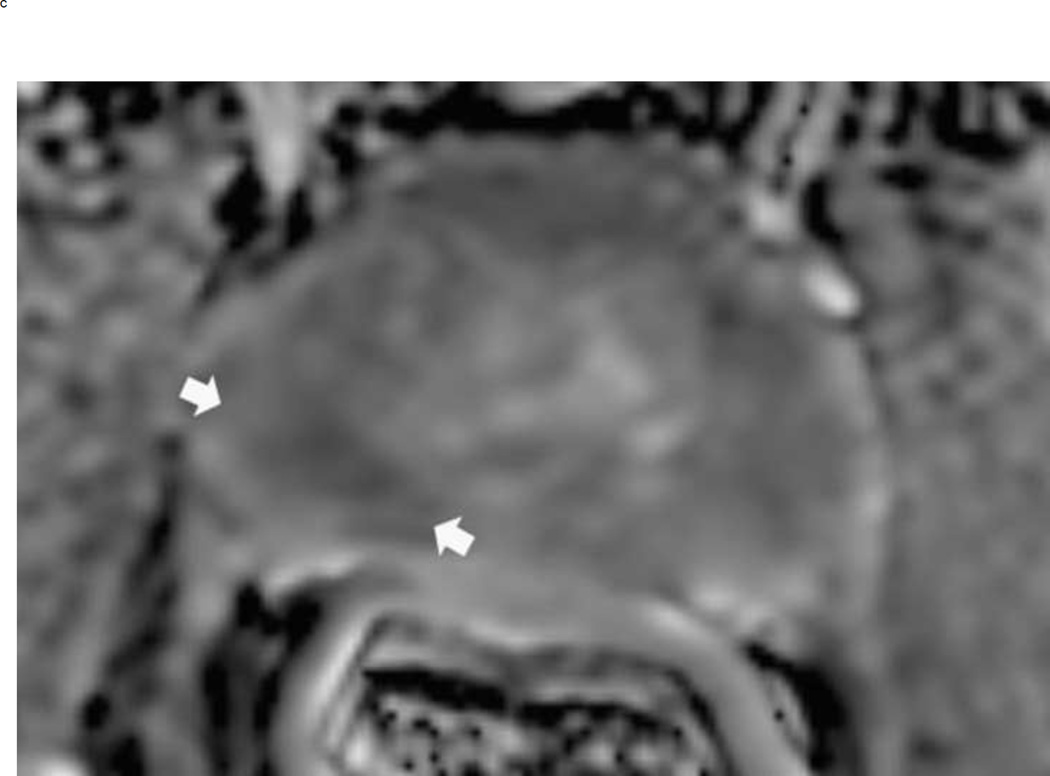
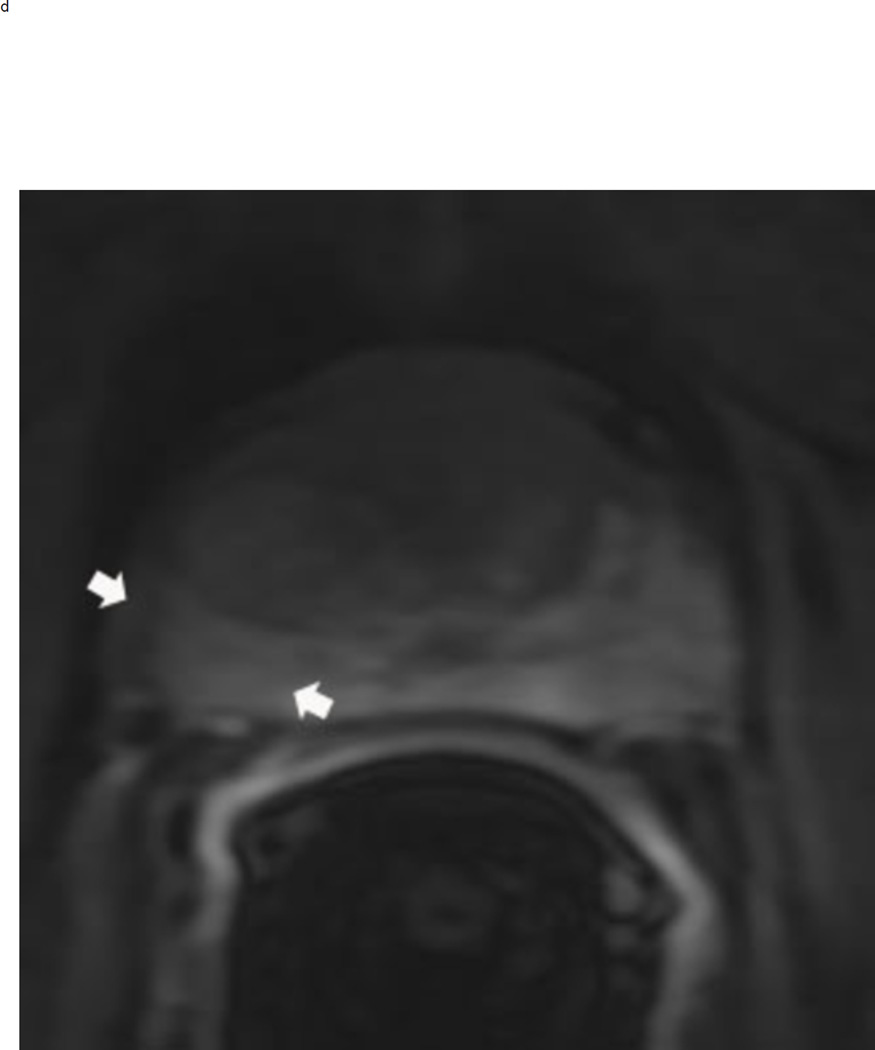
Assigning a PI-RADS v2 score for a lesion in the peripheral zone. Multiparameteric prosatate MRI images from a 59 year old man with elevated PSA (a–d): (a) Axial T2W image (b) Axial b1400 DWI image (c) Corresponding ADC map (d) Axial DCE image. Step 1 (localization – zone and sector): The mass (arrows) is located in the right midgland in sectors PZpl and PZpm (a-d). Step 2 (measurement): The mass measures 1.60 cm in greatest dimension (d). Step 3 (provide an overall score): DWI score=5 (Focal markedly hypointense on ADC and markedly hyperintense on high b-value DWI >1.5 cm). DCE =positive (focal early enhancement). T2W score=5 (Circumscribed, homogenous moderate hypointense mass >1.5 cm). Overall PI-RADS score=5
Fig 4.
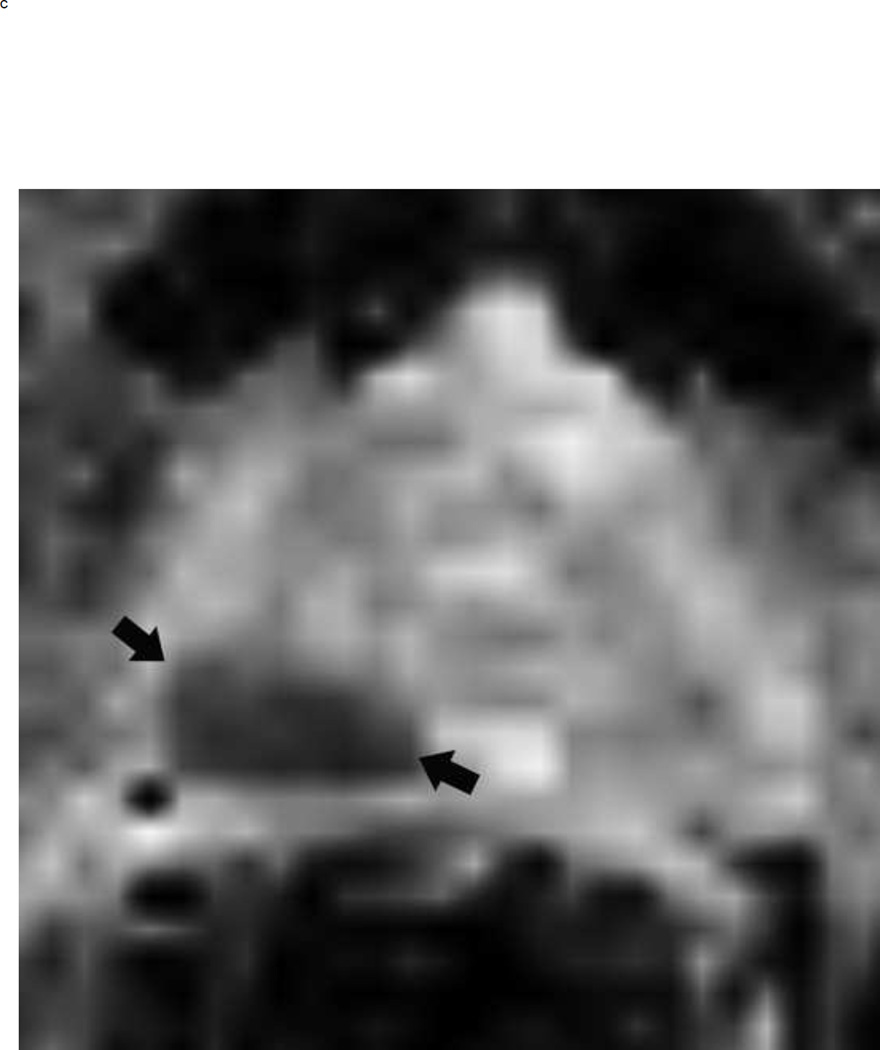
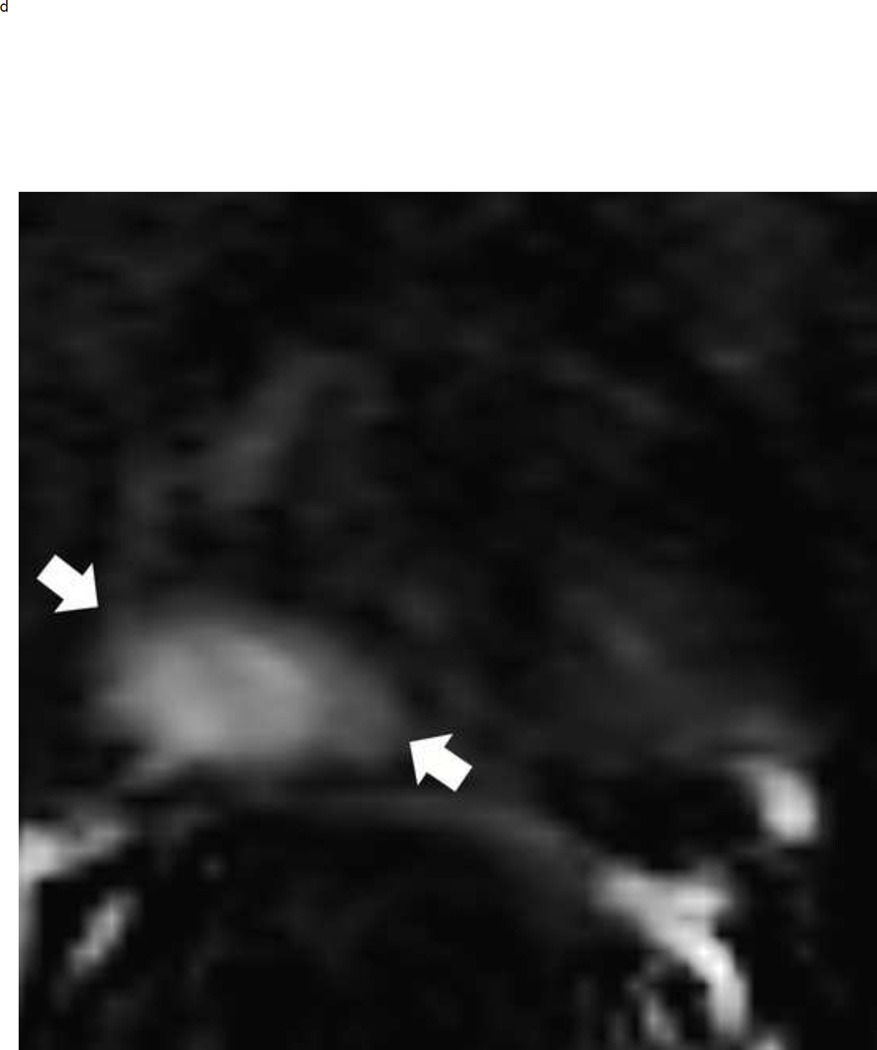
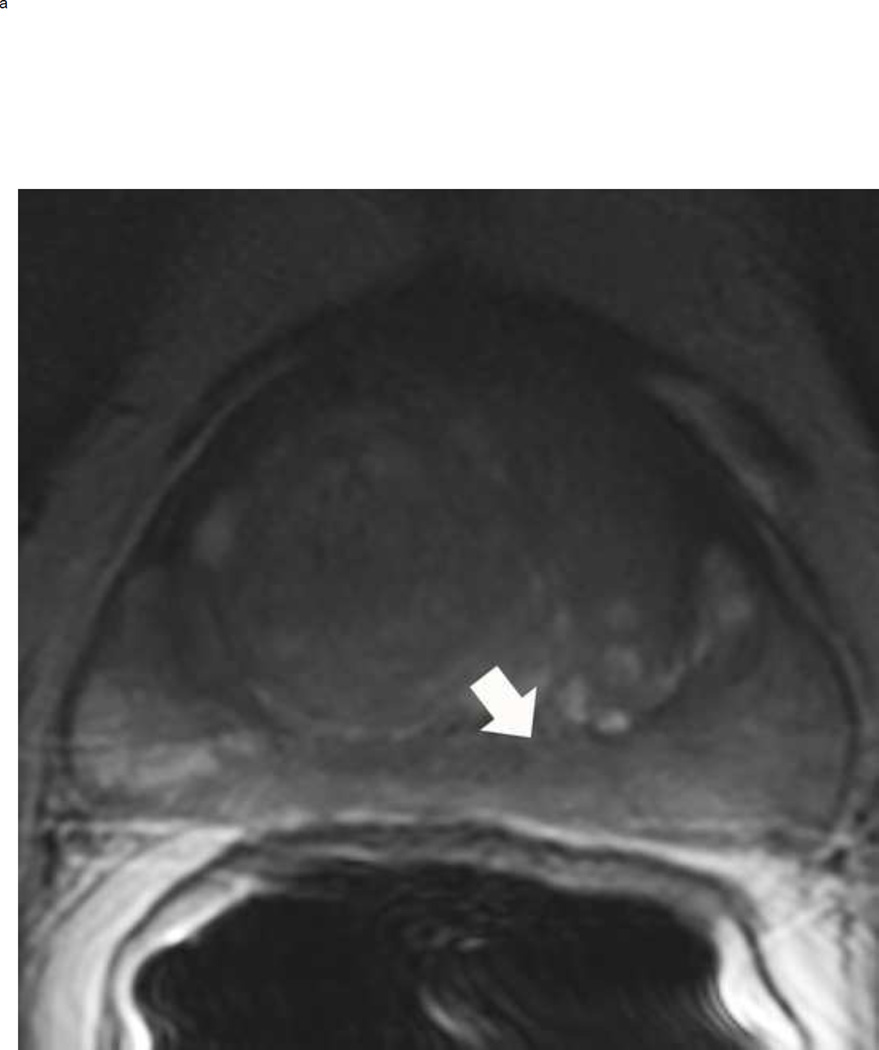
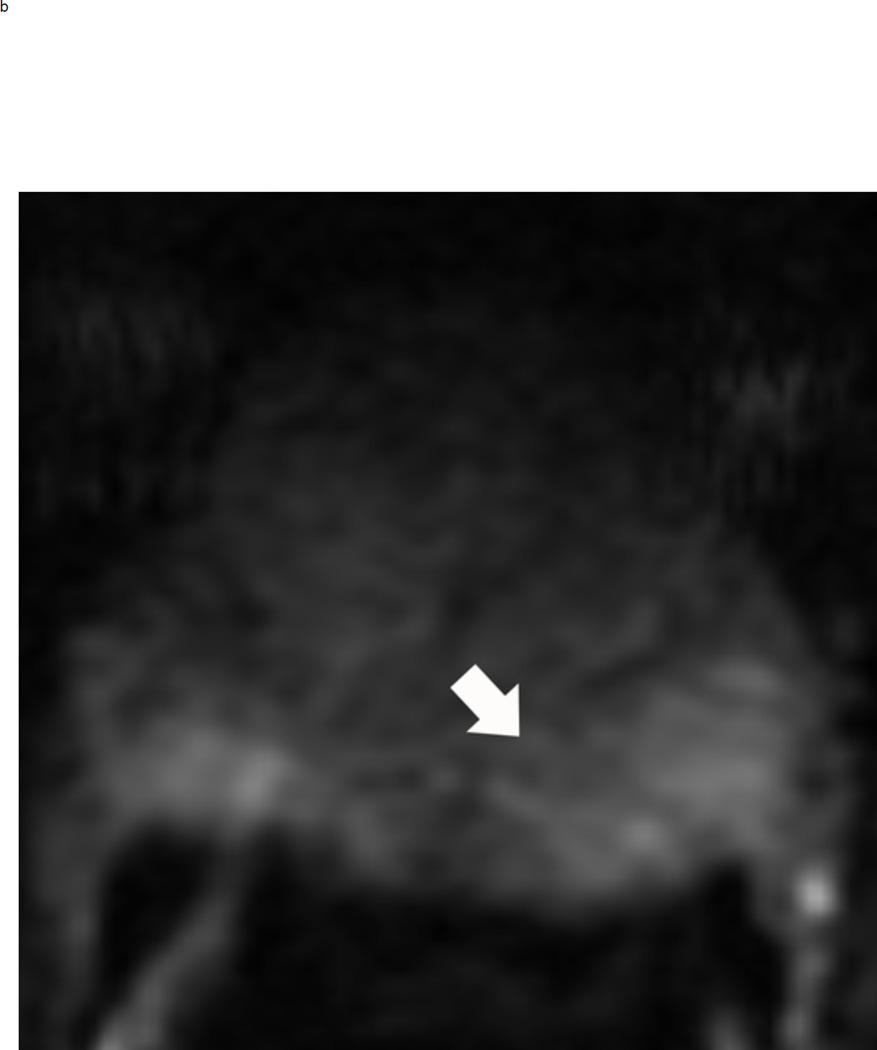
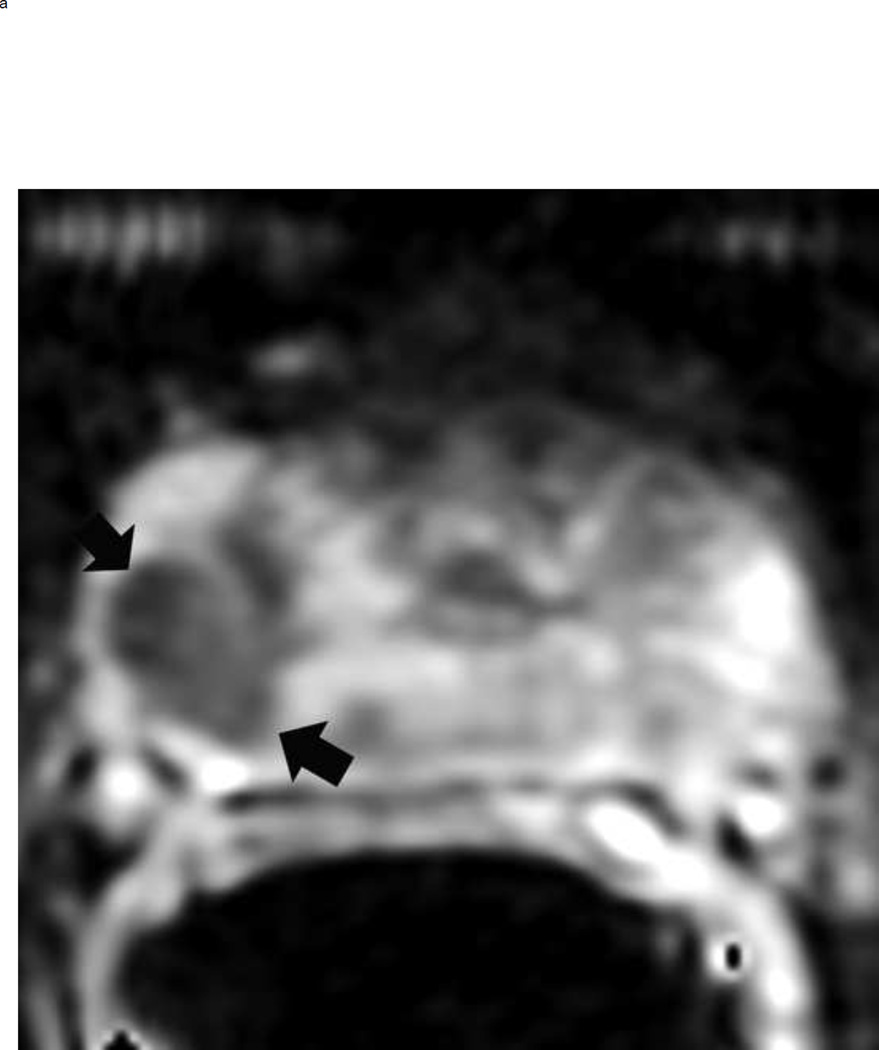
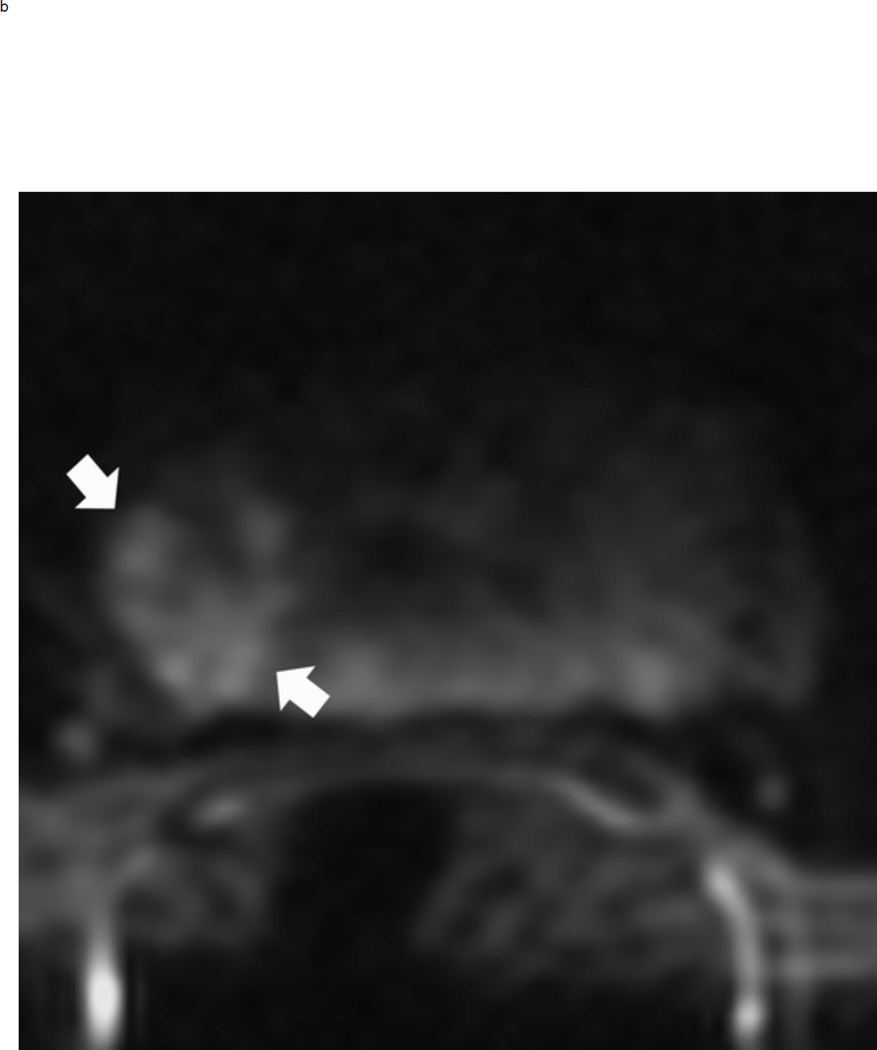
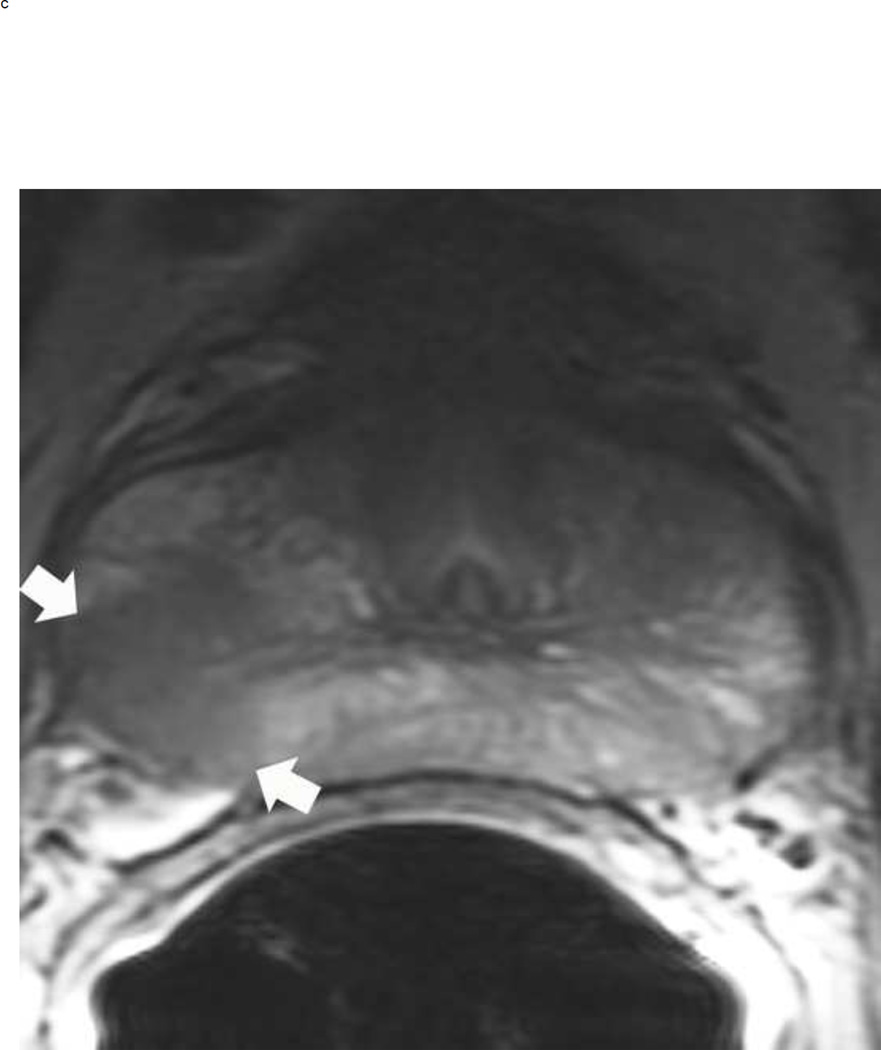
Upgrading an equivocal lesion in the peripheral zone (PI-RADS 3) to a significant lesion (PIRADS 4) based on focal early enhancement. Multiparameteric prosatate MRI images from a 53 year old man with elevated PSA (a-d). Axial DWI image (b) and corresponding ADC map(c) demonstrate a 0.7 cm lesion that is moderately hypointense on ADC (arrows) but mildly hyperintense to isointense on DWI (arrow) (b). The mass is seen on the T2W image as a noncircumscribed moderately hypointense region (arrow) (a). Based on these images, the lesion would be a PI-RADS 3. However, it demonstrates early focal enhancement (arrow) (d). This upgrades the overall PI-RADS score from 3 to 4
Fig 5.
Assigning a PI-RADS v2 score to a lesion in the transition zone. Multiparameteric prosatate MRI images from an 80 year old man with elevated PSA (a–d) (a) Axial T2W. (b) Axial b-value 1400 DWI, (c) ADC map. (d) Axial DCE image. Step 1 (localization – zone and sector): The mass is located in the transition zone at the base and midgland in the AFS, TZa, and TZp sectors (arrows) (a-d). Step 2 (measurement): The lesion measures 2.0 cm in maximum diameter (a). Step 3 (Provide an overall score): T2W score=5 (Lenticular, homogeneous, moderately hypointense mass >1.5 cm). DWI score=5 (Focal markedly hypointense on ADC and markedly hyperintense on high b-value DWI >1.5 cm). DCE =positive (focal early enhancement). Overall PI-RADS score=5
Fig 6.
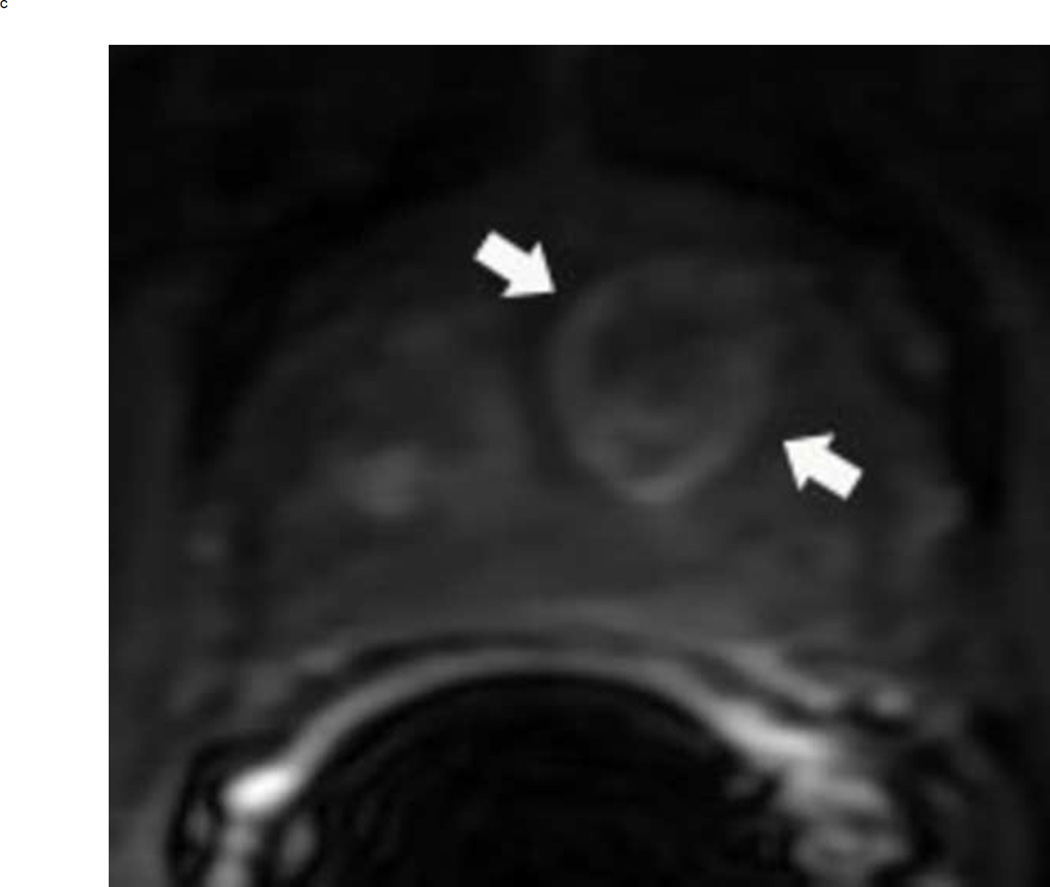
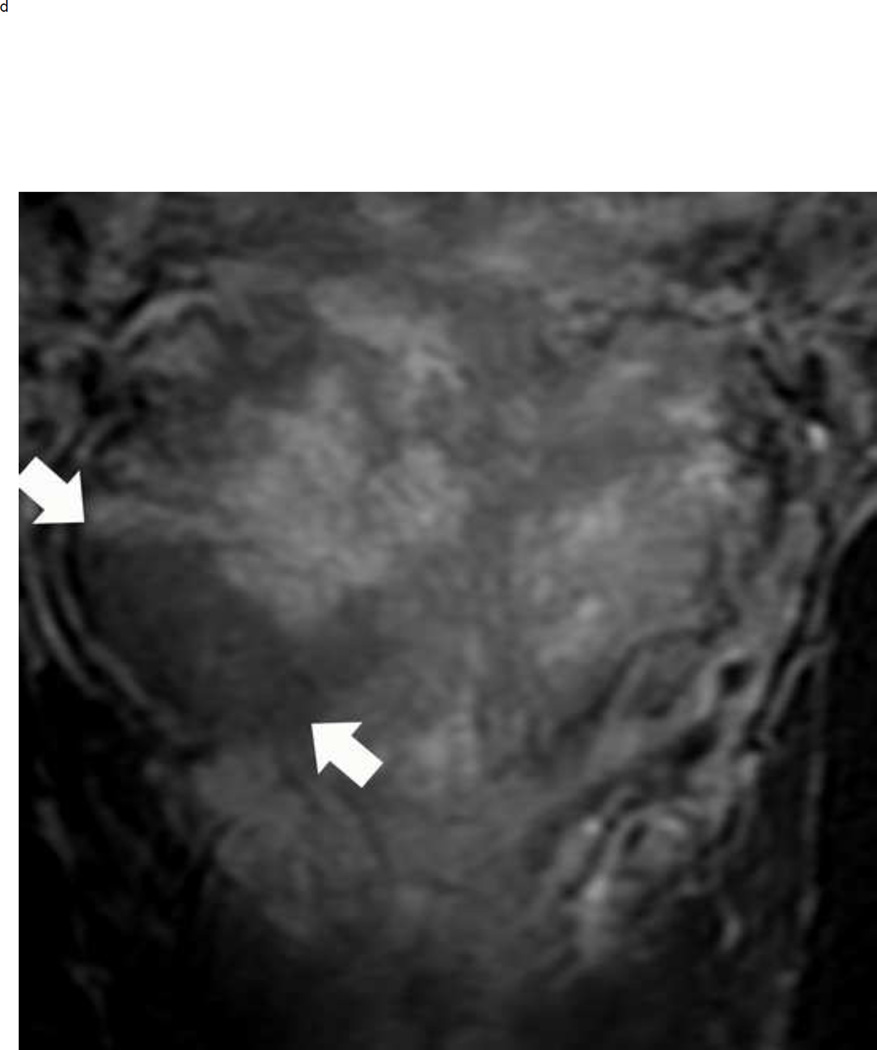
64 year old man with elevated PSA. Axial T2 weighted images show typical appearance of changes of glandular and stromal hyperplasia in the transition zone (arrows) (a). These typical BPH nodules demonstrate mildly increased signal on high b-value diffusion weighted images (arrows) (b) and enhance earlier than the surrounding normal prostatic tissue (arrows) (c). This lesion would be assigned a PI-RADS score of 2. Note: BPH = benign prostatic hyperplasia, PSA = prostate specific antigen.
Fig 8.
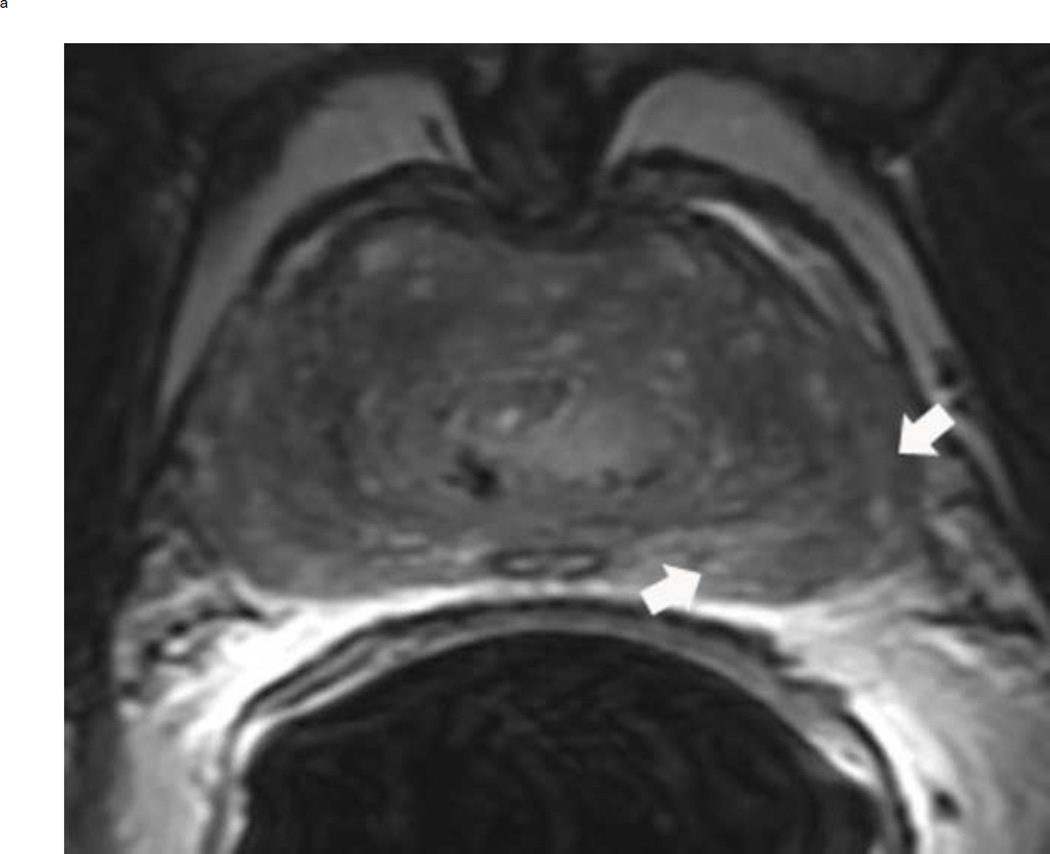
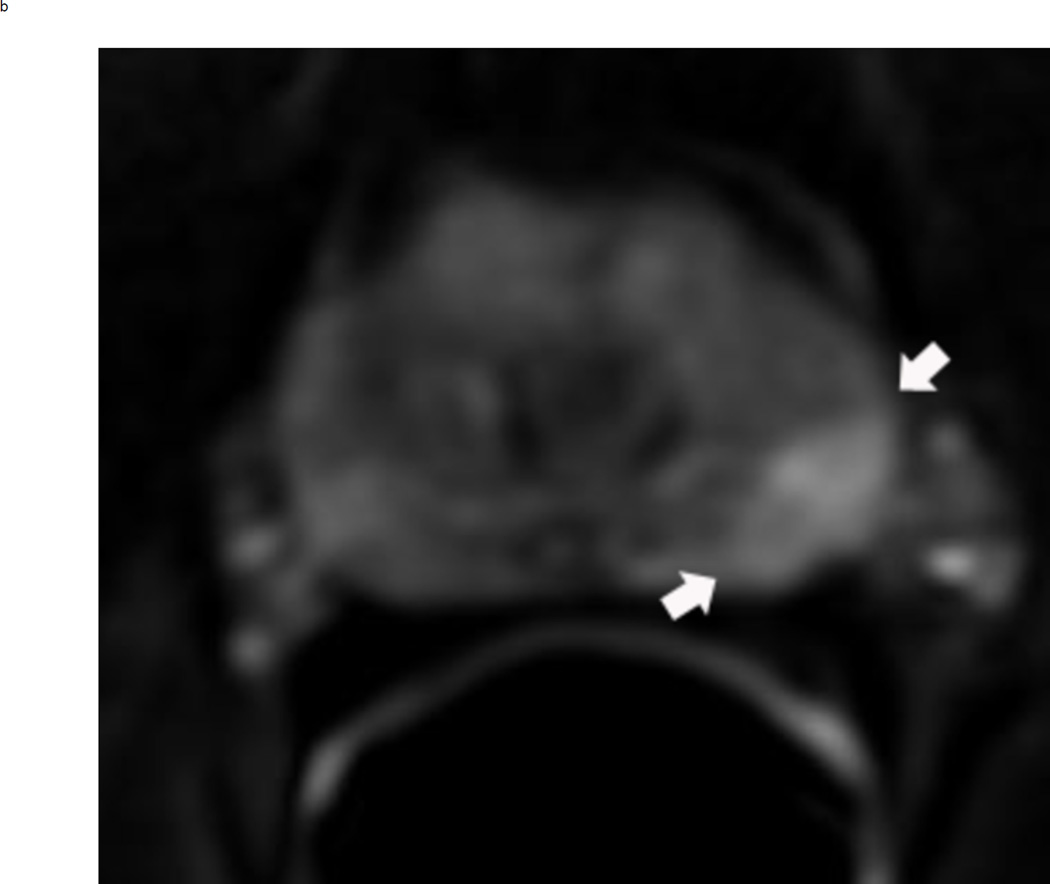
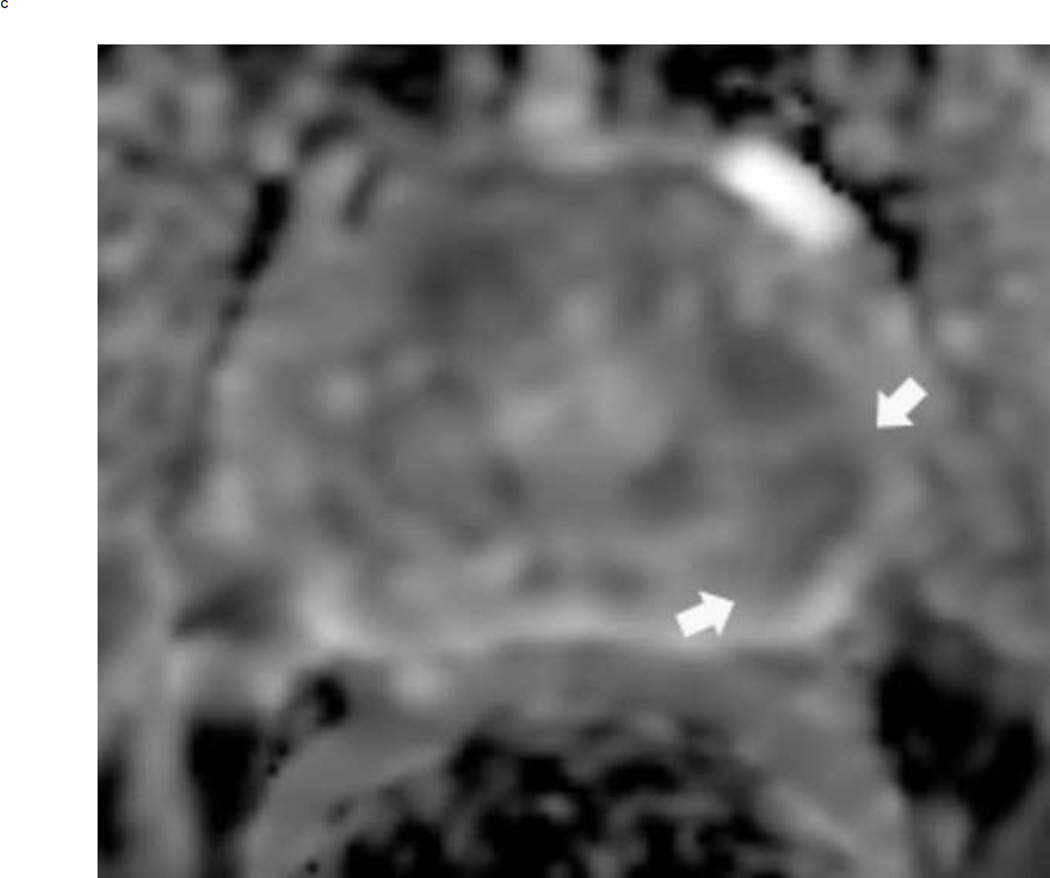
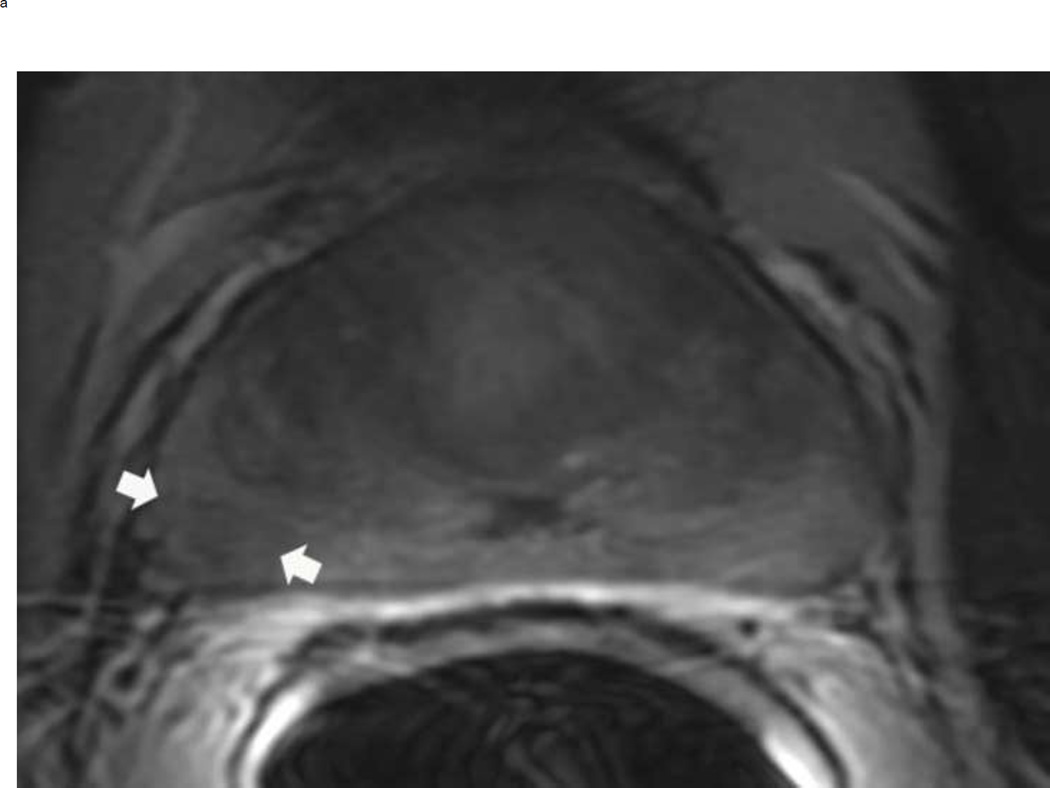
PI-RADS 3 lesion in the left peripheral zone in a 65 year old man with elevated PSA. Axial T2 weighted image demonstrates a heterogenous non-circumscribed lesion in the left peripheral zone posterlateral sector PZpl (arrows) (a). The lesion is mildly hyperintense on high b-value diffusion weighted image (arrows) (b) and mildly hypointense on ADC map (arrows) (c). DCE is negative as there is no focal enhancement (D). The overall PI-RADS score is 3.
PI-RADS Pearls
Measurement
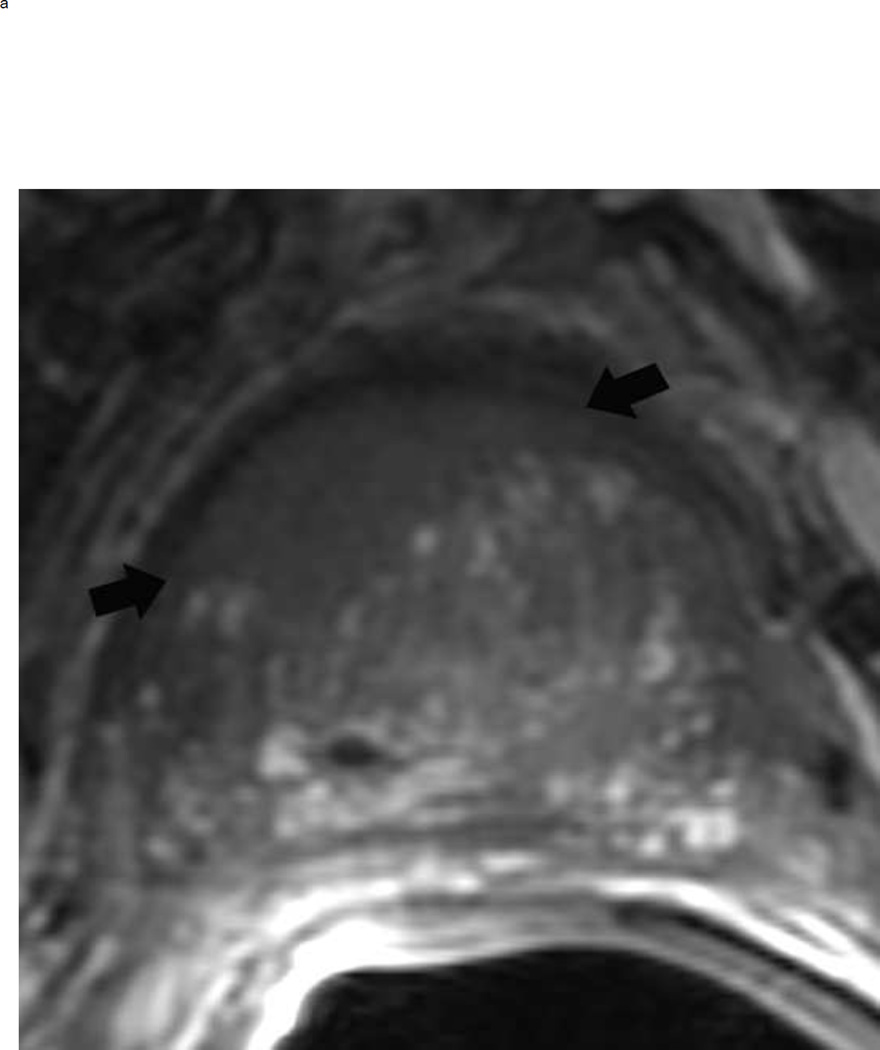
The maximum lesion diameter is the key feature in discriminating between an overall PIRADS suspicion score of 4 or 5. The ADC map is the preferred sequence for measuring peripheral zone lesions, whereas T2-weighted images are the suggested sequence to measure lesions in the transition zone. However, if a lesion is difficult to measure or obscured on the recommended sequence, measurement should be done using the sequence or plane with the best lesion conspicuity (Fig 9).
Fig 9.
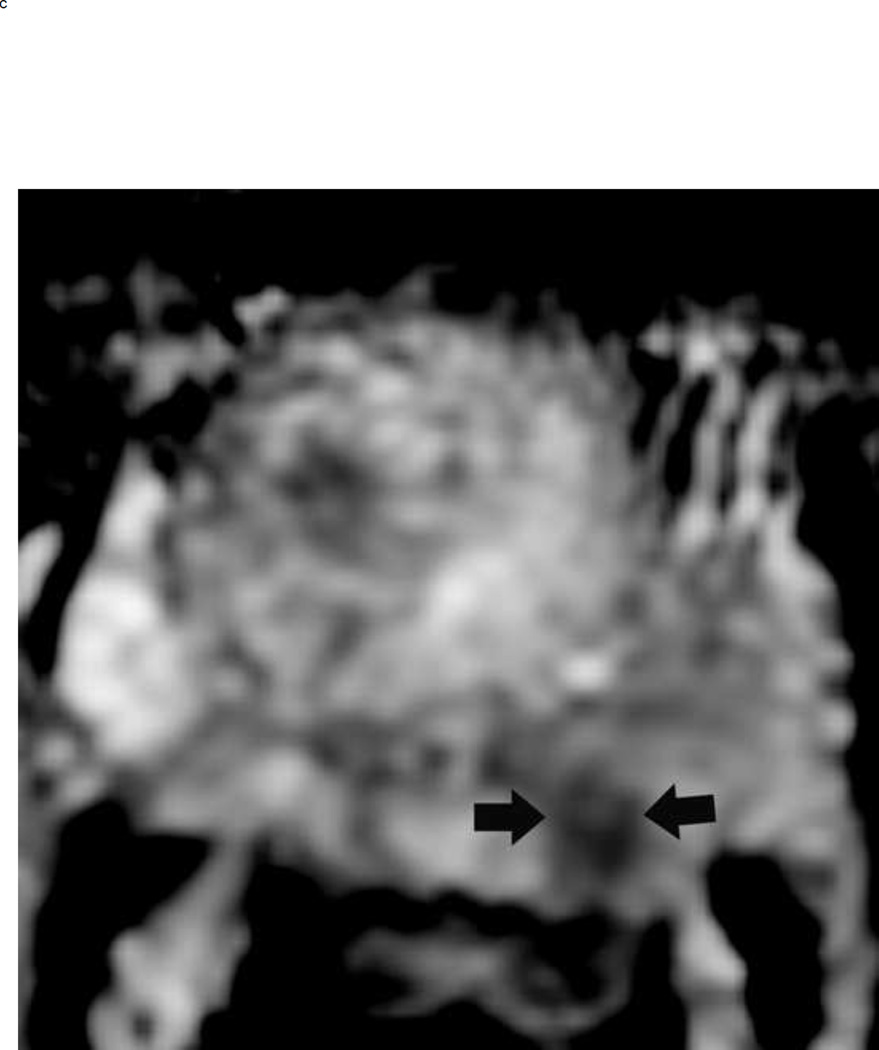
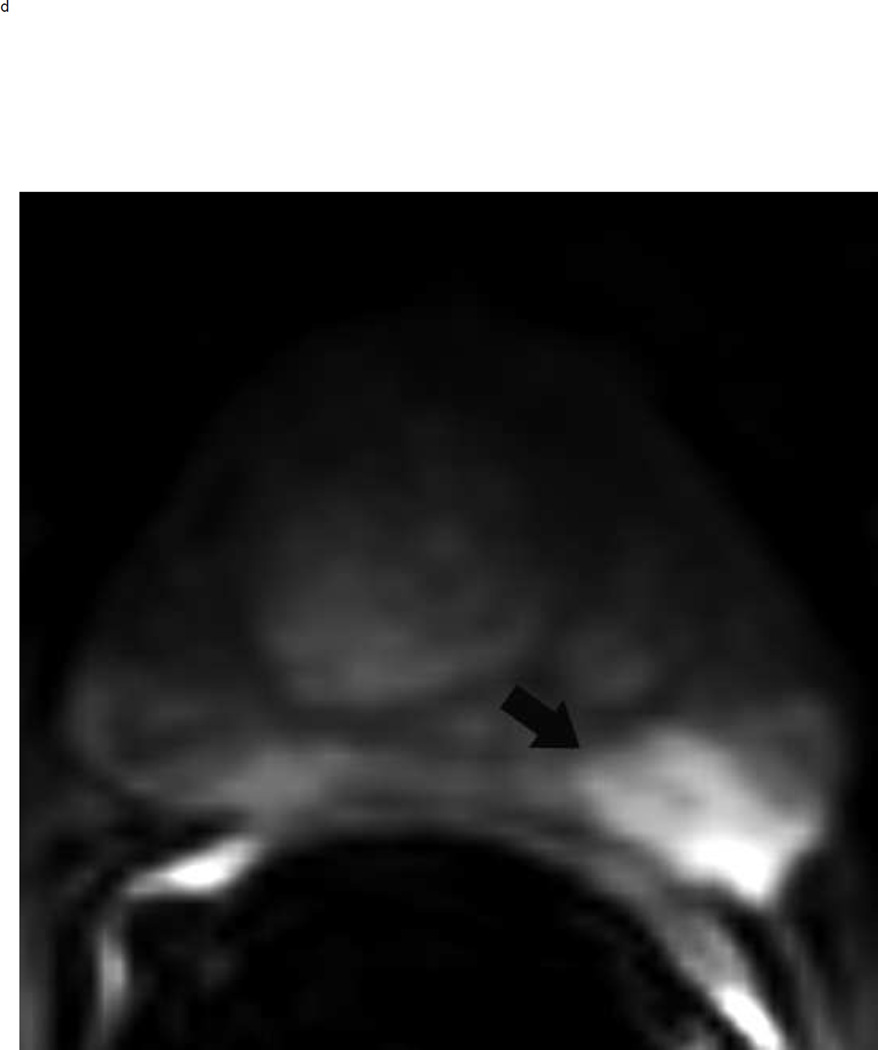
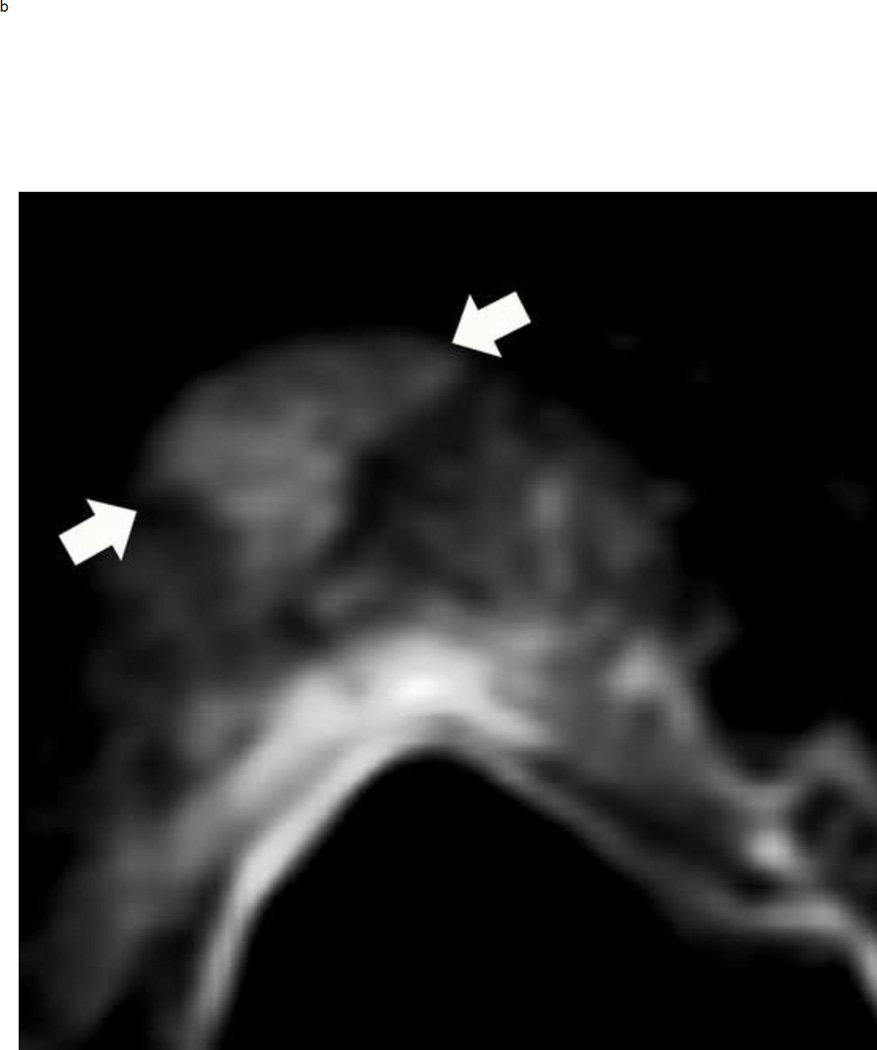
A peripheral zone mass in a 50 year old man with elevated PSA that measures < 1.5 cm on the axial images and > 1.5 cm on the coronal images. Multiparameteric prosatate MRI images from a 50 year old man with elevated PSA demonstrate a 1.3 cm mass (arrows) in the right peripheral zone that is markedly hypointense on ADC (a), markedly hyperintense on corresponding DWI image (b) and circumscribed, moderately hypointense on axial T2W(c). Based on this measurement, the lesion would be assigned a PI-RADS score of 4. However, this lesion is actually larger in the coronal plane, measuring 1.8 cm (d). Therefore, the overall PIRADS score is 5 rather than 4
DWI scoring
In the peripheral zone, evaluating the signal intensity of a lesion on high b-value DWI allows the reader to distinguish between PI-RADS DWI scores of 3 and ≥4. To assign a score of ≥4 for DWI, the lesion must be hyperintense on DWI with corresponding hypointensity on the ADC map (Fig 3 b and c). A lesion with low signal on ADC map but with isointensity or mild hyperintensity on DWI will receive a PI-RADS score of 3 (Fig 4 b and c).
T2W scoring
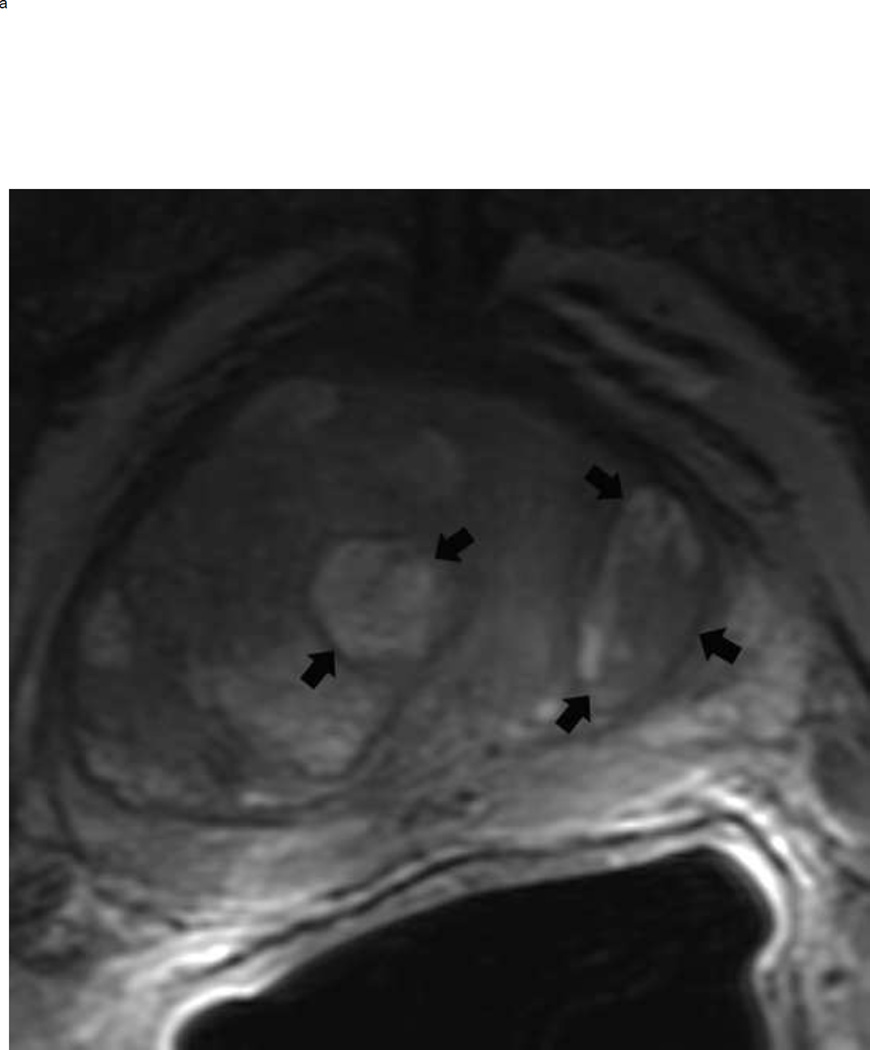
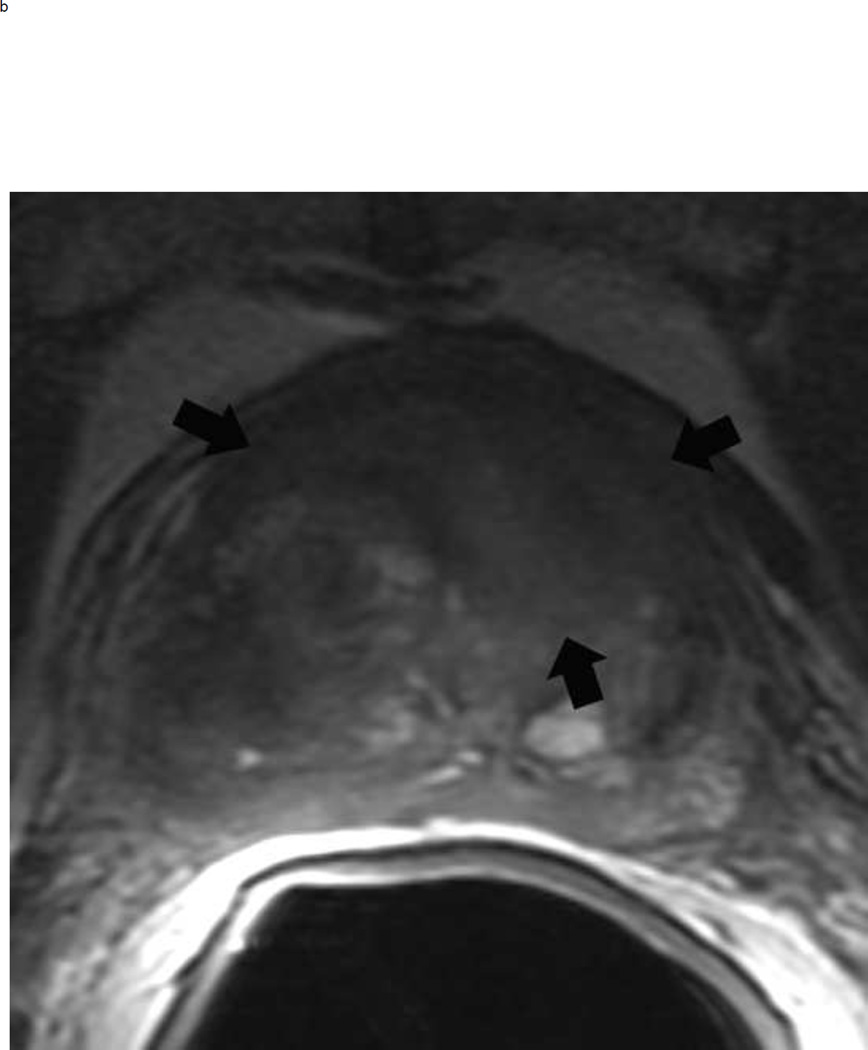
The dominant sequence in the transition zone is T2-weighted imaging. Clinically significant cancers (PI-RADS ≥ 4) are typically lenticular or non-circumscribed, homogeneous, and moderately hypointense on T2-weighted images. In contrast, equivocal tumors (PI-RADS 3) may be more heterogeneous on the T2 weighted images and have obscured margins. Benign findings in the transition zone (benign prostatic hyperplastic nodules) are circumscribed while tumors traditionally have been described as having a “smudged charcoal” appearance. In fact obscure margins, lack of capsule and homogenous hypointensity are characteristics of a high score lesion (Fig 10).
Fig 10.
BPH nodules appear different from a tumor in the transition zone on T2 weighted imaging. To confidently make the diagnosis of a BPH nodule, the lesion should always be encapsulated but can be hypointense or heterogeneous on T2W image. The typical appearance of BPH nodules (arrows) is shown on the left, and these would be assigned a PI-RADS score of 2 (a). In contrast, a tumor (arrows) will be ill-defined and more homogenously hypointense (b). This mass measured > 1.5 cm and should be assigned a PI-RADS score of 5. Note: BPH = benign prostatic hyperplasia
Conclusion
By using this simplified algorithmic approach, readers of varying levels of experience with prostate MRI should be able to confidently provide an overall suspicion score for each focal lesion detected at mpMRI.
PI-RADS v2 represents an improvement over PI-RADS v1 as it has increased the standardization of prostate MRI reporting by providing an overall assessment based on the appearance of a lesion on T2 weighted, DWI, and DCE sequences (15). This clinically useful information, along with simplified image interpretation utilizing a binary score for DCE and the concept of a dominant sequence based on zonal anatomy, should hopefully increase utilization and lead to improved patient care (15). Though it has only recently been introduced into routine clinical practice, several studies have evaluated the performance characteristics of PIRADS v2and these compare favorably to what has been achieved with PI-RADS v1 (16, 17). In a single center study of fiver readers, PI-RADS v2 had moderate agreement (κ =0.46) for the overall suspicion score in a cohort of treatment naive patients (14). This same study also demonstrated an equivalent sensitivity and specificity in the transition zone and the peripheral zone, an improvement over PI-RADS v1 (14). In a two reader retrospective cohort study, Kasel- Siebert et al. had substantial inter-reader agreement (κ=0.68) with slightly superior performance in the versus the PZ (18). Finally, a more recent study utilizing six experienced readers at multiple centers demonstrated moderate reproducibility with improved agreement in the peripheral zone compared to the transition zone (19).
Similar to the other RADS (i.e. BI-RADS, LI-RADS, etc), PI-RADS is a living document that is designed to be edited and revised in response to changes in technology and clinical practices. BI-RADS is currently in its 6th version and it is fully expected that version 3 of PIRADS will appear within the next few years. One current issue already under discussion is that of gadolinium. Specifically - is it really needed, what is the risk, benefit, and is it worth the extra cost? In PIRADS v1 the analysis of the gadolinium sequence involved full DCE curve evaluation (wash-in, wash out, and other PK parameters such as Ktrans) in all lesions. In PIRADS v2 this has been considerably simplified to a binary decision of whether the lesion enhances before the normal adjacent prostatic tissue or not. As described in this review, the role of the DCE sequence in PIRADS v2 is limited to assessment of focal lesions in the peripheral zone which are initially felt to be assessment score 3 by DWI. In this situation, if the lesion enhances (DCE +), it will lead to a change of assessment to an overall assessment 4. DCE is not used in any other situation, so it has a limited and thus questionable long-term viability as a critical must obtain sequence. A second area of increased interest is the option to include quantitative data to the current qualitative assessment. The most reported quantitative variable is the ADC from the b1400 or higher sequence. Hassanzadeh et al have shown in early work the value of calculating and reporting the mean ADC (20).
PI-RADS v2 is the most recent guideline for prostate cancer mpMRI image acquisition and interpretation. The overall PI-RADS suspicion score of a lesion should convey the probability of a clinically significant cancer. Interpreting radiologists should be aware of common mimics of clinically significant cancer as well as imaging pearls to aid in cancer detection and diagnosis. Optimization of technical considerations and image acquisition will also improve study quality. In summary, PI-RADS v2 can be used to aid prostate mpMRI interpretation for cancer detection and risk stratification in treatment naive patients with suspicious cancer.
Fig 7.
PI-RADS 3 lesion in the right peripheral zone in a 59 year old man with an elevated PSA. Axial T2 weighted image demonstrates a non-circumscribed rounded moderate signal intensity lesion in the right peripheral PZpl sector (arrows) (a). The lesion is mildly hyperintense on high b-value diffusion weighted image (b) and mildly hypointense on ADC map (arrows) (c). DCE is negative as there is no focal enhancement (arrows) (D). The overall PI-RADS score is 3.
Acknowledgments
Grant funding provided by:
National Institutes of Health grant number: U01CA151261 (FMF)
National Institutes of Health grant number: R25CA89017 (DIG)
Massachusetts Department of Public Health grant number: DPH403516 (EH)
National Institutes of Health grant number: P41 EB015898 (CT, FMF)
Footnotes
Conflict of Interest:
The authors declare no conflict of interest.
Compliance with Ethical Standards:
Ethical approval:
The study was HIPAA compliant and approved by the Institutional Review Board. Informed consent was waived because of the retrospective nature of the study.
References
- 1.Cancer Facts & Figures 2016. Atlanta: American Cancer Society; 2016. [cited 2016 2/11/2016]. [Google Scholar]
- 2.Etzioni R, Penson DF, Legler JM, et al. Overdiagnosis due to prostate-specific antigen screening: lessons from U.S. prostate cancer incidence trends. J Natl Cancer Inst. 2002;94(13):981–990. doi: 10.1093/jnci/94.13.981. [DOI] [PubMed] [Google Scholar]
- 3.Schoots IG, Roobol MJ, Nieboer D, Bangma CH, Steyerberg EW, Hunink MG. Magnetic resonance imaging-targeted biopsy may enhance the diagnostic accuracy of significant prostate cancer detection compared to standard transrectal ultrasound-guided biopsy: a systematic review and meta-analysis. Eur Urol. 2015;68(3):438–450. doi: 10.1016/j.eururo.2014.11.037. [DOI] [PubMed] [Google Scholar]
- 4.Epstein JI, Feng Z, Trock BJ, Pierorazio PM. Upgrading and downgrading of prostate cancer from biopsy to radical prostatectomy: incidence and predictive factors using the modified Gleason grading system and factoring in tertiary grades. Eur Urol. 2012;61(5):1019–1024. doi: 10.1016/j.eururo.2012.01.050. [DOI] [PMC free article] [PubMed] [Google Scholar]
- 5.Penzkofer T, Tuncali K, Fedorov A, et al. Transperineal in-bore 3-T MR imaging-guided prostate biopsy: a prospective clinical observational study. Radiology. 2015;274(1):170–180. doi: 10.1148/radiol.14140221. [DOI] [PMC free article] [PubMed] [Google Scholar]
- 6.Rifkin MD, Zerhouni EA, Gatsonis CA, et al. Comparison of magnetic resonance imaging and ultrasonography in staging early prostate cancer. Results of a multi-institutional cooperative trial. N Engl J Med. 1990;323(10):621–626. doi: 10.1056/NEJM199009063231001. [DOI] [PubMed] [Google Scholar]
- 7.Barentsz JO, Richenberg J, Clements R, et al. ESUR prostate MR guidelines 2012. Eur Radiol. 2012;22(4):746–757. doi: 10.1007/s00330-011-2377-y. [DOI] [PMC free article] [PubMed] [Google Scholar]
- 8.Hamoen EH, de Rooij M, Witjes JA, Barentsz JO, Rovers MM. Use of the Prostate Imaging Reporting and Data System (PI-RADS) for Prostate Cancer Detection with Multiparametric Magnetic Resonance Imaging: A Diagnostic Meta-analysis. Eur Urol. 2015;67(6):1112–1121. doi: 10.1016/j.eururo.2014.10.033. [DOI] [PubMed] [Google Scholar]
- 9.Hansford BG, Peng Y, Jiang Y, et al. Dynamic Contrast-enhanced MR Imaging Curve-type Analysis: Is It Helpful in the Differentiation of Prostate Cancer from Healthy Peripheral Zone? Radiology. 2015;275(2):448–457. doi: 10.1148/radiol.14140847. [DOI] [PubMed] [Google Scholar]
- 10.Platzek I, Borkowetz A, Toma M, et al. Multiparametric Prostate Magnetic Resonance Imaging at 3 T: Failure of Magnetic Resonance Spectroscopy to Provide Added Value. J Comput Assist Tomogr. 2015;39(5):674–680. doi: 10.1097/RCT.0000000000000261. [DOI] [PubMed] [Google Scholar]
- 11.Tan CH, Hobbs BP, Wei W, Kundra V. Dynamic contrast-enhanced MRI for the detection of prostate cancer: meta-analysis. AJR Am J Roentgenol. 2015;204(4):W439–W448. doi: 10.2214/AJR.14.13373. [DOI] [PMC free article] [PubMed] [Google Scholar]
- 12.Weinreb JC, Barentsz JO, Choyke PL, et al. PI-RADS Prostate Imaging - Reporting and Data System: 2015, Version 2. Eur Urol. 2016;69(1):16–40. doi: 10.1016/j.eururo.2015.08.052. [DOI] [PMC free article] [PubMed] [Google Scholar]
- 13.Barentsz JO, Weinreb JC, Verma S, et al. Synopsis of the PI-RADS v2 Guidelines for Multiparametric Prostate Magnetic Resonance Imaging and Recommendations for Use. Eur Urol. 2016;69(1):41–49. doi: 10.1016/j.eururo.2015.08.038. [DOI] [PMC free article] [PubMed] [Google Scholar]
- 14.Muller BG, Shih JH, Sankineni S, et al. Prostate Cancer: Interobserver Agreement and Accuracy with the Revised Prostate Imaging Reporting and Data System at Multiparametric MR Imaging. Radiology. 2015;277(3):741–750. doi: 10.1148/radiol.2015142818. [DOI] [PMC free article] [PubMed] [Google Scholar]
- 15.Rosenkrantz AB, Oto A, Turkbey B, Westphalen AC. Prostate Imaging Reporting and Data System (PI-RADS), Version 2: A Critical Look. AJR Am J Roentgenol. 2016;206(6):1179–1183. doi: 10.2214/AJR.15.15765. [DOI] [PubMed] [Google Scholar]
- 16.Rosenkrantz AB, Kim S, Lim RP, et al. Prostate cancer localization using multiparametric MR imaging: comparison of Prostate Imaging Reporting and Data System (PI-RADS) and Likert scales. Radiology. 2013;269(2):482–492. doi: 10.1148/radiol.13122233. [DOI] [PubMed] [Google Scholar]
- 17.Schimmöller L, Quentin M, Arsov C, et al. Inter-reader agreement of the ESUR score for prostate MRI using in-bore MRI-guided biopsies as the reference standard. Eur Radiol. 2013;23(11):3185–3190. doi: 10.1007/s00330-013-2922-y. [DOI] [PubMed] [Google Scholar]
- 18.Kasel-Seibert M, Lehmann T, Aschenbach R, et al. Assessment of PI-RADS v2 for the Detection of Prostate Cancer. Eur J Radiol. 2016;85(4):726–731. doi: 10.1016/j.ejrad.2016.01.011. [DOI] [PubMed] [Google Scholar]
- 19.Rosenkrantz AB, Ginocchio LA, Cornfeld D, et al. Interobserver Reproducibility of the PI-RADS Version 2 Lexicon: A Multicenter Study of Six Experienced Prostate Radiologists. Radiology. 2016:152542. doi: 10.1148/radiol.2016152542. [DOI] [PMC free article] [PubMed] [Google Scholar]
- 20.Hassanzadeh E, Olubiyi OI, Fedorov A, Glazer DI, Tempany CM, Fennessey FM. Comparison of performance of quantitative ADC versus PI-RADS v2 assessment for differentiating high-grade from low-grade prostate cancer. ISMRM 24th Annual Meeting; Singapore. 2016. [Google Scholar]


