Abstract
Context:
The format of a synoptic report can significantly affect the accuracy, speed, and preference with which a reader can retrieve information.
Objective:
The objective of this study is to compare different formats of Gleason grading/score in synoptic reports of radical prostatectomies.
Methods:
The performance of 16 nonpathologists (cancer registrars, MDs, medical non-MDs, and nonmedical) at identifying specific information in various formatted synoptic reports using a computerized quiz that measured both accuracy and speed.
Results:
Compared to the standard format (primary, secondary, tertiary grades, and total score on separate lines), omitting tertiary grade when Not applicable reduced accuracy (72 vs. 97%, P < 0.001) and increased time to retrieve information 63% (P < 0.001). No user preferred to have tertiary grade omitted. Both the biopsy format (primary + secondary = total score, tertiary on a separate line) and the single line format (primary + secondary + (tertiary) -> total score) were associated with increased speed of data extraction (18 and 24%, respectively, P < 0.001). The single line format was more accurate (100% vs. 97%, P = 0.02). No user preferred the biopsy format, and only 7/16 users preferred the single line format.
Conclusions
Different report formats for Gleason grading significantly affect users speed, accuracy, and preference; users do not always prefer either speed or accuracy.
Keywords: Accuracy, anatomic pathology, College of American Pathologists, Gleason grade, prostate, surgical pathology, synoptic report, templates, tumor summaries, usability
INTRODUCTION
Synoptic reporting of all tumor excisions is required by the College of American Pathologists (CAP). The CAP specifically requires that each element in a synoptic report be reported in a required data element (RDE) pair consisting of the element and the corresponding response (CAP Laboratory Accreditation Process checklist question ANP. 12385).[1] However, recent studies suggest that specific formatting features are associated with not only the accuracy of the information entered into the report,[2,3] but also user preference, accuracy of information retrieval, and speed of information retrieval.[2,3,4,5,6,7] Currently, CAP requires that each element of the Gleason grading system (primary pattern, secondary pattern, tertiary pattern, and total score) be reported on separate lines as separate and distinct RDEs,[1] despite the fact that in the biopsy setting these elements are reported on one line as primary pattern + secondary pattern = total score with tertiary pattern on a separate line if and only if it is present.[8,9] Whether these or other formats might affect the reader's experience is not known. We sought to determine if such differences in reporting formats would affect the speed or accuracy of information retrieval by nonpathologists reading synoptic reports of prostatectomy specimens.
METHODS
To test the accuracy and speed of identification of specific data elements in a synoptic report, a Python script was written that provided instructions and a test platform for these quizzes.[4] Specifically, the participant is shown a specific phrase that may or may not be in a synoptic report (with exceptions listed below). When the user presses enter the synoptic report appears on the screen and the timer starts. The user then examines the report to determine if the phrase is or is not present. If it is present, they enter the number two, if it is not they enter 1 and then press return. The timer stops when the return is entered. The program automatically records the time and whether the answer was correct, and this data is then transferred to a comma separated values file for further analysis.
We constructed our synoptic report for a radical prostatectomy using the checklist from CAP, [Figure 1] for the standard format. All elements were identical except for changes in the reporting of Gleason grade (primary grade, secondary grade, tertiary grade, and total score). The formats were tested in three different quizzes, each given in sequence and at the same sitting. The first quiz contained 36 total questions and compared the standard format [Figure 1] with a format in which if there was no tertiary grade the line concerning tertiary grade was omitted [Figure 2]. In the standard format, the response for tertiary grade could be 3, 4, 5, or “Not applicable.” There was no response or RDE when tertiary grade was omitted. The question in quiz one was always “Is the tertiary grade?, where? could be 3, 4, 5, or “Not applicable.” If tertiary grade was omitted, the correct answer was “Not applicable.” All questions were presented in random order to each participant.
Figure 1.
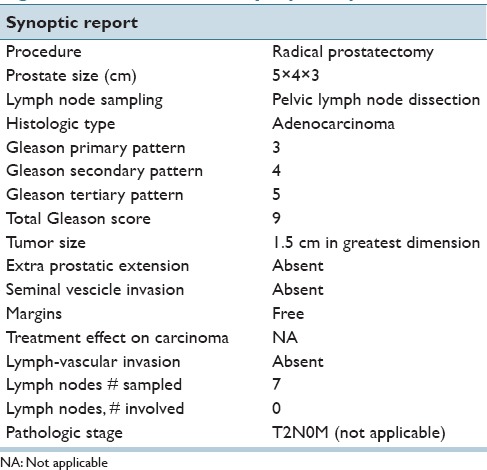
Standard format synoptic report
Figure 2.
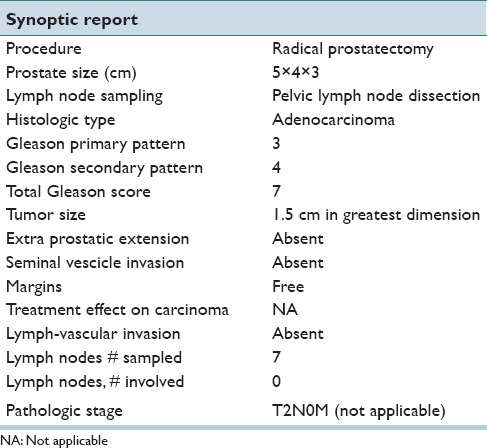
Tertiary grade omitted because it was not applicable/present
Quiz two contained 32 questions and compared the standard format [Figure 1] with a biopsy format, [Figure 3], where Gleason grades are reported as primary pattern + secondary pattern = total score on one line and tertiary pattern is on a separate line. Although this format is taken from and labeled as “biopsy format,” for this quiz, the total score was calculated as it is for prostatectomies where primary plus secondary regardless of the tertiary pattern (also regardless of whether it was <5% or >5% of tissue) which was reported separately. The question for this part could pertain to any of the 4 elements (primary pattern, secondary pattern, total score, and tertiary pattern), and the answers could be any of 3,4,5,6,7,8,9, or 10 (“Not applicable” was not included). In order for the participant to know which format to expect, 16 questions with the standard format were presented and then 16 questions with the biopsy format. Within each group, the order of questions were randomized for each participant, but each participant got the exact same questions for each group.
Figure 3.
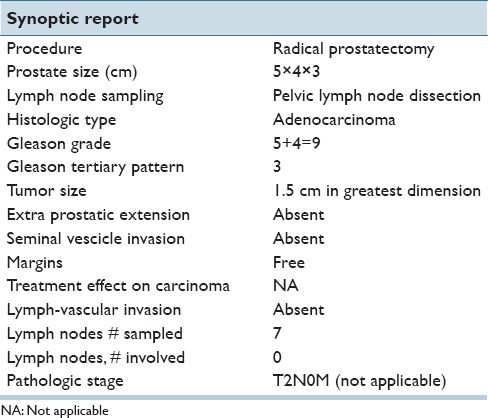
Biopsy format synoptic report
Quiz three contained 32 questions and compared the standard format [Figure 1] with a biopsy format, [Figure 4], where Gleason grades are reported as primary pattern + secondary pattern + (tertiary pattern) -> total score on one line. The question for this part could pertain to any of the four elements (primary pattern, secondary pattern, total score, and tertiary pattern), and the answers could be any of 3,4,5,6,7,8,9, or 10 (“Not applicable” was not included). In order for the participant to know which format to expect, 16 questions with the standard format were presented and then 16 questions with the biopsy format. Within each group, the order of questions were randomized for each participant, but each participant got the exact same questions for each group.
Figure 4.
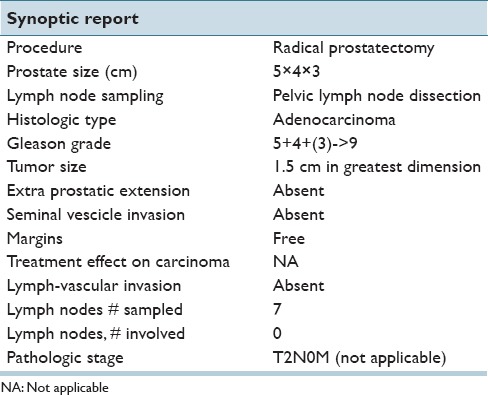
Single line synoptic report
Sixteen participants completed all three quizzes. They were all nonpathologists and included, five cancer registrars, four MDs (all internists), four non-MD medical personnel (all laboratory technologists), and three nonmedical personnel (administrative assistants, other professionals). We specifically excluded pathologists from this testing, since we wanted to measure the performance of a user other than a pathologist. Similarly, although we have no evidence that different types of readers perform differently on these tests than any other type of reader,[4] like pathologists we did not include urologists to ensure that their particular set of knowledge and experience did not influence the results. Although, previous studies have suggested that in this type of test format there were no significant differences between these different users in terms of accuracy or time to retrieval of information,[4] this was again tested in the current study.
Previously we had noted that participants got faster from quiz 1 to quizzes 2 and 3 as they got practice with the test. As a result, no comparison was made between the three quizzes, and all three quizzes were always taken in the same order. In addition, there was a wide range of speed for the different users. In order to allow comparison between these uses, times were normalized to the mean of the standard format for each user. As a result, the normalized time for the standard format was the control with a normalized time of one, and the time for all other formats was in comparison with that time.
Statistical analysis was performed using a t-test or Fishers exact test as appropriate with a significance threshold of 0.05.
RESULTS
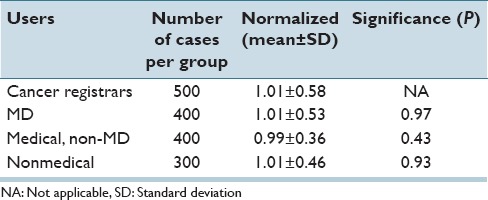
As shown in Table 1, the nonmedical group had a significantly higher accuracy rate than the cancer registrars (P = 0.02). As a result, any significant findings related to accuracy using grouped data also underwent subset analysis. There was no significant difference in normalized times between any of the four user groups, [Table 2].
Table 1.
Accuracy for different users compared to cancer registrars
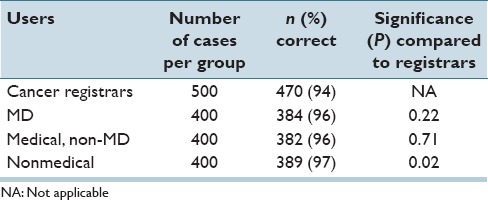
Table 2.
Normalized time for all questions for different users compared to cancer registrars
When tertiary grade was omitted whenever the result was “Not applicable,” the accuracy of classification by the readers was significantly lower than when tertiary grade was listed [72 vs. 97%, P < 0.001 Table 3]. This difference remained true when nonmedical users (77 vs. 98%, P < 0.001) were evaluated as well as when all other users were evaluated (70% vs. 97%, P < 0.001). In addition, when tertiary grade was omitted, the time to answer the question increased significantly (63%, P < 0.001) [Table 4]. No user preferred to have tertiary grade omitted.
Table 3.
Accuracy for different formats compared to standard format

Table 4.
Normalized time compared to standard format

When the standard format (all four elements each on a separate line) was compared with the biopsy format (primary + secondary = total, with tertiary on a separate line), there was no difference in accuracy of data extraction (98 vs. 97%, P = 0.56), however, the time needed to extract the data decreased 18% with the biopsy format (P < 0.001). Nevertheless, no user preferred the biopsy format.
When the standard format was compared with a single line format (primary + secondary + (tertiary) -> total), the accuracy increased from 97% to 100% (P = 0.02) using the single line format. Subset analysis showed that the group with the biggest difference were the registrars (6/7 errors with the standard format). The time to extract the data also decreased 24% (P < 0.001) with the single line format. Nine users preferred the standard format and seven the single line format, even though they were more accurate and faster with the single line format.
DISCUSSION
The data in this report suggest three major conclusions: Removing “not applicable” elements from a synoptic report can reduce both the accuracy and speed of information retrieval, combining all elements of Gleason grading on one line significantly improves the accuracy and speed of information retrieval from synoptic reports, and users’ preferences may not always correlate with either accuracy or speed. These results were similar across a wide variety of different users, just as they were in our previous studies.[4] Our unpublished data suggest that pathologist and surgeons also perform in a similar manner.
One of the original intents of synoptic reporting was to have one data element per line, making automated data extraction easier. However, as the tools available for data extraction have evolved, and as the field has moved to data extraction before generating the pathology report,[10] this restriction may not be as important as it has been in the past. In particular with Gleason grading, the use of “+” and “=” signs makes regular expression extraction of multiple pieces of information from a single line both easy and routine. In this context, other factors, such as end users ability to quickly and correctly extract information from the report may be of increased value.
It is not a surprise that removing elements form a synoptic report reduces the speed of identification of such elements. It has previously been documented that having a reproducible format where all elements are always included in exactly the same order has been associated with faster information identification.[4] When not applicable elements are missing, the reader has to first ensure that indeed they are missing before they can then conclude that they are not applicable. However, we were surprised that removing items from the synoptic format also reduced the accuracy of the response. We do not have a good explanation for this sharp decrease in accuracy. Nevertheless, in constructing synoptic reports, there are many opportunities where omitting “not applicable” elements would reduce the length of the report, a feature that has previously been shown to be associated with decreased error in constructing the synoptic report.[11] Whether the benefit in terms of error by making the report shorter outweigh the reduced accuracy of interpretation by leaving out this information is not clear at this time.
It is also not a surprise that combining all parts of Gleason grading into one line is associated with faster information retrieval. A user can read one line faster than 4. However, in the standard format, the information (response) in those four separate lines consists only of a number and the label that explains the number (RDE) is separated from it on the other side of the page. In discussing this with the participants, they felt that the reason that the single line was faster was not just because it was a single line, but also because they could simply look down the right-hand side of the report (the responses) to find the grading section without referring to any RDE. This was because the format of the grading information had a structure that was easily identifiable, unique from all other responses in the report, and conveyed information without having to refer to the listed RDE. Thus, having a unique structure to the response and not just the RDE is a key part of improving the speed of information retrieval from a synoptic report. This hypothesis is also consistent with our previous studies that examined the effect of different formats.[4]
Nevertheless, the format of reporting Gleason patterns/grades and scores has been the subject of considerable discussion previously.[8,9] Most importantly, the reasons one may prefer one format over another is multifaceted, and the information in the current study is just one aspect of this discussion. The information we present may be of value in future discussions by pathologists and organizations such as the International Society of Urologic Pathologists who make recommendations using all of the different aspects that affect reporting of Gleason grading/scoring. At present, though, current recommendations make a distinction between reporting formats for biopsies and prostatectomies. Specifically, in the biopsy specimen if the tertiary pattern is high grade then that is reported as the secondary pattern rather than the “true” secondary pattern. This is done to ensure that the presence of this tertiary pattern is not overlooked by either clinicians or other readers, who may simply omit or skip the presence of a high-grade tertiary pattern if it is only reported in a note. While the rationale for this practice is clear, it does bring up two issues. First, since it is ambiguous whether the second number represents a “true” secondary pattern or a high-grade tertiary pattern, this form of reporting is subject to information loss. Specifically, if one reads a report with a Gleason score of 3 + 5, one cannot tell from the report whether there are only two patterns (3 and 5) present in this biopsy, or whether this is a biopsy with patterns 3, 4 and a tertiary pattern 5. This may in part explain some of the controversy associated with assigning Gleason score 3 + 5 cases in the newly proposed Gleason groups.[9,12]
More importantly, there is an assumption in this analysis that the only other way to report tertiary grades is as a separate note. As our study clearly shows, this is not true. This study uses just one of many possible options for reporting all four elements on one line. While the order is intuitive (primary secondary tertiary and total in that order) the signs that are used to distinguish between the different patterns are not and could be changed if different signs were identified that could convey more information than the signs we have used here. Obviously using a plus signs and an equal sign implies that the numbers will add up, and in this format that is not true, and is the reason why we put tertiary patterns in parentheses. Using a grade of “0” may also be easier to interpret than using the phrase “Not applicable” or “NA” for an absence of a tertiary pattern. Further study of different formats appears warranted.
Finally, recent studies have also suggested that the percentage of high-grade tumor should also be reported as this may also be prognostically significant[13] as well as Gleason groups.[9] Whether and how this information may be incorporated into a single line format is not clear at this time. Nevertheless, the need to begin reporting Gleason groups is an opportunity to re-address the most effective format for reporting all elements in Gleason grading. The data we provide in this report may be of value in this discussion.
There are several limitations to the current study. First data recognition and user preference are just a few elements of the user interaction with a synoptic report. Comprehension is another facet which was not tested in the current study. Indeed, several of the nonmedical participants noted that while they could perform the study, they really did not understand the meaning of the phrases they were looking for. This in part explains why we were unable to find a consistent difference in the performance between our different user groups – this test measures the users’ ability to read and identify information, regardless of their understanding of that information. Other measures that focused on comprehension would most likely find significant differences between these different types of users.
CONCLUSIONS
Different report formats for Gleason grading significantly affect users speed, accuracy, and preference; users do not always prefer either speed or accuracy. The data and study design we describe may be useful in deciding between different format options.
Financial Support and Sponsorship
Nil.
Conflicts of Interest
There are no conflicts of interest.
Footnotes
Available FREE in open access from: http://www.jpathinformatics.org/text.asp?2016/7/1/54/197201
REFERENCES
- 1.College of American Pathologists. Inspection Checklist in Anatomic Pathology. 2016. [Last accessed on 2016 Jan 08]. Available from: http://www.cap .
- 2.Renshaw MA, Gould EW, Renshaw A. Just say no to the use of no: Alternative terminology for improving anatomic pathology reports. Arch Pathol Lab Med. 2010;134:1250–2. doi: 10.5858/2010-0031-SA.1. [DOI] [PubMed] [Google Scholar]
- 3.Renshaw SA, Mena-Allauca M, Touriz M, Renshaw A, Gould EW. The impact of template format on the completeness of surgical pathology reports. Arch Pathol Lab Med. 2014;138:121–4. doi: 10.5858/arpa.2012-0733-OA. [DOI] [PubMed] [Google Scholar]
- 4.Renshaw AA, Gould EW. Comparison of accuracy and speed of information identification by non-pathologists in synoptic reports with different formats. Arch Pathol Lab Med [In press] doi: 10.5858/arpa.2016-0216-OA. [DOI] [PubMed] [Google Scholar]
- 5.Valenstein PN. Formatting pathology reports: Applying four design principles to improve communication and patient safety. Arch Pathol Lab Med. 2008;132:84–94. doi: 10.5858/2008-132-84-FPRAFD. [DOI] [PubMed] [Google Scholar]
- 6.Strickland-Marmol LB, Muro-Cacho CA, Barnett SD, Banas MR, Foulis PR. College of American Pathologists cancer protocols: Optimizing format for accuracy and efficiency. Arch Pathol Lab Med. 2016;140:578–87. doi: 10.5858/arpa.2015-0237-OA. [DOI] [PubMed] [Google Scholar]
- 7.Aumann K, Niermann K, Asberger J, Wellner U, Bronsert P, Erbes T, et al. Structured reporting ensures complete content and quick detection of essential data in pathology reports of oncological breast resection specimens. Breast Cancer Res Treat. 2016;156:495–500. doi: 10.1007/s10549-016-3769-0. [DOI] [PubMed] [Google Scholar]
- 8.Epstein JI, Allsbrook WC, Jr, Amin MB, Egevad LL ISUP Grading Committee. The 2005 International Society of Urological Pathology (ISUP) Consensus Conference on Gleason grading of prostatic carcinoma. Am J Surg Pathol. 2005;29:1228–42. doi: 10.1097/01.pas.0000173646.99337.b1. [DOI] [PubMed] [Google Scholar]
- 9.Epstein JI, Egevad L, Amin MB, Delahunt B, Srigley JR, Humphrey PA Grading Committee. The 2014 International Society of Urological Pathology (ISUP) Consensus Conference on gleason grading of prostatic carcinoma: Definition of grading patterns and proposal for a new grading system. Am J Surg Pathol. 2016;40:244–52. doi: 10.1097/PAS.0000000000000530. [DOI] [PubMed] [Google Scholar]
- 10.Ellis DW, Srigley J. Does standardised structured reporting contribute to quality in diagnostic pathology. The importance of evidence-based datasets? Virchows Arch. 2016;468:51–9. doi: 10.1007/s00428-015-1834-4. [DOI] [PubMed] [Google Scholar]
- 11.Renshaw AA, Gould EW. The cost of synoptic reporting. Arch Pathol Lab Med. doi: 10.5858/arpa.2016-0169-LE. In press. [DOI] [PubMed] [Google Scholar]
- 12.Huynh MA, Chen MH, Wu J, Braccioforte MH, Moran BJ, D’Amico AV. Gleason score 3 + 5 or 5 + 3 versus 4 + 4 prostate cancer: The risk of death. Eur Urol. 2016;69:976–9. doi: 10.1016/j.eururo.2015.08.054. [DOI] [PubMed] [Google Scholar]
- 13.Egevad L, Delahunt B, Samaratunga H, Srigley JR. Utility of reporting the percentage of high-grade prostate cancer. Eur Urol. 2016;69:599–600. doi: 10.1016/j.eururo.2015.11.008. [DOI] [PubMed] [Google Scholar]


